Bulls Eye Fresh Gains in SilverSilver may be about to embark on another leg higher, bouncing strongly in Asia to move back towards resistance above $42.73.
Having tested the level multiple times earlier in the session only to be knocked back lower, a close above it on the hourly—or a definitive push to fresh highs—may be enough to draw in additional longs looking for an extension of the prevailing bullish trend.
Longs could be set above $42.73 with a stop below, targeting $43 initially given silver’s tendency to gravitate towards big and half-big figures. Beyond that, those chasing more from the move should be on the lookout for reversal patterns.
Momentum indicators are cautiously bullish, with RSI (14) and MACD showing signs of building topside pressure. That favours continuing to play silver from the long side
Good luck.
DS
Oscillators

PUT CREDIT SPREAD on RUT📈 Thesis: Bullish Momentum Strategy on RUT Using Neural RSI and ADX Pro
This strategy identifies long trade opportunities on the Russell 2000 (RUT) using two core indicators:
Simple Neural Network RSI: When this indicator is green, it signals bullish momentum. Green means go—whether it’s a breakout, reversal, or continuation.
ADX Pro: When rising, it confirms that the directional move is gaining strength.
🎯 Trade Setup
A long trade is initiated when:
The Neural RSI is green, indicating bullish momentum.
ADX Pro is rising, confirming trend strength.
📊 Metrics (Simple Compounding Model)
Trade Duration: 2 days
Spread Width: $5
Net Credit: $47
Capital at Risk: $500
ROI per Trade: 9.4%
One of the most consistent ways to generate income in options trading is by selling premium in high-probability environments. That means structuring trades where the odds are tilted in your favor—not by prediction, but by placement.
When you position short strikes outside the expected move, you're essentially betting that price will stay within its statistically forecasted range. It’s not about being right—it’s about being on the right side of probability.
Pair that with short durations—like 2-day trades—and you’re working with accelerated time decay. A 9% return in that window might seem small, but when repeated with discipline, it adds up quickly. The key is keeping risk defined, staying mechanical, and letting the math do the heavy lifting.
Premium collection isn’t flashy. It’s methodical. And when done right, it becomes a reliable engine for compounding gains while keeping exposure tight.

Weight of a gold slab. So, here's what I'm observing.
Today, perhaps the heaviest sumo wrestler crushing the altmarket is gold.
Have you noticed that the decline in Bitcoin dominance by whole percentage points is EXTREMELY MODEST (VERY EXTREMELY MODEST) and hasn't helped to OTHERS
strengthen position?
What's going on?!
I have already expressed the idea of “consecutive vessels” earlier,
based on the fact that one decline in Bitcoin dominance is not enough
for the alt season. To begin with, we need a strengthened ETH,
and then a decline in its ETH dominance... And so on.
And here is a very large inverse relationship for altcoins.
Gold futures…
If we open the composite monthly chart OTHERS.D/GC1! and apply Reverse RSI and
Price Heat Meter , we can clearly see that gold did not give the altcoins a break,
causing them to fall in inverse proportion to their growth.
The passage of candles below the green-turquoise line (1 point) indicates extreme
oversold altcoins, as this is a monthly chart.
Note (2 point) that in the case of the Price Heat Meter, a value of ~2% can also be interpreted
as extreme oversold (the kettlebell bottomed out).
A thin blue line is forming, and later the absolute minimum “cooling” mark will be
printed on it, after which a reversal will begin.
The candlestick pattern looks like a reversal is just around the corner.
However, the forecasts for gold are such that the market is going
to continue buying regardless of prices without a significant correction.
Honestly, I don't know the answer for gold.
I'm still thinking and don't know when I'll offer an idea for GC1!
But I know for sure that I will publish an update to this chart.

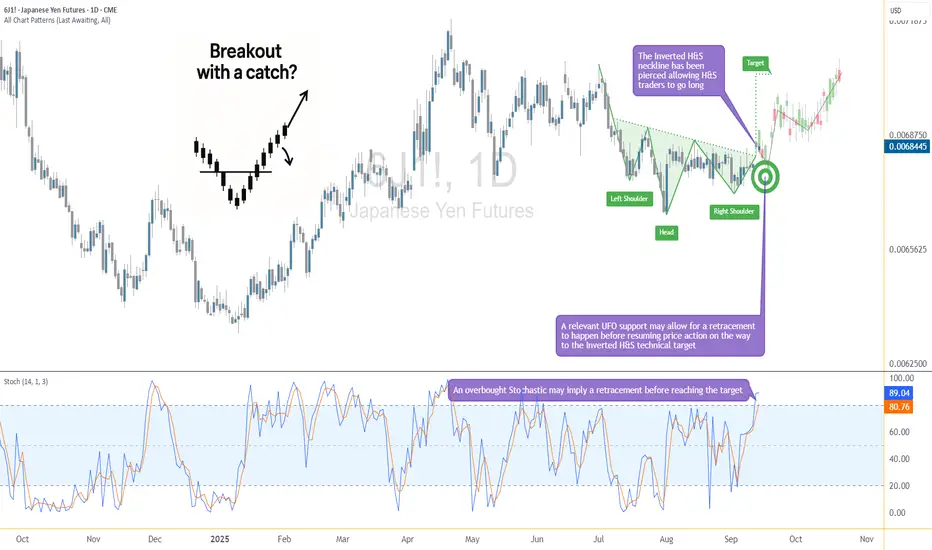
Breakout with a Catch: The Yen May Dip Before Lifting Off AgainThe Japanese Yen Futures (6J) have just pierced above a critical neckline at 0.0068220, completing an Inverted Head and Shoulders formation. This classical reversal pattern often signals a potential shift in momentum from bearish to bullish. Based on technical projections, the measured move points toward a target near 0.0070430, which lies significantly higher from current price levels.
Yet, there’s a catch. The Stochastic Oscillator has entered overbought territory, hinting that before the next upward leg develops, a retracement could occur. This makes the current setup particularly interesting, as the neckline breakout is bullish, but timing entries becomes crucial to avoid getting caught in a short-term dip.
Understanding the Inverted Head & Shoulders
The Inverted Head and Shoulders is one of the most recognized reversal patterns in technical analysis. It typically forms after a prolonged decline and suggests that bearish momentum is losing steam.
The structure consists of three parts:
Left Shoulder: the first swing low, followed by a rebound
Head: a deeper low, which marks the exhaustion of sellers
Right Shoulder: a higher low, indicating buyers are stepping in earlier
Neckline: the resistance level connecting the highs of the shoulders, acting as the trigger point
Once price pierces above the neckline, the pattern is considered complete. Traders often project the distance from the head to the neckline and extend it upward to identify a potential price objective. In this case, the neckline break projects a target near 0.0070430.
The reliability of this formation lies in its ability to signal a shift in trend sentiment. While no pattern is flawless, the inverted H&S is widely respected for its potential consistency.
The Role of Stochastic in This Setup
While the breakout above the neckline looks promising, momentum indicators suggest caution. The Stochastic Oscillator, a tool designed to measure overbought and oversold conditions, is currently flashing an overbought reading.
This does not necessarily mean that prices must reverse, but it does imply that the bullish move could pause or correct before resuming. In practical terms, traders might expect a short-term retracement as buying pressure temporarily exhausts itself.
Such pullbacks can be constructive within a broader bullish setup, especially if they occur near significant areas of support. By aligning the breakout pattern with Stochastic signals, traders can time their entries with more precision instead of chasing the market at stretched levels.
Support Zone & Safety Net
One of the strongest features of this setup is the presence of a relevant support area just below the neckline breakout level. This zone, also reinforced by a previously identified UFO support, could serve as a launching pad if prices retrace lower in the short term.
If 6J dips back toward the neckline, traders will be watching whether this level holds. A bounce from here would not only validate the breakout but also offer an attractive risk-to-reward setup. To manage downside exposure, a protective stop can be placed at 0.0067350, positioned below this key support zone.
This structure creates a layered safety net: first the neckline, then the underlying support, and finally the stop loss—offering multiple defenses against unfavorable moves before the bullish scenario invalidates.
Contract Specs & Margins (6J & MJY)
CME offers both the standard Japanese Yen Futures (6J) and the smaller-sized Micro JPY/USD Futures (MJY), giving traders flexibility depending on capital requirements and position sizing needs.
🟢 6J – Japanese Yen Futures
Contract size: ¥12,500,000
Minimum tick: 0.0000005 = $6.25
Initial margin: ≈ $3,100 (subject to CME updates)
🟢 MJY – Micro JPY/USD Futures
Contract size: ¥1,250,000 (1/10th of standard)
Minimum tick: 0.000001 = $1.25
Initial margin: ≈ $310 (subject to CME updates)
The Micro contracts replicate the price behavior of the standard Yen futures at a fraction of the size. This makes them attractive for traders who want to fine-tune risk exposure, scale in or out more precisely, or manage positions with smaller capital outlays.
Trade Plan Example
A structured trade idea can help frame the opportunity while managing risk effectively:
Direction: Long
Entry: Near 0.0068220 (neckline breakout level), or after a retracement toward support
Stop: 0.0067350 (below the support zone)
Target: 0.0070430 (measured objective from the inverted H&S)
Reward-to-Risk Calculation:
Potential reward = 0.0070430 – 0.0068220 = 0.0002210
Potential risk = 0.0068220 – 0.0067350 = 0.0000870
Approximate ratio = 2.5 : 1
This ratio is favorable, suggesting that the upside potential outweighs the defined downside exposure. Traders considering this setup may prefer to wait for a retracement toward support, which could enhance entry quality and improve the reward-to-risk profile even further.
The Importance of Risk Management
Even the most compelling technical setups require disciplined risk management. Using stop-loss orders is essential to protect capital against unexpected market swings, particularly in leveraged products like futures.
Position sizing is another key element—adjusting contract size to account size ensures that a single trade does not overexpose the portfolio. Micro contracts, such as MJY, are especially useful for traders looking to scale positions with precision.
Equally important is the principle of avoiding undefined risk. Every trade should have a clearly defined exit strategy, both for profits and losses. By knowing where to enter, where to exit, and where to cut losses, traders reduce emotional decision-making and maintain consistency.
Finally, patience plays a role. Waiting for a retracement into support rather than chasing a stretched market often improves entry quality, lowers risk, and increases the probability of success.
Conclusion
Japanese Yen Futures are showing signs of a potential trend shift as the inverted head and shoulders formation breaks above its neckline. The measured move points toward higher ground, but the overbought Stochastic warns that the path may not be in a straight line. A temporary dip into support could provide a second chance for bulls to position themselves with a favorable risk-to-reward profile.
By combining pattern recognition, momentum analysis, and precise trade planning, this setup highlights how technical structure and disciplined execution can align to create opportunity. Whether trading the standard 6J contract or the smaller MJY, the key remains the same: respect risk, trust the setup, and let the market confirm the move.
When charting futures, the data provided could be delayed. Traders working with the ticker symbols discussed in this idea may prefer to use CME Group real-time data plan on TradingView: www.tradingview.com - This consideration is particularly important for shorter-term traders, whereas it may be less critical for those focused on longer-term trading strategies.
General Disclaimer:
The trade ideas presented herein are solely for illustrative purposes forming a part of a case study intended to demonstrate key principles in risk management within the context of the specific market scenarios discussed. These ideas are not to be interpreted as investment recommendations or financial advice. They do not endorse or promote any specific trading strategies, financial products, or services. The information provided is based on data believed to be reliable; however, its accuracy or completeness cannot be guaranteed. Trading in financial markets involves risks, including the potential loss of principal. Each individual should conduct their own research and consult with professional financial advisors before making any investment decisions. The author or publisher of this content bears no responsibility for any actions taken based on the information provided or for any resultant financial or other losses.
RSI + MACD Cross + Morningstar = A+ RSI down from 65% on M15 + MACD crossover bearish + Morningstar. FVG below.
Took this trade just now. RSI was coming down from a high of 65%. Morningstar candle had printed recently (see circle), then MACD crossed over bearish. We are in range conditions so MACD not necessary but it's great to have that confluence as extra confirmation. Plus we have a lovely area of FVG below.
London loves to flip up and down in the morning. You can make some great profit catching these moves. I normally trade these on M5, but the setup was cleaner on M15 this morning.
Improvements - could have entered earlier (or later) for much better R:R.

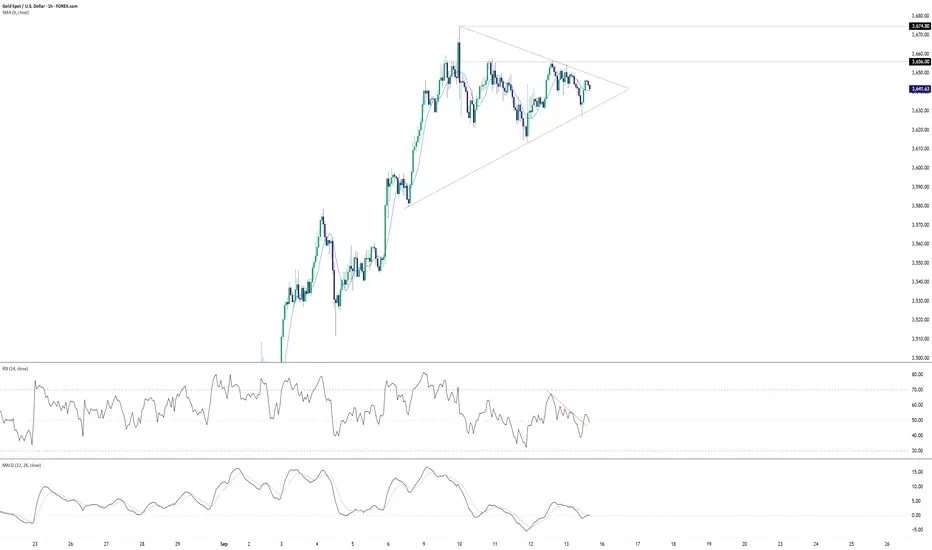
Gold breakout risk builds with pennant patternGold is coiling within a bull pennant pattern on the hourly, pointing to the potential for a topside break and eventual retest of the record high at $3674.80.
Should we close above pennant resistance, longs could be established on the break with a stop beneath for protection. $3656 looms as an initial target, given the price tagged it on no fewer than 11 occasions over the past week but only closed above it once—when the record high was set. If the price can successfully push above $3660 and hold there, it may encourage additional bulls to join in the move targeting $3674.80.
An alternative setup would be to wait for a potential break and close above $3660 before initiating longs, allowing for a stop to be placed beneath for protection while targeting the record highs.
Momentum indicators are providing an inconclusive message on directional risks with RSI (14) and MACD sitting in neutral territory. More emphasis should therefore be placed on price action for guidance rather than adopting a specific bias.
Good luck!
DS
TOTAL3 / ETH - 3 White Soldiers3 White Soldiers printed on the TOTAL3 / ETH Weekly Close.
Oversold RSI confirms the bottom.
Should reclaim that 9WEMA this week.

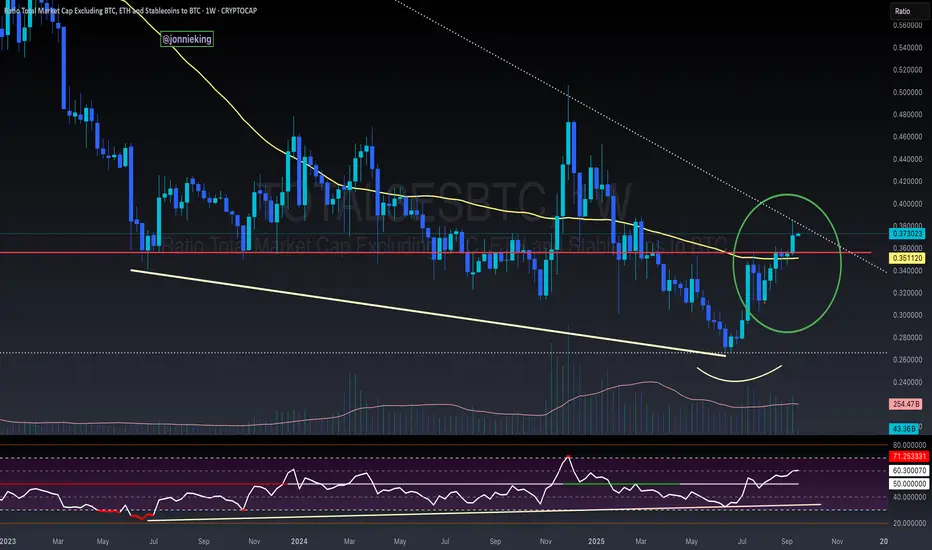
$TOTAL3 / $BTC More Confirmation for Alt Season RotationWe already saw this pattern play out with CRYPTOCAP:TOTAL2 / CRYPTOCAP:BTC and now we have it with CRYPTOCAP:TOTAL3 confirming the rotation into smaller caps.
4th consecutive Weekly close above the 50WMA.
Notice the Bullish Divergence with the RSI.
I’d like to see a few closes above this trend line for added confirmation, but I’m confident we’ve changed the trend.
Note CRYPTOCAP:OTHERS is not there yet, hence why its BTC -> ETH -> Large Caps (SOL).
$SOL / $BTC 50WMA Reclaimed - Alt Season Confirmed!Ladies and Gentlemen,
CRYPTOCAP:SOL / CRYPTOCAP:BTC has officially closed the Week above the 50WMA and is back within the POI.
Double bottom confirmed this setup.
Along with the longest cup and handle I’ve ever seen lol.
Let the rotation for Alt Season begin!

JBERGER LONG IDEA JBERGER stock broke out of a bearish trendline and retested the resistance level as a support level. This was followed by a bullish candle. All these happened while the stock was in oversold region. This is an indication that there's a pressure from the buyers to push price higher.
To take advantage of this opportunity, you can buy at the current market price. The targets are N173.7 (19.34%), 198 (35.80%) and N229.3 (57.75%).
Confluences for the buy opportunity:
1. Breakout of bearish trendline sponsored by a bullish trendline.
2. Retest of the support level.
3. Bullish intention signal from the awesome oscillator.
Disclaimer: this is not a financial advice. The outcome maybe different from the projection. Don't invest your money on the stock if you're not willing to accept the risk.

ARADEL LONG IDEA ARADEL stock just broke out of a bearish trendline with a strong bullish weekly candle. The candle closure above the trendline and resistance level is an indication that there is a pressure from the buyers to push price higher.
To take advantage of this opportunity, you can buy at the current market price, or you can wait for price to drop to the areas between N545 and N535. The targets are N666 (21.55%) and N850 (55.96%).
Confluences for the buy opportunity:
1. Breakout of bearish trendline sponsored by a bullish trendline.
2. Bullish divergence signal from the awesome oscillator.
3. Candle closure above trendline and resistance level.
Disclaimer: this is not a financial advice. The outcome maybe different from the projection. Don't invest your money on the stock if you're not willing to accept the risk.

SUNUASSUR LONG IDEASUNUASSUR stock got rejected from a support level, which led to the formation of bullish engulfing candlestick. This is an indication that there is a pressure from the buyers to push price higher.
To take advantage of this opportunity, you can buy at the current market price. The targets are N7.30 (23.73%), N8.40 (42.37%) and N11.65 (97.46%).
Confluences for the long idea:
1. Breakout of a bearish trendline sponsored by a bullish trendline.
2. Retest of the support level.
3. Rejection from the support level and bullish engulfing candlestick.
4. Bullish intention signal from the awesome oscillator.
Disclaimer: this is not a financial advice. The outcome maybe different from the projection. Don't invest your money on the stock if you're not willing to accept the risk.

Aud bullish head and shouldersAudi’s bullish head and shoulders
Plus oscillators
The AUD/USD pair posts a fresh 10-month high near 0.6670 during the European trading session on Friday. The Aussie pair strengthens as the Australian Dollar outperforms its peers amid cheerful market sentiment. S&P 500 futures are marginally down during the European trading session, but gained 0.85% on Thursday.

EURAud trendy bearish head and shoulders for the winEURAud gave a head and shoulders sell signal.
All technical indicators said sell and this paid off well
The Aussie pair strengthens as the Australian Dollar outperforms its peers amid cheerful market sentiment. S&P 500 futures are marginally down during the European trading session, but gained 0.85% on Thursday.

GBPJPY bullish head and shoulders with room to growGJ is showing very good upside potential. This is based on head and shoulders… gj needs room to run and is showing another head and shoulders up
a broadly weaker Japanese Yen on Friday. Market concerns about the political uncertainty in Japan are weighing on the JPY, pushing the pair Up!

Usdjpy has been showing bullish head and shoulders buy patternsUsdjpy gave a technical bullish head and shoulders pattern, patience pays… waited for rsi to line up. And it matched fundamentals:
The US Dollar is regaining lost ground against a broadly weaker Japanese Yen on Friday. Market concerns about the political uncertainty in Japan are weighing on the JPY, pushing the pair to 187.90. From a longer perspective, however, the pair has kept trading sideways roughly between 146.00 and 149.00 since early August
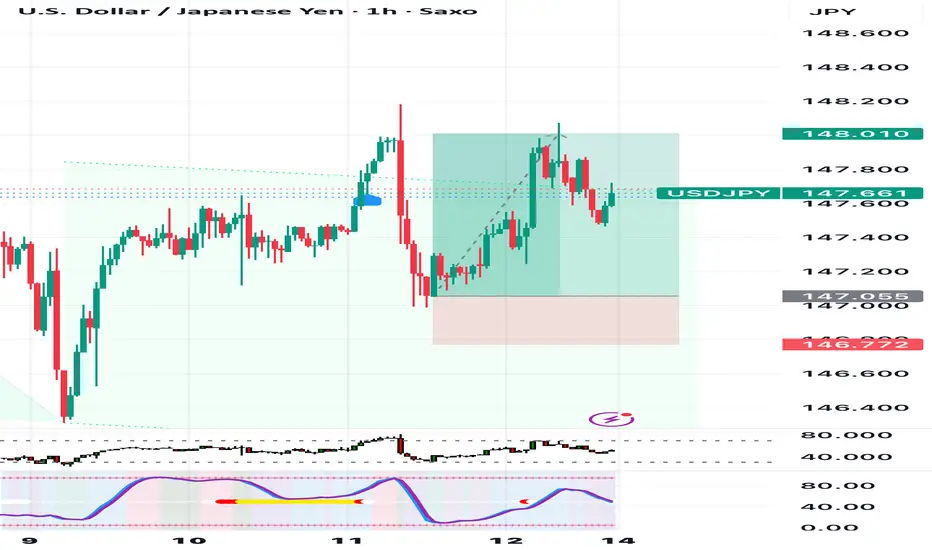
USD/JPY Range Since Mid-July Persists Post-CPIUSD/JPY is trading slightly higher on Friday after oil prices and U.S. Treasury yields moved higher. Lower yields over the course of the week hampered the U.S. Dollar, while on the Japanese Yen’s side of the equation rumors of a forthcoming rate hike from the Bank of Japan have propped up the funding currency. The U.S.-Japan 2-year yield spread fell to its lowest level since May 2022 earlier this week.
In the above chart, USD/JPY rates have spent the past two months trading sideways between 146 and 149, but for a brief trip (failed bullish breakout) outside of the range at the end of July. Momentum is flat, with daily MACD hugging its signal line and Slow Stochastics in neither overbought nor oversold territory. Similarly, the rate of change for the exponential moving average (EMA) envelope (20-, 50-, and 200-days) shows little directional bias. While a longer-term bottom may be forming in USD/JPY rates, a drop below range support at 146 would likewise see the uptrend from the April, July and September lows break, signaling the resumption of the dollar downtrend.

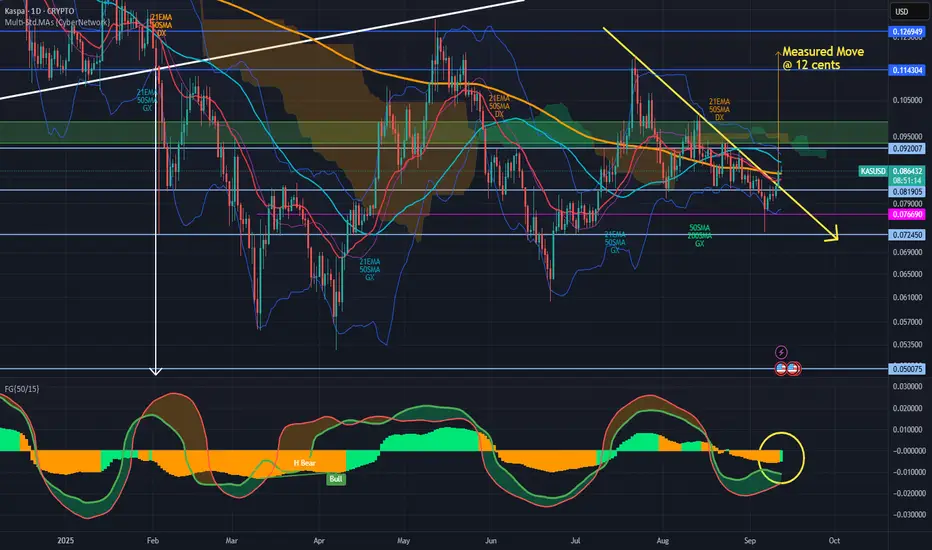
Kaspa has finally broken out with confirmation.Measured move at 12 cents.
FG histogram turned green again.
Attempting to support above the orange 200 SMA line right now.
RSI coming up from 15% on M5 + Morningstar (M5) / Engulf (M15)Price once again reacted off the EMA200 line on M15.
RSI came back up from c.15% on M5 and started printing an engulf. It was at this point that I placed my long. However the candle ended up being a dogi with the candle after it completing a Morning Star.

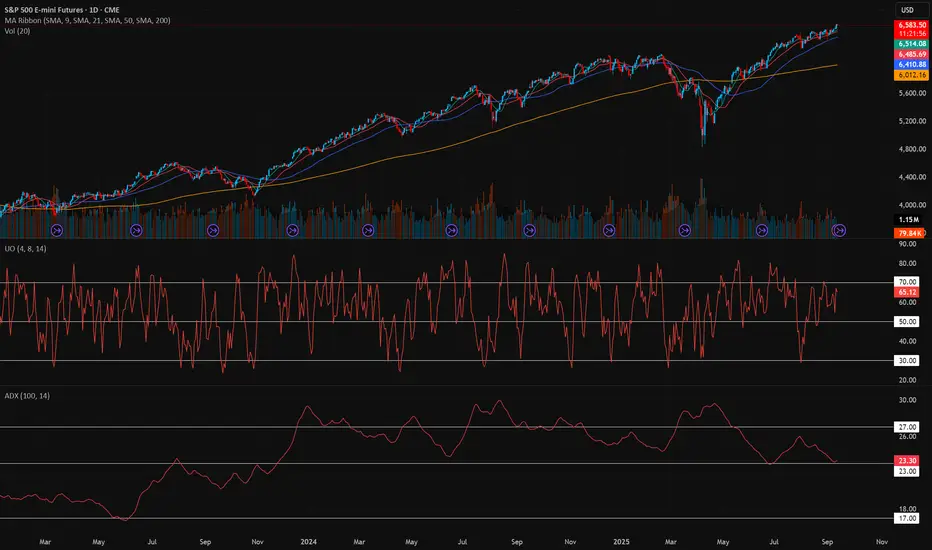
Simple UO + ADX Futures Strategy📚 Trading Plan with UO + ADX + 9/21 MA
1. Indicator Roles
Ultimate Oscillator (UO): Measures momentum across 3 different timeframes (short, medium, long). I use the lengths 4/8/14.
Overbought: > 70
Oversold: < 30
Neutral: 30–70 range
ADX (14-period, 100 smoothed): Measures trend strength, not direction.
Weak trend: < 17~20
Building trend: 20–25
Strong trend: > 27–30, enter on pullback. A bounce from the 9 or 21 MA.
2. Core Trading Logic
We combine momentum (UO) with trend strength (ADX) to avoid false signals.
Long Setup (Buy):
ADX rising above 23 → trend gaining strength.
UO crosses above 30 from below → confirms bullish momentum.
Confirm price is above 21-day MA (optional filter for trend).
📈 Exit:
UO > 50 and turning down, or
ADX below 17, or
Trailing MA.
Short Setup (Sell):
ADX rising above 27 → trend gaining strength.
UO crosses below 70 from above → confirms bearish momentum.
Confirm price is below 9-day MA (optional filter for trend).
📉 Exit:
UO < 30 and turning up, or
ADX drops below 20, or
Trailing stop.
3. Advanced Filters
Avoid false breakouts: If ADX < 20, ignore UO signals (no strong trend).
Divergence filter: If price makes a new high but UO does not → weakening trend.
Scaling:
Add to winners if ADX > 30 and still rising.
Take partial profits if ADX flattens while UO is in extreme zone.
4. Risk Management
Position sizing: Risk 1–2% of account per trade.
Stop loss: Below recent swing low (for longs) or above swing high (for shorts).
Take profit: Risk:Reward 1:2 minimum, or trail with MA.
5. Example Workflow
Case 1 (Bullish):
ADX rises from 18 → 27 (trend forming).
UO crosses 50 → bullish signal.
Enter long.
Exit when UO > 70 and rolls over, or ADX drops < 20.
Case 2 (Bearish):
ADX rises above 25.
UO crosses below 50.
Enter short.
Exit when UO < 30 and turns up, or ADX weakens.
✅ Summary Ruleset
Trade only when ADX > 23–25 (filter out noise).
Go long: UO crosses > 50 with rising ADX.
Go short: UO crosses < 50 with rising ADX.
Exit on momentum extremes (UO < 30 or > 70) or weakening ADX.
Risk: Keep losses capped at 1–2% of equity per trade.
$BTC The Correction is OVER - IH&S 50DMA Reclaim.VERY CONFIDENT THE ₿ITCOIN CORRECTION IS OVER 🤓
In other words, WE'VE SEEN THE SEPTEMBER LOWS.
Inverse Head & Shoulders reversal pattern closed outside of the Danger Zone and CRYPTOCAP:BTC reclaimed the 50DMA.

AUD/NZD: Coiling for a breakAUD/NZD tends to run hard following a bullish breakout, putting the coiling price action within an ascending triangle over recent weeks on the radar for a potential long setup in the days ahead.
A clean break above 1.1156 would allow positions to be established with a stop beneath the level for protection, targeting 1.1180 initially and 1.1250 after that. Given the proximity of the first target, price action around the level should inform whether to hold, cut, or add to the position.
Both RSI (14) and MACD are providing bullish momentum signals, although there has been a moderation in strength recently. It’s not enough to avoid the trade if we do see a break, but it reinforces the need to be patient when assessing if and when to enter.
Good luck!
DS

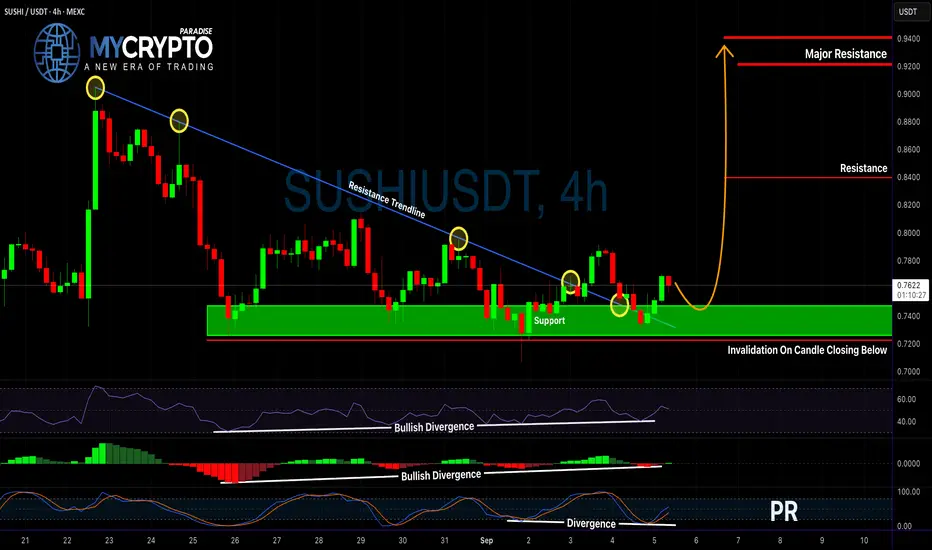
SUSHIUSDT Breakout or Bull Trap?Yello, Paradisers – could this finally be the moment SUSHIUSDT flips the script, or are we about to walk into another trap? With Bitcoin potentially preparing for a short-term pullback, traders need to be extra cautious right now. That said, SUSHIUSDT is showing promising signals that are worth your full attention.
💎After a prolonged downtrend, SUSHIUSDT has broken out of a significant resistance trendline. What makes this breakout more convincing is the confluence of bullish signals appearing across multiple technical indicators. We’re seeing bullish divergence on both the RSI and MACD, suggesting a shift in underlying momentum. On top of that, the Stochastic RSI is showing hidden bullish divergence, which typically signals the continuation of an uptrend. Together, these factors increase the probability of a meaningful bullish move.
💎From a trading strategy perspective, aggressive traders may choose to enter at the current market price. This entry offers a risk-to-reward ratio close to 1:2, which meets the basic criteria for a solid trade setup. However, conservative traders should consider waiting for a potential pullback. Given the current market conditions and the likelihood of a short-term correction in BTC, a retest of the breakout level is likely. If SUSHIUSDT retest support—and prints a clear bullish candlestick pattern, that could offer a safer entry with an even better risk-to-reward profile.
💎It’s crucial to note that this bullish scenario becomes invalid if SUSHIUSDT breaks below the support zone and closes a candle beneath it. In that case, the technical setup would be considered broken, and it would be wise to stay out of the trade until a stronger, more reliable structure develops.
Strive for consistency, not quick profits. Treat the market as a businessman, not a gambler. Only those who stay disciplined and wait for confirmed setups will come out on top in the long run. Patience and strategy will always beat emotion and FOMO. Trade smart, Paradisers.
MyCryptoParadise
iFeel the success🌴