Oil at the crossroads - buy zone or bear trap?Technically , WTI is testing the lower boundary of a converging wedge, hovering around the identified buy zone. Holding above 62–63 is critical for bulls, as a breakdown would expose targets at 61.30 and 58.80. Conversely, a rebound from current levels could trigger a move toward 70.50 and even 77.60 if momentum builds. The daily stochastic hints at a potential reversal to the upside, suggesting that a short-term bounce may be in play.
Fundamentally , the outlook remains tense: weak demand from China and global economic uncertainty are weighing on prices, while OPEC+ continues to maintain control over supply. U.S. inventory swings, with alternating builds and exports, add to volatility. Overall, the setup looks neutral with elevated risk - macro data could easily tip the balance either way.
Tactically , the market is facing a binary scenario: sustained strength above 63 opens the way to 70.50 and 77.60, while failure here brings 58.80–55.60 into focus.
In short, oil is at a crossroads and the next decisive move depends on whether bulls can hold the line.
Oscillators

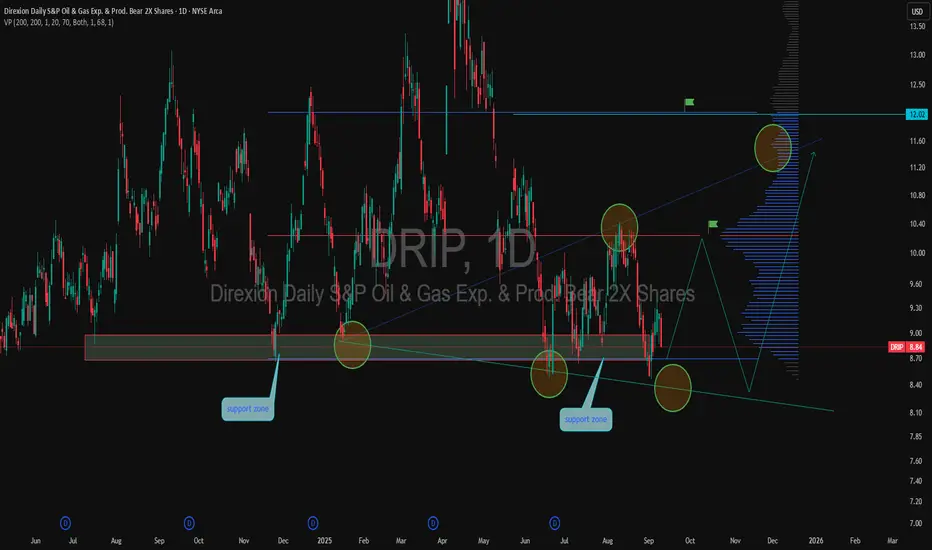
DRIP potential rebound from support zoneDRIP is consolidating near the key support area of 8.40–8.60. Over the past few months, this level has been tested multiple times, creating a strong base for a possible rebound. If local resistance around 9.50–10.00 is broken, the price may extend toward 11.20 and 12.00. However, a breakdown below support could trigger a move toward 8.00.
From a fundamental perspective, DRIP reflects the dynamics of the oil and gas sector, where pressure on producers remains high. In the current market environment, DRIP can serve as a hedge against rising oil prices.
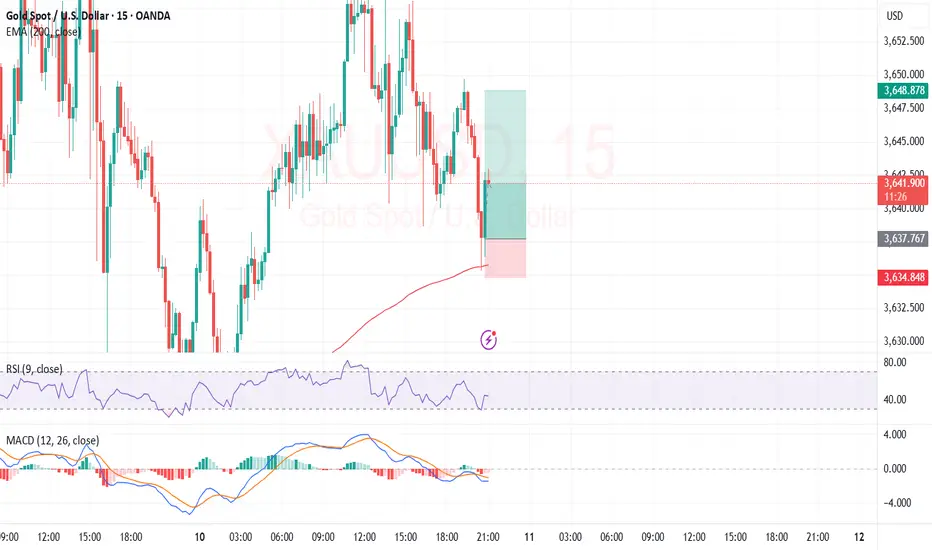
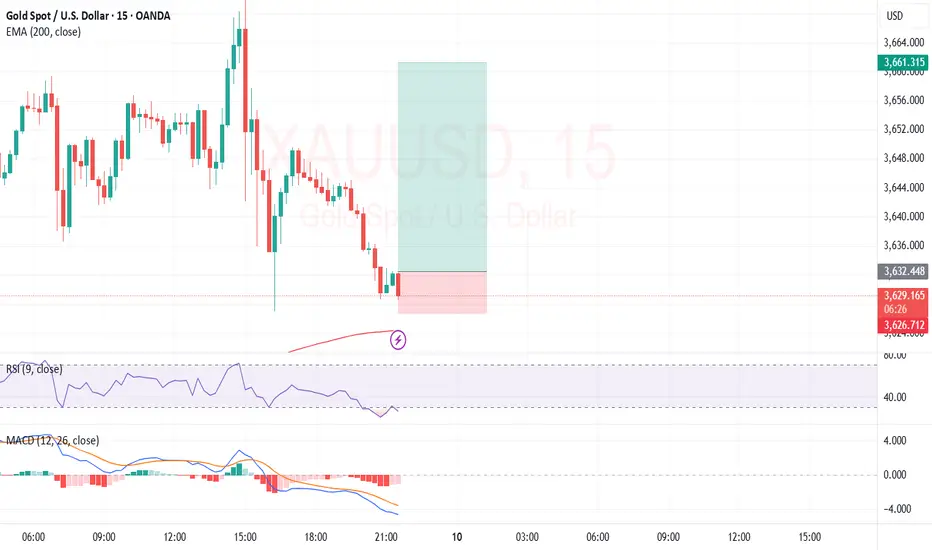
Price broke below EMA200 on M15 + Shooting Star + MACD CrossPrice below EMA200 on M15 + Shooting Star + MACD bearish cross - Tokyo.
Entered this trade a few hours ago during Tokyo session. Price finally broke through the EMA200 on M15 putting us into sell territory. A shooting star had been printed and the MACD produced a bearish cross.
As several of you noted, there’s a clean FVG stack below — I placed my TP at the end of that block.
SL was set just above the most recent structure high, giving this trade a strong R:R of nearly 1:9.
RSI is already oversold, but in strong trending conditions, it can remain that way for a while.
Looks like we’re (hopefully lol) printing the closing leg of a clean M-pattern.

China A50: Bulls eye 16,000 as triangle breaksThe China A50 contract has broken out of the ascending triangle it’s been trading in over the past month, putting traders on alert for a potential resumption of the prior bullish trend. However, having recently traded through 15000 on multiple occasions only to reverse back lower, the precondition to act upon today’s break would be to see the price close above the level.
If that plays out, longs could be established above 15000 with a stop beneath for protection. One look at the recent price action tells you that once a sustained bullish breakout occurs, the contract tends to gravitate towards big figures, suggesting 16000 may be an appropriate initial target rather than nominating a specific extension level. If achieved, traders could assess based on the price action at the time whether to square or hold looking for a push towards the October swing high of 16322 set last year.
RSI (14) has broken its downtrend and has now set a higher low above 50, pointing to building bullish momentum while not yet being overbought. The signal has been confirmed by MACD which has staged a bullish crossover in positive territory. The broader picture is one that favours longs over shorts.
If the price cannot close above 15000, there may be better setups elsewhere.
Good luck!
DS

JUPUSDT Is Screaming Reversal – Will You Be the Last Bull HoldinYello, Paradisers – are you about to walk straight into a trap? JUPUSDT is currently showing strong bearish signs right at a key resistance zone, and if you're still holding long positions, it might be time to reconsider before it’s too late.
💎We’re spotting multiple bearish divergences across major indicators: MACD, RSI, and Stochastic RSI are all signaling weakness. On top of that, JUP is moving within an ascending channel, which is typically a bearish continuation pattern. These signals combined are increasing the probability of a sharp downward move from current levels.
💎If we get a proper rejection here, the short setup could easily deliver a 1:1.5 risk-to-reward or better. For more conservative traders, waiting for a pullback with confirmation—such as a bearish candlestick formation backed by high volume—is the smarter play. This approach not only gives a clearer signal but also allows for a tighter stop-loss, improving the overall trade setup.
💎More aggressive traders could consider shorting from the current market price, but keep in mind that confirmation is always key when looking to maximize probability and manage risk effectively.
💎However, if price breaks above the invalidation level and closes a candle above that zone, the bearish outlook will be invalidated. In that case, it’s best to stay out and reassess based on new structure.
🎖Strive for consistency, not quick profits. Treat the market as a businessman, not as a gambler. The only traders who make it in the long run are those who stay patient, wait for high-probability setups, and avoid emotional decisions. Stay sharp and stay disciplined, Paradisers.
MyCryptoParadise
iFeel the success🌴

EMA200 Reject on M15 + RSI ReboundPrice was going down but reacted hard off of the EMA200. RSI was coming up from a very low c.14% on M5. 3 down liquidity spikes in a row on M5. As soon as I got into the trade momentum got behind it. Great trade so far. Also once in, MACD crossed over bullish on M5.
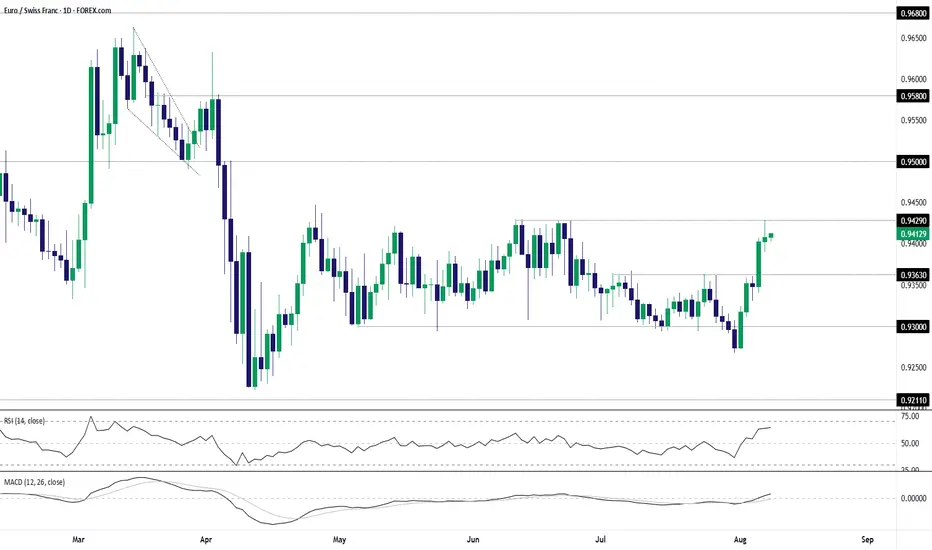
EUR/CHF Bulls Test Range Highs Following Sharp ReboundEUR/CHF sits just beneath the top of the range it’s been trading in over the past three months, providing a variety of potential setups depending on how the near-term price action evolves.
The bullish engulfing candle on the daily chart last Friday set the tone for the price action seen this week, sparking a significant bullish reversal after a false break of .9300 support. The subsequent move saw the price take out resistance at .9363 before stalling at .9429—a level that capped the pair in June.
Given recent price action, traders should be on alert for a potential extension of the bullish move.
Should we see a break and close above .9429, it would allow for longs to be established with a stop beneath for protection, targeting resistance at .9500. Offers may be encountered just beneath .9450, presenting a potential hurdle for bulls along the way.
Alternatively, if the pair cannot break .9429 meaningfully, the setup could be flipped with shorts established beneath the level with a stop above for protection. Potential targets include .9363 or .9300.
Momentum indicators have skewed bullish over the past week, with RSI (14) trending higher but not yet overbought, while MACD has crossed the signal line and now sits in positive territory. It’s not a roaring endorsement for a bullish bias, but it does favour upside rather than downside in the near term.
Positive attitudeThe listing formed a ceiling level of 7 cents,
and it is clear that the bullish flag we are currently
seeing and the RSI rebound are designed to break through this ceiling.
Beyond that lies uncharted territory.

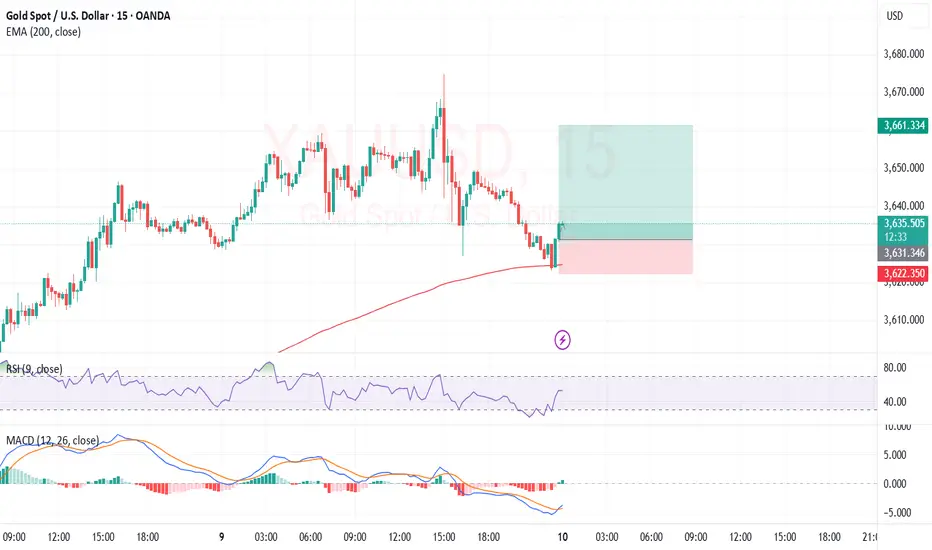
RSI retest + MACD cross + Engulfing Candle + EMA bounce = A+So errors were made tonight, I haven't entirely been following my own trading plan. Back on track with this A+ setup however.
RSI has been climbing back up, beautiful bullish engulfing candle was formed, and then MACD finally crossed back over to bullish. Also price bounced off the EMA200 on M15.
1:3. TP at edge of FVG.
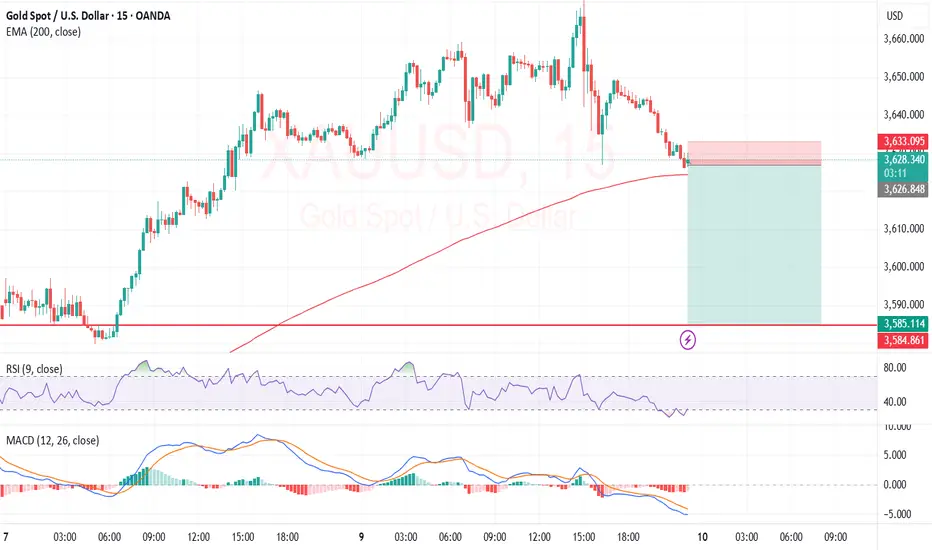
XAUUSD - RSI + MACD + FVGTook this sell. RSI has been very low for a while coupled with MACD staying bearish, lines have been widening.
Plenty of FVG below for TP.
EMA200 about to breach.
As soon as I entered the trade, candle started going green. So we shall see. Earlier analysis might have been right but I got in too early before (resulting in SL). We shall see...
NZD/USD: Shooting star warns of Kiwi reversal riskGiven its solid track record for delivering reliable topping signals recently, the reversal in NZD/USD following a false break above a known resistance level is difficult to ignore.
Whether it’s a shooting star or the second candle in an evening star pattern, both suggest the risk of further unwind in the near term for the Kiwi, creating a bearish setup ahead of key U.S. inflation data over the next two days.
Shorts could be established beneath the 50-day moving average with a stop above for protection. Ideally, the preference would be to see a retest and rejection at the 50DMA/July downtrend, with Tuesday’s reversal likely partially driven by position squaring ahead of the inflation data.
Friday’s high at .5920 presents an early hurdle. If the price is unable to push beneath it before the data, consider scrapping the trade. .5881 screens as an appropriate initial target given the repeated action around that level in recent weeks.
Momentum indicators are more neutral than outright bullish or bearish, putting more emphasis on price action rather than adopting a firm directional bias.
Good luck!
DS

RSI + Morningstar-V + EMA DefendRSI coming up from a low of c.20%, variation Morningstar candle pattern printed. With the MACD starting to turn a bit, not as much as I would like, but bearish histo bars getting smaller. Also if price is going to respect EMA 200 this is it. If not we will be looking for bears later.
News still saying - record highs etc.
Put TP at end of FVG. SL below structure.
Nice 1:5 if it goes all the way.
Not A+ setup but pretty good.
SENSEX: Intraday Levels for 10th SEP 2025 (BSE30)SENSEX Spot: Intraday Levels for 10th SEP 2025
^^^^^^^ Plot Levels Using 3 Min, 5 Min Time frame in your Chart for Better Analysis ^^^^^^^
L#1: If the candle crossed & stays above the “Buy Gen”, it is treated / considered as Bullish bias.
L#2: If the candle stays above “Sell Gen” but below “Buy Gen”, it is treated / considered as Sidewise. Aggressive Traders can take Long position near “Sell Gen” either retesting or crossed from Below & vice-versa i.e. can take Short position near “Buy Gen” either retesting or crossed downward from Above.
L#3: If the candle crossed & stays below the “Sell Gen”, it is treated / considered a Bearish bias.
L#4: Possibility / Probability of REVERSAL near RL#1 & UTgt
HZ => Hurdle Zone, Specialty of “HZ#1 & HZ#2” is Sidewise (behaviour in Nature)
Rest Plotted and Mentioned on Chart
Color code Used:
Green =. Positive bias.
Red =. Negative bias.
RED in Between Green means Trend Finder / Momentum Change
/ CYCLE Change and Vice Versa.
Notice One thing: HOW LEVELS are Working.
Use any Momentum Indicator / Oscillator or as you "USED to" to Take entry.
📢 Disclaimer
I am not a SEBI-registered financial adviser.
The information, views, and ideas shared here are purely for educational and informational purposes only. They are not intended as investment advice or a recommendation to buy, sell, or hold any financial instruments.
Please consult with your financial advisor before making any trading or investment decisions
Trading and investing in the stock market involves risk, and you should do your own research and analysis. You are solely responsible for any decisions made based on this research.

Divergence on Gold and we hoping to sell until we get another DiThe Gold has been in an uptrend for weeks now and we expect a pull back on a bigger time frame as a result of divergence on H1

ETH 1H Analysis - Key Triggers Ahead | Day 17💀 Hey , how's it going ? Come over here — Satoshi got something for you!
⏰ We’re analyzing BTC on the 1-Hour timeframe.
🔭 On the 1H timeframe for Ethereum (ETH), price rejected strongly from the 4336$ resistance and started moving lower. ETH is now trading close to its support zone at 4286$, having recently broken out of a consolidation range.
⛏ On the RSI, the key levels are 70 and 37. A move beyond these zones could trigger momentum toward either overbought or oversold conditions. Keep in mind that volatility is still closely tied to macroeconomic news.
💰 Candle structure shows increasing red candle size and volume, signaling stronger selling pressure. With ETH being heavily involved in both futures contracts and DeFi markets, much of this move reflects profit-taking and sell pressure at higher levels.
🪙 Looking at the ETHBTC pair on the 1H, the chart shows a steady downtrend within a compression zone. If ETH loses its current support, the pair could extend further down. The volatility index for this pair is sitting at 45.52, below the 50 zone, and with short positions picking up, ETH could face additional sell pressure.
💡 The current zone ETH is trading in looks like a maker-buy area, but likely to be broken by whale candles.
For short positions : The better setup would be to wait for a whale candle break, then enter on the pullback for higher win rate.
For long positions : A clean breakout above 4336$ would allow for an order stop-buy entry or a pullback + candlestick confirmation setup to get in long.
⚠️ Note: Today looks like a high-impact day with global shifts in play—trade with reduced risk.
❤️ Disclaimer : This analysis is purely based on my personal opinion and I only trade if the stated triggers are activated.

Coca-Cola Might Have Lost its PopCoca-Cola has gone nowhere for a year, and some traders may see downside risk.
The first pattern on today’s chart is the series of lower highs since April -- despite an uptrend in the broader market at the same time. Does that relative weakness indicate a lack of buying interest?
Second, the soft-drink maker ended Friday at $67.96. It was the lowest weekly close since early February. It’s also below its 200-day simple moving average. Those signals may represent a break in support.
Third, KO bounced at $69.05 on August 16 but couldn’t get back above that level early this month. That could suggest that old support has become new resistance.
Fourth, prices are under the declining 50-day simple moving average. MACD is also falling and the 8-day exponential moving average (EMA) is below the 21-day EMA. Those patterns may reflect bearish trends in the intermediate and short terms.
TradeStation has, for decades, advanced the trading industry, providing access to stocks, options and futures. If you're born to trade, we could be for you. See our Overview for more.
Past performance, whether actual or indicated by historical tests of strategies, is no guarantee of future performance or success. There is a possibility that you may sustain a loss equal to or greater than your entire investment regardless of which asset class you trade (equities, options or futures); therefore, you should not invest or risk money that you cannot afford to lose. Online trading is not suitable for all investors. View the document titled Characteristics and Risks of Standardized Options at www.TradeStation.com . Before trading any asset class, customers must read the relevant risk disclosure statements on www.TradeStation.com . System access and trade placement and execution may be delayed or fail due to market volatility and volume, quote delays, system and software errors, Internet traffic, outages and other factors.
Securities and futures trading is offered to self-directed customers by TradeStation Securities, Inc., a broker-dealer registered with the Securities and Exchange Commission and a futures commission merchant licensed with the Commodity Futures Trading Commission). TradeStation Securities is a member of the Financial Industry Regulatory Authority, the National Futures Association, and a number of exchanges.
TradeStation Securities, Inc. and TradeStation Technologies, Inc. are each wholly owned subsidiaries of TradeStation Group, Inc., both operating, and providing products and services, under the TradeStation brand and trademark. When applying for, or purchasing, accounts, subscriptions, products and services, it is important that you know which company you will be dealing with. Visit www.TradeStation.com for further important information explaining what this means.

7/3/25 - NOAH: new SELL mechanical trading signal.7/3/25 - NOAH: new SELL signal chosen by a rules based, mechanical trading system.
NOAH - SELL SHORT
Stop Loss @ 12.59
Entry SELL SHORT @ 11.25
Target Profit @ 9.13
Analysis:
Higher timeframe: Prices have stayed below the upper channel line of the ATR (Average True Range) Keltner Channel and reversed.
Higher timeframe: Victor Sperandeo's (Trader Vic) classic 1-2-3/2B SELL pattern...where the current highest top breakout price is less or only slightly peaking higher than the preceding top price.

8/1/25 - AMZN: new SELL mechanical trading signal.8/1/25 - AMZN: new SELL signal chosen by a rules based, mechanical trading system.
AMZN - SELL SHORT
Stop Loss @ 234.11
Entry SELL SHORT @ 214.75
Target Profit @ 181.53
Analysis:
Higher timeframe: Prices have stayed below the upper channel line of the ATR (Average True Range) Keltner Channel and reversed.
Higher timeframe: Victor Sperandeo's (Trader Vic) classic 1-2-3/2B SELL pattern...where the current highest top breakout price is less or only slightly peaking higher than the preceding top price.

BTC 1H Analysis - Key Triggers Ahead | Day 37💀 Hey , how's it going ? Come over here — Satoshi got something for you!
⏰ We’re analyzing BTC on the 1-Hour timeframe.
👀 On the 1H timeframe for Bitcoin, we can see that after breaking the 111,330$ resistance, BTC managed to push higher and is now approaching its next key resistance at 113,000$. This level overlaps with the multi-timeframe range high, making it a critical zone. A clean breakout above this area could drive BTC toward higher price targets.
⚙️ On the RSI, the key zones are around 70 and 50. If momentum pushes past these levels—especially with positive news flow—BTC could enter an overbought phase, fueling further upside.
🕯 Candle structure is showing strength: green candles are getting larger with more volume. At the range high, we’ve seen some red candles forming, reflecting seller absorption. However, each test shows weaker selling pressure compared to the last time BTC hit this level—back then, price dumped sharply within just 2 red candles.
📊 Looking at Tether Dominance (USDT.D) on the 1H, after reacting to 4.45%, it broke lower toward 4.39% and even closed below that level. Right now, it’s retesting 4.39%. If this new support fails, dominance could extend lower toward the next support. A breakdown below 4.37% would be strong confirmation for BTC breaking its range high.
🔔 Trading plan : Bitcoin is currently sitting just below the 113,000$ resistance. Don’t rush into a position here. Ideally, wait for : Another test of this resistance. A confirmed breakout with a pullback/retest of 113,000$. Enter long after the retest for a safer entry.
❤️ Disclaimer : This analysis is purely based on my personal opinion and I only trade if the stated triggers are activated .

I twist the adjustment ring of my lens.Here's another idea from the “communicating vessels” list.
Since the OTHERS/BTC chart does not show impressive
results of inverse correlation now, we need to find a way
to detect altcoin movement when it is separated from liquidity devourers. OTHERS/BTC+OTHERS/ETH is one such way.

BDP. Accumulation zone.BDP price is 70% higher than the previous historical low and probably by Oct '25 the price may touch $0.02 level and this is a great accumulation zone if that happens - RSI oversold here as an excellent indicator in addition to the main patterns.

BTCUSD - Final Move Up (RSI) This is the Monthly Chart for BTCUSD
The RSI shows itself moving into the overbought area on this timeframe, meaning it is a good time to sell BTC.
However I do think there will be one more move up for BTC to hit this upper trend line in red along the RSI.
Again, Monthly chart.

RSI recently <35% + MACD CrossRSI coming up out of recent RSI lows plus bullish MACD crossover for confirmation.
Took a 1:4 going into blue sky territory. How far will she go today? Happy trading people.
