Campbell's may be bottoming, reinvest those dividends!After a lengthy drawdown, NASDAQ:CPB may finally be grinding out a bottom. A small falling wedge, which tends to be a reversal pattern, appears to be forming.
Analysts are dour on consumer staples companies, but few have the moat Campbell's does. The conventional wisdom in markets now is, the AI bubble has more room to inflate, so you may as well hold onto those positions and be one of the first out at the exit...
Why not start building a position in some of these high quality left-for-dead value stocks and start averaging in with the dividends? In the case of NASDAQ:CPB the yield is now better than the yield you'll get on cash.
Oscillators

Visa May Be CrumblingVisa has been rangebound for months, but some traders may think it’s starting to head lower.
The first pattern on today’s chart is the consolidation period between late July and mid-November. At the beginning of the period, V’s 50-day simple moving average (SMA) was above its 100-day SMA. Both were above the 200-day SMA.
Things were just the opposite at the end, with the faster SMAs below the slower ones. That included a “death cross” of the 50-day SMA under the 200-day SMA, which may suggest the longer-term trend is getting bearish.
Second, the Wall Street Journal reported on June 13 that large retailers were exploring the use of stablecoins. V gapped lower on that news and has remained below it since.
Third, MACD is falling and the 8-day exponential moving average (EMA) is below the 21-day EMA. Those patterns may be consistent with a bearish short-term trend.
Next, V is trying to hold the August 7 low of $328.70. Traders may watch a potential break of that support line as a signal for steeper downside.
TradeStation has, for decades, advanced the trading industry, providing access to stocks, options and futures. If you're born to trade, we could be for you. See our Overview for more.
Past performance, whether actual or indicated by historical tests of strategies, is no guarantee of future performance or success. There is a possibility that you may sustain a loss equal to or greater than your entire investment regardless of which asset class you trade (equities, options or futures); therefore, you should not invest or risk money that you cannot afford to lose. Online trading is not suitable for all investors. View the document titled Characteristics and Risks of Standardized Options at www.TradeStation.com . Before trading any asset class, customers must read the relevant risk disclosure statements on www.TradeStation.com . System access and trade placement and execution may be delayed or fail due to market volatility and volume, quote delays, system and software errors, Internet traffic, outages and other factors.
Securities and futures trading is offered to self-directed customers by TradeStation Securities, Inc., a broker-dealer registered with the Securities and Exchange Commission and a futures commission merchant licensed with the Commodity Futures Trading Commission). TradeStation Securities is a member of the Financial Industry Regulatory Authority, the National Futures Association, and a number of exchanges.
TradeStation Securities, Inc. and TradeStation Technologies, Inc. are each wholly owned subsidiaries of TradeStation Group, Inc., both operating, and providing products and services, under the TradeStation brand and trademark. When applying for, or purchasing, accounts, subscriptions, products and services, it is important that you know which company you will be dealing with. Visit www.TradeStation.com for further important information explaining what this means.

HydroGraph Clean Power (CSE: HG) - Swing TradeHydroGraph Clean Power (CSE: HG) continues to act like a classic momentum micro-cap: fast expansions, hard pullbacks, and very technical-driven flows. The long-term trend is still intact, but the latest dip into trendline support gives a fresh asymmetric setup — especially with RSI(2) at 3.27, which is deep-oversold territory.
🏢 Quick Company Snapshot
HG is a graphene/hydrogen tech play with no meaningful revenue yet, but a ton of speculative attention. The stock went parabolic this year and continues to behave like a momentum vehicle rather than a fundamentally anchored name. That’s fine — as long as you trade it like one.
📈 Price Action & Catalysts
Momentum remains bullish overall. HG has respected the rising trendline for months, bouncing cleanly each time it tagged the 50-day SMA or short-term support.
Catalysts remain mostly sentiment-driven:
• Graphene/clean-tech hype rotation
• Patent/technology announcements
• Low float + momentum traders piling in
• No negative news — pullback is technical, not fundamental
Risks:
• Dilution (common for micro-caps)
• Liquidity disappears fast on red days
• Parabolic charts unwind violently if support cracks
🪙 Industry Context
Micro-cap clean tech is still getting bid, but the sector is volatile. HG drastically outperformed peers over the last 6–12 months — meaning pullbacks can get sharp and exaggerated.
📐 Technical Breakdown (Chart-Specific)
Your chart shows:
Trend:
Still up. Price is above the 200-SMA and sitting directly on the rising trendline + 50-SMA area.
Support Zones:
• Primary: 3.00 – 3.10
• Trendline: ~3.20
• Deeper: 2.70 (50-day SMA)
• Major floor: 1.41
Resistance Zones:
• 3.73 (local resistance)
• 4.50+ (measured-move target + previous wick zone)
RSI(2):
3.27 — ultra-oversold. Historically on this ticker, RSI2 < 5 has often marked swing lows or immediate bounces.
Volume:
Still healthy. No signs of heavy distribution — selling is orderly.
Pattern:
A clean ascending channel + pullback to trendline. This is textbook Minervini VCP-style behaviour (volatility starting to tighten after spikes).
🎯 Trade Plan (TradingView Style)
Entry Zone:
3.15 – 3.35 (trendline retest + ultra-oversold RSI2)
Stop:
2.88 (below trendline + below recent swing low)
Target:
4.50 (previous resistance + projected swing extension)
R/R:
≈ 2.5–3.0R depending on entry
Alternate Setup:
If price fails the trendline and flushes to 2.70 (SMA50), that becomes the new A+ bounce zone — but only if volume stays controlled.
🧠 My Take
This is one of the cleaner micro-cap momentum pullbacks I’ve seen in weeks. Trend is intact, RSI(2) is screaming oversold, and price is resting directly on a long-respected trendline. The setup is simple: if buyers defend this zone, the bounce to 3.70–4.50 is very realistic. If 3.00 breaks with volume, step aside and wait for 2.70.
This is pure technical trading — not investing — but the structure is absolutely there.

BTC on Higher Timeframe Trend Line Support - Bullish DivergenceBTC had experienced a significant sell-off in recent days. However, the price is currently finding support and is trading alongside a high-timeframe support trend line.
On the 4-hour timeframe, price has formed bullish divergence on RSI.
The higher timeframe trend line support combined with bullish divergence on the 4-hour chart could indicate potential upside for the instrument.
If price breaks the lower high on ht timeframe, we can expect higher prices for BTC!

$BTC Halfway to Confirming Bear Market - BUT There's HOPE!BAD NEWS ⚠️
₿ITCOIN IS HALFWAY THERE TO CONFIRMING A NEW BEAR MARKET.
🚨 This is the first-time that CRYPTOCAP:BTC has closed below the 50WMA since Dec ’21. We all know what happened after that.
🚨 If we get another consecutive Weekly close below the 50WMA, I am confident this is the beginning of the end for the bull market.
If that happens, I will discuss my new exit strategy and POI in another post.
GOOD NEWS 🙌
⚡️ The long-awaited DEATH CROSS on the Daily Chart has occurred, which historically marks the bottom.
⚡️ PA is sitting at VERY strong support on the .618 Fib
⚡️ RSI is LOWER than the Liberation Day madness Feb - April ’25, and the lowest it’s been since July ’22.
NOTE: This is the smallest correction we’ve had all bull market.
TL;DR 📖
✅ This is the absolute best time to buy CRYPTOCAP:BTC
✅ Just make sure to follow the 50WMA invalidation if you do take a position.
Remember, we have the most insanely bullish macro / regulatory backdrop in crypto’s entire existence.
MY THOUGHTS 🤓
🐂 I truly believe this is the biggest fake-out we’ve ever seen. There’s way too many tailwinds on the horizon to let this go to waste.
🐂 Bulls need a $10k Mega-Candle THIS WEEK to reclaim momentum.
🐂 I’m still a MEGA-BULL until my thesis is invalidated.
⛔️ We could get one last flush ~$92k to grab CME Gap liquidity.
🛑 DO NOT USE LEVERAGE EVER AGAIN!!!

Break or Fade? 8627 Is the BattlegroundOur Australia 200 contract is testing a key level on the charts, providing a decent area to build trade setups around.
8627 is the focal point, coinciding with the Valentine’s Day swing high from February this year. Since then, it has acted as resistance and support on multiple occasions, so it’s no surprise the price now finds itself interacting with the level.
Right now, it’s sitting beneath 8627 after failing to sustain a probe above earlier today. That mirrors what we saw late last week, suggesting bears are selling into strength and have the ascendency. RSI (14) and MACD back this up, both sitting in bearish territory and favouring short setups over long.
If the price remains capped beneath 8627, shorts could be set at or below the level with a tight stop above for protection, targeting either 8565, 8500, or the 200DMA depending on desired risk-reward.
Alternatively, if we see a break and close above 8627, the setup could be flipped with longs placed above with a stop below, targeting 8726 initially given it previously acted as support. As mentioned above, given recent price and momentum signals, this setup goes against the prevailing grain, emphasising the need to see any bullish reversal stick before considering long trades.
Good luck!
DS

ALTS dominance is damn bullish I am bullish on altcoins because, technically, the Others Dominance chart is forming a double bottom on the weekly timeframe. Moreover, the RSI is showing bullish divergence, and there is strong monthly support. Higher timeframes usually work more reliably, which adds to the bullish outlook.

PEGA - New 52-Week High, Next Stop All-Time High?PEGA - CURRENT PRICE : 66.27
PEGA has shown strong bullish momentum after breaking above its 52-week high resistance at USD 61.00. The breakout was followed by a successful retest, confirming strong buying interest and trend continuation.
RSI (45) remains steady above the 50 level, indicating a healthy and sustained uptrend with no signs of overbought pressure yet. Take note also that there is a rising support line - indicating demand is getting higher. If momentum continues, the stock has potential to retest its all-time high at around USD 74.40, representing strong upside potential. The stock’s immediate support lies at USD 57.66, aligning with the gap zone (rising window) formed earlier, which is expected to serve as a strong support area.
ENTRY PRICE : 64.00 - 67.00
FIRST TARGET : 74.30 (slightly below actual all time high resistance)
SECOND TARGET : 80.00
SUPPORT : 57.66

$BTC crash. Where is the bottom?Bitcoin is crashing — and while it looks scary, it’s also one of those rare long-entry opportunities you’ll regret missing once the rebound kicks in.
Why is Bitcoin dumping?
1️⃣ A major hedge fund manager shut down his Bitcoin fund.
Historically, this kind of event often precedes bubble corrections, creating panic in the market.
2️⃣ The FED won’t publish inflation or unemployment numbers due to the government shutdown.
With no data, Powell can’t justify a rate cut.
The market is now pricing a “no-cut scenario,” which puts downward pressure on all risk assets — including crypto.
3️⃣ Structural consolidation.
I already posted about this:
- bullish short-term,
- bearish long-term
This is exactly what’s happening.
The macro downtrend should end around Q2 2026, meaning we’ll likely grind down or range until then.
Is this a bear market?
Not really.
Bitcoin probably won’t see an -80% crash ever again.
But a -30% correction? Absolutely possible.
What does the chart say?
The current correction has a support zone at $94–95k.
If that breaks, the next zone is $88k — less likely but still possible.
Between now and Q2 2026, we’ll get several relief bounces.
If you go long without leverage on strong support zones, you can ride these bounces safely.
Where is the opportunity?
Buy the fear, sell the greed — classic strategy.
Altcoins will bounce even harder than BTC:
CRYPTOCAP:PEPE , NYSE:FUN , DeFi coins, memecoins — these always react with double-digit rebounds.
The key idea
👉 The best entries happen when everyone is panic-selling.
👉 The best exits happen when everyone is euphoric.
Stay smart, stay patient.
DYOR.
#Bitcoin #CryptoCrash #BTC #Altcoins #CryptoTrading #CryptoAnalysis #CryptoMarket #CryptoInvesting #BTCPrice #BuyTheDip #MarketUpdate #TradingStrategy #TechnicalAnalysis #Macro #RiskManagement #HODL #CryptoNews

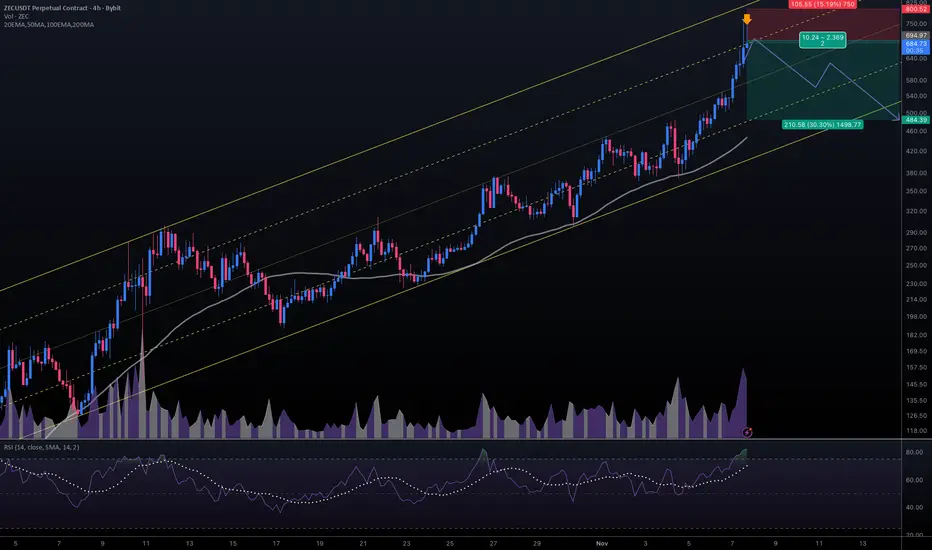
#ZECUSDT #4h (ByBit) Ascending channel on resistance [SHORT]Zcash just printed a shooting star and entered overbought territory again.
It seems likely to finally retrace down towards 50MA support, short-term.
⚡️⚡️ #ZEC/USDT ⚡️⚡️
Exchanges: ByBit USDT
Signal Type: Regular (Short)
Leverage: Isolated (3.0X)
Amount: 4.4%
Current Price:
684.73
Entry Targets:
1) 694.97
Take-Profit Targets:
1) 484.39
Stop Targets:
1) 800.52
Published By: @Zblaba
CRYPTOCAP:ZEC BYBIT:ZECUSDT.P #4h #Privacy #ZK z.cash
Risk/Reward= 1:2.0
Expected Profit= +90.9%
Possible Loss= -45.6%
Estimated Gaintime= 1 week
GBP/USD Fails at 1.3200 for Second DayGBP/USD is trading lower on Friday after the U.K. government abandoned its planned income tax increases, a move that immediately raised concerns about how the Treasury will plug the emerging budget gap. Scrapping the tax increases leaves an estimated £20-30 billion shortfall that will need to be addressed in the Autumn Statement. Markets are already pricing wider risk premia around U.K. assets, with U.K. gilt yields rising across the curve to Sterling’s detriment.
In the above chart, GBP/USD rates have once again failed to break above 1.3200, where both the May and July monthly lows were carved out. The pair is likewise struggling to sustain price action above its 20-day exponential moving average (EMA). Concurrently, each of the 20-, 50-, and 100-day EMAs have a negative rate of change, signifying sustained bearish momentum. Daily MACD remains below its signal line, while Slow Stochastics are dropping through their median line. Bears are in control as long as GBP/USD fails to sustain a daily close north of 1.3200.

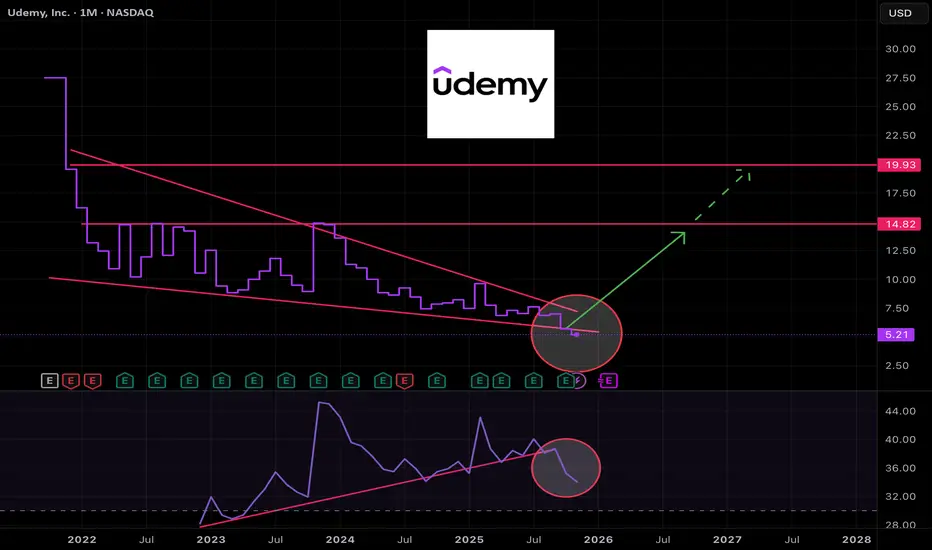
UDMY turning profitable and in deep value territoryNASDAQ:UDMY stock has been left for dead. It's formed a massive falling wedge on the monthly chart and until late has done so with improving momentum.
While not strictly aligned to disciplined charting techniques I view the recent meltdown in momentum as capitulation and a good time to start a small position.
Looking at the annual and quarterly profit figures we can see the company has been bleeding cash for years, but in recent quarters is starting to make a small profit.
It's a speculative buy, so keep the position sizing small, but I think there's room to double or even triple with sufficient time.
BTC SHORT FORECAST 96K TargetIm expecting some coling in price to a 96k discount per coin guarantee you this guy going to rebound from one of the targets but 96k is my best bet
im the master of forecasting the coin remebr that
like comment follow
$DOT / Polkadot - Life SupportWith price coming out of the accumulation range in a downtrend and collapsed under weekly mitigated support/demand.
Price is now retesting this weekly level in a textbook 'break & retest'.
Bulls need to reclaim this area for a chance, other than that it could be curtains.

$BTC VERY Close to Forming a BOTTOMReceiving the end of cycle calls / texts from normie friends - one of my best indicators.
Bullish Divergence on the Daily.
Need some closes above the EMA9 ~$103k to confirm.
Then $107,5 next up.

Bitcoin - Why everyone is probably wrongYou may have noticed published ideas on tradingview.com are now calling for price action to take one direction and that direction is down. Don’t take my word for it, click on BTCUSD pair to the bottom right of this screen and then ‘ideas’ then ‘Recent’. A significant number of analysts are “short” at this time.
The number of short ideas should not be surprising, there is tens of millions of dollars in short interest around the 74-75k area waiting to be liquidated.
Two falling wedge patterns are shown on the above 1-day chart. All too easily these patterns produce false breakouts. How do you verify? Verification is made in a similar way to the recently published “How to void or validate a head and shoulders pattern” (idea linked below). We achieve validation by observing the movements of the oscillators.
1) A cross up of 20 indicates momentum is returning to the market. Look left.
2) Momentum oscillators cycle from above 80 to below 20 the majority of the time between 20 to 30 days. Look left and confirm, don’t take my word for it! At this time 26 days have passed since Stochastic RSI was above 80.
3) Considering points (1) and (2) the falling wedge now has a high probability of confirming the continued uptrend.
4) The wedge target area may be forecast by measuring the flagpole height (black circles). You can observe how accurate the first wedge target was forecast using this process. The forecast for the 2nd wedge is shown, towards the 115k area.
5) The 115k target area was first forecast from the “Is Bitcoin about to rally to 110-120k” idea (linked below) in July 2022 as price action was around $18k using the same method described above.
6) When the target is reached the bull market is over. There will be calls from all quarters informing us how price action is now going to $250k and beyond. Ignore it. The next macro long opportunity will be in 2026.
Is it possible price action continues correcting from the new all time high? Sure.
Is it probable? No
Ww
How to void or validate a head and shoulders pattern
Is Bitcoin about to rally to 110-120k

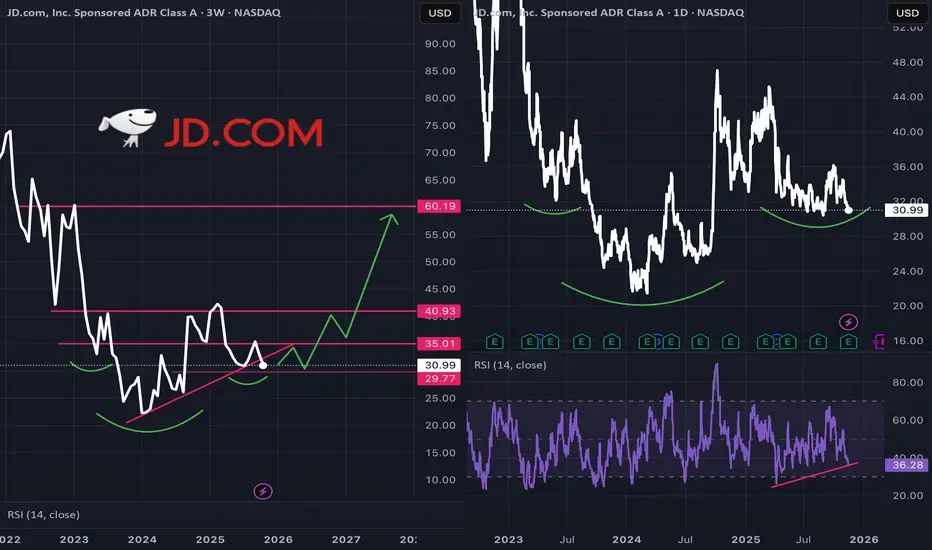
JD.com large cap value worth buying nowJD.com just beat earnings showing an ability to adapt to the current environment in China.
Simultaneously we see calls for Chinese policy makers to continue stimulating the consumer to ward off a very dangerous deflationary death spiral.
I'm reaching a bit here, but it we may be setting up a large inverted head & shoulders pattern on the charts.
JD.com
* is profitable
* pays a dividend
* has lots of cash
* proved it can adapt to tough environment
* beaten earnings forecasts as far as the eye can see
* tremendously depressed share price
Bullish here -- one of my top two holdings.
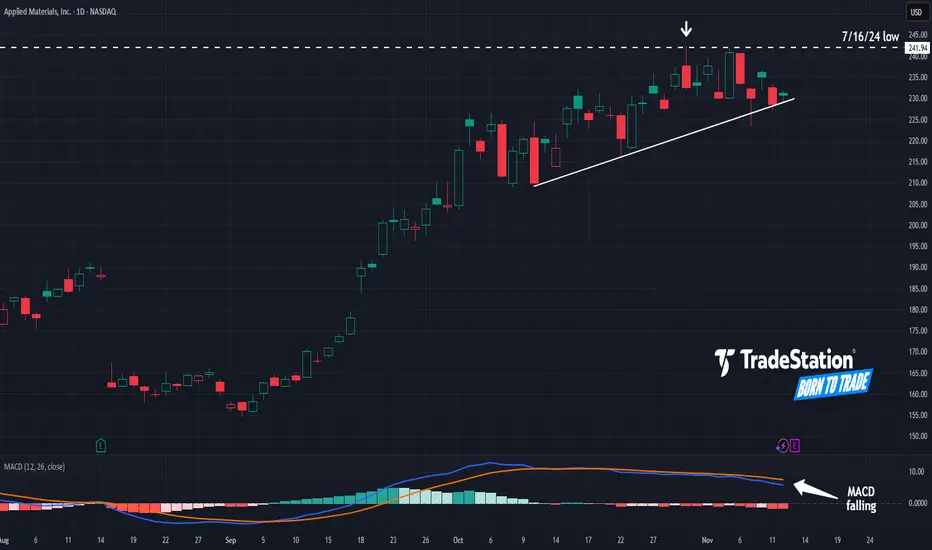
Applied Materials May Be TeeteringApplied Materials has rallied along with other tech stocks, but some traders may think the chip-equipment name is teetering.
The first pattern on today’s chart is the $241.94 level. It was a low in July 2024, immediately after the Biden Administration restricted exports to China. AMAT peaked at the same price last month, which may suggest old support has become new resistance.
Second, MACD has declined for several weeks. That may reflect slowing momentum.
Third, you have the series of higher lows since October 10. AMAT has tested that trendline recently. Could a breakdown trigger selling?
TradeStation has, for decades, advanced the trading industry, providing access to stocks, options and futures. If you're born to trade, we could be for you. See our Overview for more.
Past performance, whether actual or indicated by historical tests of strategies, is no guarantee of future performance or success. There is a possibility that you may sustain a loss equal to or greater than your entire investment regardless of which asset class you trade (equities, options or futures); therefore, you should not invest or risk money that you cannot afford to lose. Online trading is not suitable for all investors. View the document titled Characteristics and Risks of Standardized Options at www.TradeStation.com . Before trading any asset class, customers must read the relevant risk disclosure statements on www.TradeStation.com . System access and trade placement and execution may be delayed or fail due to market volatility and volume, quote delays, system and software errors, Internet traffic, outages and other factors.
Securities and futures trading is offered to self-directed customers by TradeStation Securities, Inc., a broker-dealer registered with the Securities and Exchange Commission and a futures commission merchant licensed with the Commodity Futures Trading Commission). TradeStation Securities is a member of the Financial Industry Regulatory Authority, the National Futures Association, and a number of exchanges.
TradeStation Securities, Inc. and TradeStation Technologies, Inc. are each wholly owned subsidiaries of TradeStation Group, Inc., both operating, and providing products and services, under the TradeStation brand and trademark. When applying for, or purchasing, accounts, subscriptions, products and services, it is important that you know which company you will be dealing with. Visit www.TradeStation.com for further important information explaining what this means.
Aecon Group Inc. (TSX: ARE) — Swing Trade💰 Aecon Group Inc. (TSX: ARE) — Swing Trade Breakdown
Chart Date: Nov 13, 2025
RSI(2): 3.11 (deep oversold signal)
🏢 Company Snapshot
Aecon Group is one of Canada’s leading infrastructure and construction companies — active in transportation, utilities, and industrial projects. The stock has been trending higher since mid-2024, supported by strong backlog growth and resilient margins in public and energy projects.
📈 Fundamentals
Valuation remains moderate with a P/E around 9×, a healthy 3.4% dividend yield, and a manageable debt-to-equity ratio near 0.6. Free cash flow and liquidity are solid, positioning Aecon to capitalize on new government-funded infrastructure spending. Fundamentally sound and cash-generative — ideal for steady accumulation during pullbacks.
🔍 Technical Setup
ARE recently pulled back from its October peak near CAD $35 to test the 50-day moving average around $27–28, printing a strong RSI(2) oversold reading at 3.11 — historically a high-probability bounce zone on this ticker.
Price remains above the 200-SMA (~$21), confirming a sustained uptrend. Volume has stabilized after the post-earnings surge, showing orderly profit-taking rather than panic.
The pattern resembles a textbook pullback within an ongoing uptrend, where previous “BUY” signals at the 50-SMA have consistently led to multi-week rallies.
🎯 Trade Plan
Entry Zone: $27.00 – $27.50, near 50-SMA and RSI(2) signal confirmation.
Stop Loss: $25.80, below the 50-SMA and recent swing low.
Target: $31.50 – $33.00, near prior resistance and measured-move projection.
Risk/Reward: ~2.5× potential return to risk.
Aggressive traders may scale in at current levels; conservative traders can wait for a bullish reversal candle or reclaim of $28.00 with uptick in volume.
🧠 Swing Trader’s View
Aecon is in a bullish intermediate trend with short-term oversold momentum. RSI(2) at 3.11 is one of the lowest readings of 2025 — typically preceding a relief rally. As long as price holds above $26.00, the 50-SMA should act as dynamic support.
This setup aligns with prior buy triggers seen earlier in the trend (August and September), both leading to strong continuation swings.
💡 Outlook (Next 1–3 Weeks)
Expecting a technical rebound toward $31+ if the 50-SMA holds.
Favouring a buy-the-dip swing targeting mid-November strength — confirmation comes with an RSI(2) cross back above 10 and volume expansion off the 50-day line.

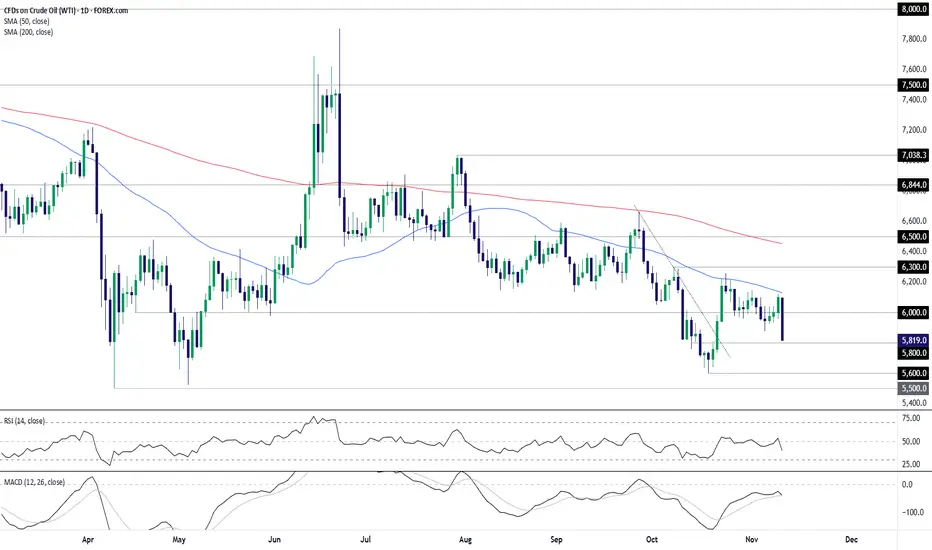
Bearish bar signals risk of deeper crude slideUnable to climb above the 50-day moving average and having just delivered an almighty bearish bar, is WTI crude about to revisit the October lows—an outcome that could put a retest of the YTD lows on the cards? With momentum indicators like RSI (14) and MACD swinging sharply lower, signaling building downside strength, the risk of such a move is growing.
$58.00 is a minor level to watch near term, having acted as support and resistance at times last month. Should price trade beneath this level, shorts could be established on the break with a stop above for protection, targeting a run toward the October swing low of $56.00. The preference would be to see a back-test and rejection of the level before entry.
While short setups are favored given recent price and momentum signals, should WTI manage to hold above $58.00 during Thursday’s session, the option would be there to flip the setup, allowing for longs with a stop beneath for protection. $60.00 screens as an appropriate initial target, even with the messy price action around it recently.
Plenty of fundamental catalysts were bandied around to explain Wednesday’s abrupt drop, most linked to an EIA report warning of market oversupply. It undoubtedly contributed to the bearish move, but the seeds were sown well before the event given how poorly WTI traded at the 50DMA in recent weeks.
Good luck!
DS
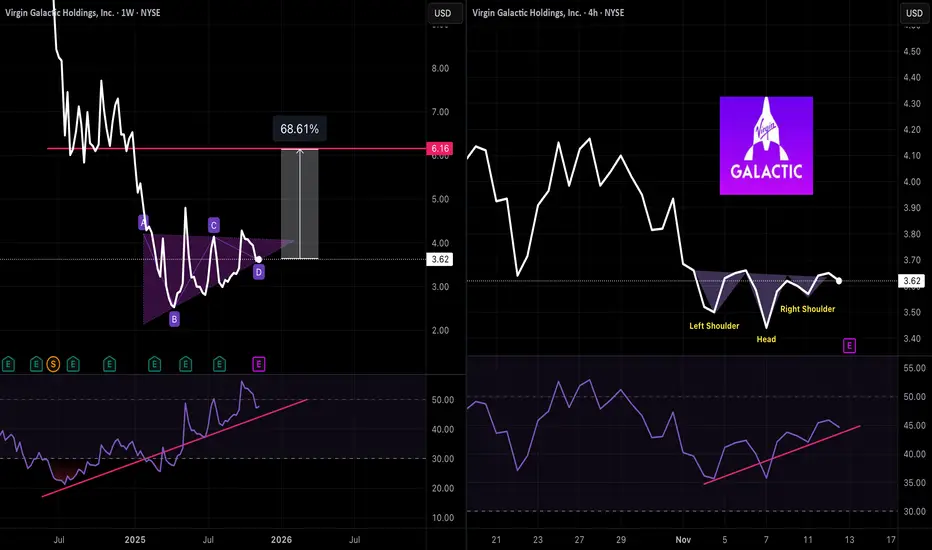
Is Virgin Galactic ready for liftoff?Virgin Galactic NYSE:SPCE has been building an ascending triangle on the weekly chart with a huge gap to fill if it can break to the upside.
Zooming in on a short term 4H chart we see an inverted head & shoulders with improving momentum.
Could one more earnings beat be the catalyst to start the engines and send this spaceship back up to the mesosphere?!
USD/JPY attempts breakout above 154.50A bullish breakout in USD/JPY may be on the cards.
The pair is trading marginally above 154.50, a level that has repeatedly capped gains in recent weeks. With momentum indicators showing growing upside pressure, this attempt may succeed where others have failed.
If USD/JPY holds above 154.50 into the European session, longs could be considered above the level with a stop below for protection, targeting a move towards 156.50, an area that saw plenty of action around the turn of the year.
Good luck!
DS

Dow Jones: Pressure Builds for a Topside BreakCoiling within an ascending triangle just beneath record highs, Dow Jones Industrial Average traders should be on alert for a potential bullish breakout.
The slingshot price action of recent days has delivered an obvious bullish message, with the three-candle morning star pattern completed on Monday proving prescient in signalling what was to come. Now trading just below 48,000—a level it’s struggled to overcome over the past month—we’re approaching what could be a key moment for medium-term directional risks. With the ascending triangle spanning thousands of points, a clean topside break could trigger significant upside.
With RSI (14) sitting above 50 but not yet overbought, upside pressure is strengthening. MACD is confirming, having staged a bullish crossover in positive territory earlier this week. The ducks are lining up for a potential bullish breakout.
Should we see a clean break above 48,000, longs could be established above the former highs with a stop beneath for protection. Unless we see a close above that level, the preference would be to wait for a pullback, test and bounce from the former highs using a shorter timeframe before entry.
While convention suggests a breakout from the triangle could eventually see the price trade north of 50,000, implying that could be a target, others may prefer to take their cues to exit from price action should an obvious topping signal or pattern emerge.
Even though a topside break is favoured, if the bullish move continues to stall around 48,000, there’s scope to flip the setup, allowing for shorts to be placed beneath the level with a stop above the highs, targeting 47,400 or the October uptrend. This screens as a lower-probability play given recent price and momentum signals despite previous success for shorts around these levels.
Good luck,
DS
