bitcoin expands to 751kgood morning,
a small retracement over the last few days has sent 95% of the market into total panic mode.
these are the times to be buying, when others are terrified beyond belief, running for cover.
---
i predict btc is going to enter into a multi-month- parabola once the previous all the high is properly tested. we don't particularly have to tap the previous all time highs, just gotta hold my green box to confirm expansion.
---
often times, extreme fear + miner capitulation create major bottoms, and this time is no different. while retail panic sells their entire bag and exits crypto, there are large entities purchasing everything. don't take my word for it, just see the data yourself 👇
---
gold was in a similar situation not too long ago, i'm sure you remember it yourself. the same kind of feeling you are experiencing today relative to the crypto cycle (structurally speaking). historically, gold runs first, while crypto lags behind it by many months. in all the previous occurrences where gold ran first, crypto ended up outperforming ten fold after.
---
my prediction here is very contrarian during these times, and it could be difficult to believe that this is exactly how it's going to play out, so i'm going to add a few more pieces of evidence to back up my theory.
---
in previous cycles, btc did not top until the business cycle topped 👇
---
in previous cycles, when dxy broke beneath 97, it triggered end of cycle crypto expansions. we are currently testing the last of supply at 97 before the next leg down 👇
---
i believe this final phase will cause btc dominance to drop rapidly as money aggressively rotates into emerging tech in the alt coin ecosystem. we refer to this occurence as "alt season". not all alt coins will perform equally. focus on emerging tech above all else and don't get shaken out. this is the final test of conviction, and only the strongest hands will make it through this.
---
🎯 = 751k
OTHERS-D

OTHERS.D (3D) — Structural Outlook and Scenarios (TOTAL-TOP10)On the chart global horizontal support and resistance zones are marked.
From the ATH on January 16.2022, USDT.D has been moving within a global descending channel. Inside this structure, we can observe two completed triangles and potentially the formation of a new triangle boundary.
The yellow zone of the global descending channel is a key zone of uncertainty.
The price reaction to this area will determine the future direction of the move.
Each triangle contains its own internal descending channel, along which price has been developing.
Historically, a breakout from an internal channel within a triangle tends to push price toward the resistance of the larger global descending channel.
-Bullish Liquidity Injection Scenario:
If the market experiences strong liquidity inflows, USDT.D may:
+Break above the internal descending channel
+Then attempt a breakout above the global descending channel
+In this case, price could move toward targets 1 → 2 → 3 → 4
Target interpretation:
1–2 (green/yellow zones): most probable and structurally justified
3: higher-risk extension
4: extreme / euphoric target with the highest risk
-Bearish / Weak Momentum Scenario
+If price fails to break out of the internal channel and instead gets rejected:
+A pullback toward the lower boundary of the internal channel becomes likely
+This scenario currently has an estimated probability of ~20%
At this stage, the structure suggests a higher probability of a breakout from the internal descending channel toward the outer (global) channel, rather than a deep corrective move.
However, all scenarios remain valid until a decisive structural break occurs.

WHAT IF…... OTHERS/BTC is printing the exact “Alt Season ignition” setup again? 👀
✅ Macro support
✅ Squeeze into downtrend resistance
✅ MACD histogram about to flip GREEN + a bullish crossover brewing
Breakout = ALT SEASON 🚀
Breakdown = TOTAL REKT ☠️

OTHERSBTC - Falling Wedge Drawn a channel using a prior wick low in white circle
A triangle or falling wedge can be drawn showing price action nearly reaching the end of the triangle, the breakout area
Still hodling out for an altseason

4 X Crypto TOTAL charts showing direction of positive investmentThese charts use the " RK's 10 ∴ MA Types Ribbons (Fibonacci, Guppy and others) " indicator in TradingView.
It is simply SUPERB and is unparalleled.
So, to business. These are all WEEKLYc harts from early 2021 to current date
Top Left TOTAL chart - Top Right TOTAL2 (Excluding Bitcoin)
Bottom Left TOTAL3 ( Excluding BTC & Eth ) - Bottom right OTHERS ( Top 125 coins minus top 10 by Market Cap )
We also see the Bollenger Bands in these Charts, the orange line being the BASIS line of that indicator, an average of movement.
You will notice the vertical dashed line on the ATH from 2021, there as an anchor to work from...a Data point.
First thing to notice, NO ALT SEASON after that date. Investment reduced Drastically.
And we can see as we move to the right of these charts No ALT Season after each "Peaks" in this cycle.
Infact, if we look at these 3 Peaks this cycle, there is a Notable difference between the TOTAL chart and the OTHERS chart.
It is only in the TOTAL and TOTAL 2 charts ( Top line ) that we see the 3rd peak being higher than the previous peaks. A Close call on the TOTAL 2
From the TOTAL 3 and OTHERS charts, we see that 3rd peak lower than the 2nd.
To remind, TOTAL 3 is all crypto MINUS BTC and ETH -> OR, to put it another way, ALL ALTS
The OTHERS are the Mid to Low Cap ALTS>.....
Both of these Groups of Crypto have seen REDUCED investment than previously..
The TOTAL chart has the greatest level of stability, with shallower Dips between the Peaks than the TOTAL2 etc
To remind, TOTAL 2 is all Crypto minus Bitcoin.
So we can understand that BITCOIN is what brought that stability to the Market.
This can all be seen Faily quickly by looking at the BASIS line of the Bollinger Bands.
The Sad thing is, there are still people waiting for ALT Season.....
As with the DOT COM Bubble, we had the Rush of ALTS previously and now, The Crypto market is shedding so many CRAP coins.......
It is simply how things work, EVERY TIME
Trade Safe and Happy Holidays to you all

$OTHERS Crushed Against $BTC - WARNING!Small Cap Alts continue to be pummeled against CRYPTOCAP:BTC
CRYPTOCAP:OTHERS needs to find a bottom very soon and break above .14 otherwise they are cooked for the cycle.
I feel very sorry for people who have 80% + of their portfolio allocated to these.
Gonna create a ton of ₿itcoin-Maxis next cycle that's for sure

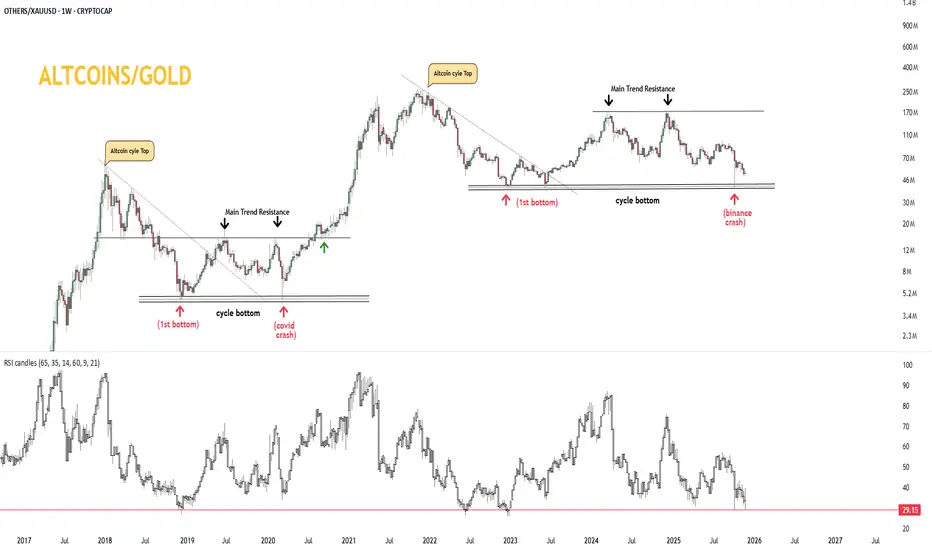
Altcoin's OutlookAltcoins have historically tended to overtake Bitcoin. We can see that the dominance of the top 10 altcoins correlates with the price of Bitcoin. It used to generally outperform it, but today it still has plenty of room to recover even in a pessimistic view. Altcoins will increase 10-50x depending on their distance from the all-time high (ATH).

ALCTCOIN SEASON? OTHERS MARKETCAP 1w ALCTCOIN SEASON? OTHERS MARKETCAP 1w
2022–2025: Horizontal Compression + Higher Lows
The highlighted yellow structure is a classic Higher Lows Compression Pattern:
-Each retest forms a higher low on the macro trend
-RSI repeatedly bounced from the oversold midline zone
-Price consolidated sideways while RSI formed a structural uptrend
-That combination usually signals a high-timeframe trend continuation.
Late 2025: The 4th Retest → Final Compression Before Breakout
This is the most critical part of the entire chart:
Price held the trend midline once again
The same level worked in 2019, 2020, 2022, and now 2025
RSI touched the 32 zone — historically the super-cycle altcoin bottom region
This setup has only appeared four times in the entire cycle.
Scenario: Structural Breakout Into 2026
If the midline holds and price expands upward from here, the following macro structure triggers:
The 2017–2025 compression ends
Altcoin marketcap enters a parabolic expansion phase
Rotations follow: Majors → Midcaps → Lowcaps
BTC dominance starts to unwind
Altcoins enter a broad-based, 2021-style run — but potentially larger in scope
The upward arrow on the chart represents exactly this:
7 years of compression preparing to break.
Summary
Trend midline is still intact
RSI is at cycle-level oversold
4th retest confirmed
Compression + higher lows = structural breakout setup
OTHERS marketcap is entering 2026 standing right on the edge of a “Breakout or Mega Trend” moment.
This chart suggests the altcoin market hasn’t started running yet — it’s only loading.
OTHERS/BTC 1M
PLUS:
• Bitcoin dominance is losing strength.
• ETH/BTC is on the verge of breaking an 8-year downtrend to the upside.
• Altcoin ETFs are right in front of us.
-----------------------------------------

BTC.D OutlookFalling down with the 2017's pattern is a possible scenario. If happens so, we can have Altseason Q1-Q2 2026 until BTC.D reaches 40%. It may be the final target, but it can reach 24% in Q1 2027 if it wants to do the complete pattern; however, the whole market is down probably by that time.

ALTSEASON ? 4 years of pressure is about to break !“Rebirth Against NVDA: Altcoins Have Reached a Historic Threshold.”
Four Years of Pressure Is About to Break ❗️
This chart actually shows two things at the same time:
**(1) The total size of the altcoin market (OTHERS marketcap)**
and
**(2) The relative strength of altcoins against a major tech giant like NVIDIA (OTHERS/NVIDIA pair).**
One reflects market breadth; the other reveals whether altcoins are *truly* gaining strength.
---The 2017 and 2021 Altseasons
The clearest message in this chart is this:
Whenever a major altseason occurred, **two signals appeared simultaneously**:
• OTHERS marketcap exploded (the blue area surges upward)
• The OTHERS/NVDA ratio also turned sharply higher
This means capital flowing into altcoins didn’t just expand marketcap — altcoins actually **outperformed the stock market**, especially a powerhouse like NVDA.
That’s why the shaded zones around 2017 and 2021 are so important:
An altseason isn’t just a rise in marketcap; it begins when the **relative strength trend flips** in favor of altcoins.
---
Long-Term Downtrend: 4+ Years of Pressure
The black line (OTHERS/NVDA) has been in a **declining trend channel** since 2021.
The red arrows show how this trend resistance has been respected again and again.
Each attempt by altcoins to gain strength has been rejected — they simply couldn’t outperform NVDA.
And this delivers a structural message from the market:
**“Altcoins haven’t been able to produce sustained strength against tech stocks for the past 4 years.”**
---
Where We Stand Now: The Final Stage of Compression
The most visible feature right now is this:
The pair is squeezing tightly inside a **falling wedge**.
This is one of the classic patterns we see before major long-term moves.
Once the compression resolves, there are usually two scenarios:
---
Upside Breakout → A New Altseason Signal
• The long-term trend resistance breaks for the first time
• OTHERS marketcap rises simultaneously
• A rotation similar to 2017 and 2021 begins
Downside Breakdown → NVDA and Tech Continue to Dominate
• Altcoins fail to generate strength
• Capital stays in large-cap equities and BTC
• Altcoins remain under pressure for longer
---
What Is This Chart Really Saying?
In simple terms:
**“Altseason is not just a rise in marketcap.
The real signal is altcoins gaining strength against the stock market.”**
And right now, the pair is at the very edge of a long-term compression.
These setups are rare — and the move after the breakout is rarely small.
---
What to Watch From Here
• A breakout above the OTHERS/NVDA downtrend
• Holding the retest after breakout
• OTHERS marketcap reacting upward at the same time
• BTC dominance flattening or turning lower
• Loss of momentum in mega-cap stocks like NVDA
If these align, the chart is essentially saying:
**“A new altseason is beginning.”**
---
Final Words
This chart summarizes one of the most important truths in crypto:
**There is no real altseason unless altcoins can compete with the major tech stocks.**
And right now, the fate of that competition depends on whether this multi-year downtrend finally breaks.
The destiny of altcoins is tied to how this compression against NVDA resolves.
Whichever way it breaks will set the tone for the next cycle.
Personally, I’m on the positive side — I believe an upside breakout is close.
All we need is patience.
OTHERS MARKETCAP 1w
OTHERS/BTC 1M
---
PLUS:
• Bitcoin dominance is losing strength.
• ETH/BTC is on the verge of breaking an 8-year downtrend to the upside.
• Altcoin ETFs are right in front of us.

ALTS HAVE ROOM TO THE DOWNSIDE.Alt's need retail participation to thrive.
If Global Liquidity tightens, #BTC rolls over into 4 year cycle lows (q4 2026)
BTC.d will rise along with Stablecoin dominance.
This inverted chart shows a well formed Head and Shoulders that is about to test again a key level of significance.
I DO NOT expect it to hold.

Others chart. Altcoins still have a chance? Others crypto cap chart! I think max what altcoins can reach this cycle around 600 billion capitalisation. CRYPTOCAP:OTHERS
On the weekly chart, the main accumulation zone is marked by the lower block! It will also serve as the primary zone if the market is gearing up for another drop across the broad altcoin market! I believe that in this cycle, it's not just a handover among investors, but also a market cleanse from projects that won't survive this cycle!
In the long term, I think this will ultimately benefit the market as a whole!
The key bearish anchor for further downside is the sell-side liquidity zone from August 2024! As we can see, during the market pullback on October 10, this liquidity zone wasn't swept!
I hope new liquidity will still emerge in the market, as The Fed officially ends the quantitative tightening (QT) program on December 1, 2025.
– The regulator will no longer reduce the balance sheet and withdraw liquidity from the market.
That said, to continue the bullish trend, we first need to break above the POC, test the main order block, and the annual opening of 2025—only then can we move to sweep the weak high, followed by acceleration toward the marked zone.

Others vs Balance sheetIf we compare the Others market vs US balance sheet, today may be the bottom for the alts and a rally should come soon.

$OTHERS and altcoin mcap is hitting resistance zoneCRYPTOCAP:OTHERS is reaching a multi-year resistance zone.
From here, two scenarios are possible:
1️⃣ It breaks through and flips the zone into support, or
2️⃣ It gets rejected.
🔎 1H Time Frame
Price is touching the multi-year red resistance line — a key level to watch.
- Stochastic RSI is high, suggesting a possible short-term cooldown.
- However, the local structure remains bullish, showing a clear uptrend with periods of consolidation.
📆 1D Time Frame
- The trend boxes indicate that the broader, higher-timeframe trend is still bearish.
- We still have 2–3 days of Stochastic RSI uptrend, followed by about a week of downtrend.
📈 Summary
We’re seeing a bullish reaction in the short term (1H),
but the macro / higher timeframe (1D) trend remains bearish.
If I were looking for a long-term entry, I would personally wait until the 1D Stochastic RSI resets to the bottom, but in the current macro environment anything can happen — news and liquidity shocks can override technicals.
⚠️ DYOR and trade carefully.

ALTCOINS/GOLD cycle chart 1w ALTCOINS/GOLD cycle chart
2017-2025 OTHERS/XAUUSD weekly fractal
RSI level / 2 different cycle comparison
FireHoseReel | Crypto Index Overview🔥 Welcome FireHoseReel !
Let’s dive into the analysis of Four major crypto Index.
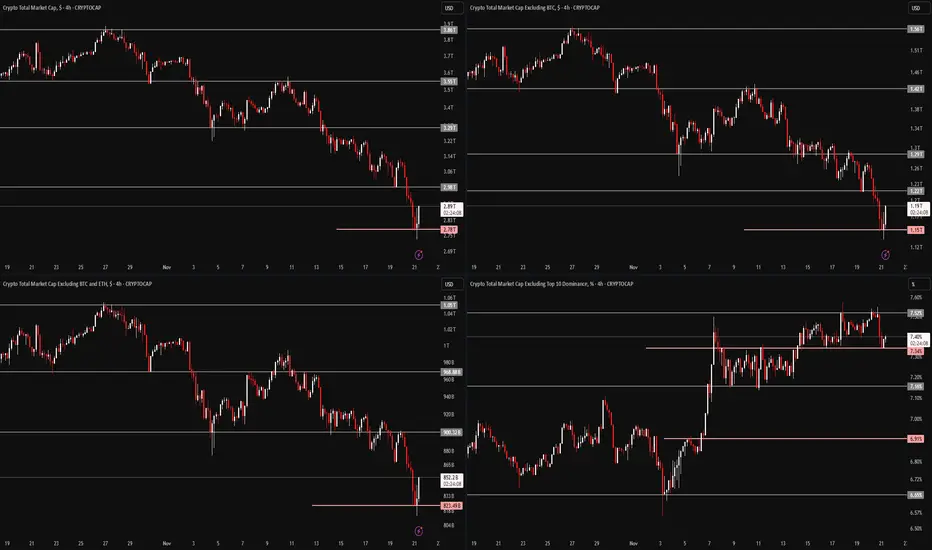
🔶 TOTAL (Crypto Market Cap) – 4H Timeframe
On the 4-hour timeframe of TOTAL, we can see a strong correlation with Bitcoin’s chart. After approaching the $4T zone, the total market cap went through a deep correction, testing multiple support levels and eventually breaking them.
It’s now sitting around $2.78T, marking a $1 trillion drop, which is something unprecedented in the crypto market.
The current support lies at $2.78T, and this level aligns closely with the upper resistance of USDT dominance, creating an important confluence. If this confluence strengthens, TOTAL may continue moving downward while USDT dominance pushes higher.
The major resistance for TOTAL is the $3T zone, and a breakout above it could create a pullback to the recent Bitcoin decline.
🔶 TOTAL2 (Altcoin Market Cap Excluding BTC) – 4H Timeframe
On the 4-hour timeframe of TOTAL2, we see a strong correlation with Ethereum’s chart.
TOTAL2 dropped from around $1.5T down to nearly $1T, following the recent sell-off in Bitcoin and Ethereum. It tested its supports and eventually lost them.
Currently, TOTAL2 is positioned near $1.15T, and breaking below this level could lead to a deeper correction in Ethereum.
On the other hand, reclaiming and breaking above $1.22T may push TOTAL2 upward and act as an early signal for a new bullish wave (mostly a pullback) in Ethereum and its ecosystem projects.
🔶 TOTAL3 (Altcoin Market Cap Excluding BTC & ETH) – 4H Timeframe
On the 4-hour timeframe of TOTAL3, the chart aligns with the performance of the top 10 altcoins.
TOTAL3 previously hovered around $1.05T and has experienced a milder decline compared to TOTAL and TOTAL2. It is currently sitting at its major support near $832B, testing a multi-timeframe support zone.
A breakdown of this level could extend the correction across the top altcoins.
However, breaking above the $900B area could generate a pullback and corrective wave against the recent downside leg, signaling potential upward movement.
🔶 OTHERS Dominance (others.d) – 4H Timeframe
On the 4-hour timeframe of OTHERS.D, we’re looking at one of the most important crypto indicators, especially in times like this. This index helps us understand when the altcoin bull market (altseason) may begin and when it's time to start building spot portfolios.
Despite the market volatility, OTHERS.D has held itself inside a stable 4H trading range and is currently reacting to the midline of its 1H range.
If Bitcoin dominance had increased during this period, altcoins could have faced an even deeper correction. However, on-chain data shows that altcoins are receiving far more attention compared to previous years.
A breakout above 7.52% on this indicator could be an early signal of a potential upcoming altcoin bull run.
🛞 Risk Management & Disclaimer
Please remember to always use proper risk management and position sizing. Nothing in this analysis is financial advice. The market can change quickly, so always trade based on your own strategy, research, and risk tolerance. You are fully responsible for your own trades.
Crypto Cycle: The Arrogance and The Irony — A Must ReadThe Cycle That Changed Everything
This cycle — which really started in October 2023 — broke every pattern from previous crypto bull runs.
Crypto was created as a rebellion:
Freedom from banks.
An anti-system technology.
Privacy.
Self-sovereignty.
A way for normal people to create wealth without permission.
And yet… somehow the exact people crypto was trying to escape have taken control of it.
Retail investors used to love the idea of owning their finances. No more banks telling them what to do. No more gatekeepers.
Until they arrived.
1 — The Arrogance
The rich run the world — that’s nothing new.
But crypto annoyed them. A lot.
Because crypto allowed ordinary people to do what Wall Street hates most:
Make money without giving the rich a cut.
So what did institutions do?
Simple:
“If you can’t kill it… own it.”
They stopped fighting crypto, took over the market, bought the exchanges, injected billions, partnered with the stablecoin printers, and unleashed industrial-scale manipulation.
The old days of making x10 or x100 on leverage?
Gone.
Retail got liquidated again… and again… and again.
Bitcoin pumped 3 times by billionaires (just look at the three green boxes on the chart).
Retail got excited — then destroyed.
Rinse and repeat.
Eventually, retail gave up.
They moved into gold, silver, or even plain USD — just to stop losing money.
Meanwhile institutions kept pumping Bitcoin and Ethereum artificially, hoping to lure back fresh meat…
but nobody came.
2 — The Irony
Then came October 11, 2025 — the day the curtain fell.
In a dry, illiquid market, Binance did their usual liquidation-hunting game, backed by newly-printed billions from Tether:
2 billion minted one day, 2 billion the next.
They pushed Bitcoin to $126,000.
Then the crash hit.
They chased longs so hard that, in a market with no liquidity, the entire altcoin market collapsed.
Some coins literally went to zero.
Binance had to halt trading.
The liquidation chain couldn’t be stopped.
Some market makers lost everything.
And now they’re furious.
Binance got exposed.
The pump-and-dump machine is broken.
And if they continue, they risk criminal investigations and lawsuits from every direction.
Suddenly BlackRock, Saylor, and friends had a problem:
Their favorite manipulation partner was knocked out.
And that’s when reality hit:
Institutions had pushed Bitcoin so high — without retail — that they found themselves holding billions in assets…
…with nobody left to buy their bags.
Old-time Bitcoin holders realized BTC was compromised and began to sell.
Bitcoin maxis rekt the institutions.
The billionaires who bought at $120k got destroyed by the exact people they planned to destroy.
Karma doesn’t miss.
Even Eric Trump started selling — too late.
Bitcoin fell under $89k, and there were no buyers left.
3 — The Lesson
Institutions need to understand one thing:
Crypto is not for institutions.
The tech? Sure.
The coins? No.
Crypto without retail is like a vampire trying to drink its own blood.
Pointless and self-destructive.
And retail won’t return for “fractional Trump coin” or corporate-approved BTC.
Retail wants:
x10, x100, x1000.
That means one thing:
ALTSEASON.
If institutions want liquidity to exit, they must engineer an altseason and share some profits.
Because without retail, they’re stuck in their expensive echo chamber holding overpriced bags that nobody wants.
And if they do create an altseason?
Retail will dump on them harder than ever — watching TradingView and influencers, selling every rally right back into the institutions’ faces.
Wall Street, stick to Wall Street.
Leave crypto to the crypto degenerates.
It’s a wild jungle, and you were never prepared.
#CryptoCycle #BitcoinCrash #AltseasonWhen #CryptoHumor #MarketManipulation #InstitutionsRekt #BinanceDrama #RetailVsWhales #CryptoReality #KarmaInCrypto #CryptoStory #PattayaCryptoDegens

4 Crypto TOTAL charts showing the ALTS are stronger right nowThese charts use the " RK's 10 ∴ MA Types Ribbons (Fibonacci, Guppy and others) " indicator in TradingView.
It is simply SUPERB and is unparalleled.
So, to business. These are all 4 HOUR charts from around mid 30 October 2025
Top Left TOTAL chart - Top Right TOTAL2 (Excluding Bitcoin)
Bottom Left TOTAL3 ( Excluding BTC & Eth ) - OTHERS ( Top 125 coins minus top 10 by Market Cap )
Vert simply we can see that the TOTAL chart had the largest Dip down, around -30% from ATH
The current Price is a Lower Low that previous
The fact that the TOTAL 2 chart has a current position around the same [rice range as the previous Low, shows us that it is BITCOIN that has seen the most withdrawl.
The TOTAL2 is the same as the TOTAL chart except it does NOT contain BITCOIN
The TOTAL 3 chart is slightly higher bit it is the OTHERS that is HIGHER by a margin
ALT SEASON maybe here but I BEG you to be Cautious.
Bitcoin IS on support
That is the 4 hour BITCOIN USDT chart for the same time period
The BTC.D chart is also showing Bitcoin Dominance is on SUPPORT
The ALT Season maybe Fragile....BE CAUTIOUS

Altcoins season Others / BTC has re-touched the same demand zone where the 2021 bull run began.
Momentum and disbelief are at historic lows.
Once this chart's recovery begins, it will drive waves of expansion for altcoins.
Altseason is inevitable.
Because I don't make the rules.

A NEW YEARS GIFT! CHEAP SHITCOINS!OTHERS Index
Has a Clear head and Shoulders
That could see an acceleration and further deterioration of #Altcoins
With major Capitulation's possible
protocol's could suffer hacks, exploits and rugs
Be careful of leveraged positions
And be aware of the risks of certain #defi platforms.
#sol
#sui
#ada
#eth
#bnb
#pulsechain
#btc

Altseason? Not yet — but the real move is coming... soon.As shown in the chart, the weekly MACD reset isn’t complete yet. A similar setup happened in September 2024 — we got a fake pump that fooled many, while the real breakout started in December 2024.
🔍 Why does this happen?
Impatient whales — often close to the “crypto president” — start buying early. Using influencers and media hype, they push the "New ATH" narrative and lure in retail. But this early FOMO creates a massive bearish divergence — the RSI hasn’t reset yet, and the market isn't ready.
📉 The result?
A painful 6-month correction that punishes impatience. The market always reverts to math — and math doesn’t lie.
You can’t fake momentum forever — no matter how much money you throw at it.
💡 My forecast remains unchanged:
Once the MACD weekly crossover happens, the real pump begins — no ETF, no Saylor needed. The market moves on its own, as it always has.
📊 Check the chart. Read the signals. Trust the data.
#Bitcoin #BTC #CryptoTrading #CryptoWhales #MACD #TechnicalAnalysis #BearishDivergence #Altseason #DYOR

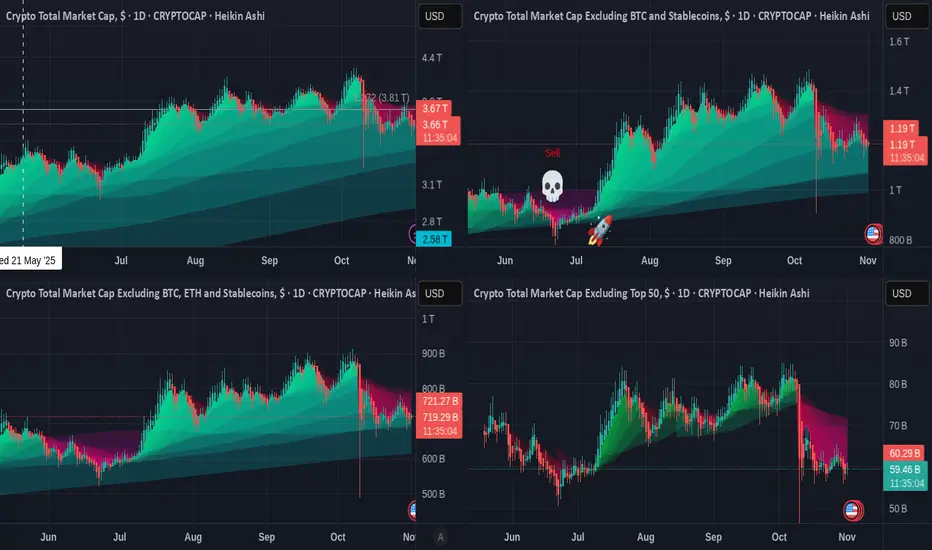
The 4 TOTAL Crypto Charts with Easy to see performance values
These charts use the " RK's 10 ∴ MA Types Ribbons (Fibonacci, Guppy and others) " indicator in TradingView.
It is simply SUPERB and is unparalleled.
So, to business. These are all DAILY charts from around mid MAY 2025
Top Left TOTAL chart - Top Right TOTAL2 (Excluding Bitcoin)
Bottom Left TOTAL3 ( Excluding BTC & Eth ) - OTHERS ( Top 125 coins minus top 10 by Market Cap )
First thing to notice is simply how the TOTAL chart is the Deepest, showing a Bigger Market trading volume. This shows us how it is BITCOIN that holds the market as all the other charts EXCLUDE Bitcoin and are more Shallow by comparison.
We can also see how the TOTAL2 chart ( exc BTC) is the only one with a SELL signal. This is the Fragility of ETH.
Looking to the RED zones on these Charts. This is where Moving Averages Fell, crossing each other as Price dropped.
The TOTAL chart has the smaller red zones, showing more resilience,
And we can see the progressively worsening situation in the ALT market, with OTHERS having a truly terrible time.
There are people out there Still Claiming an ALT Season like we used to know, is on its way.
I am sorry but while it is obviously possible, It seems obvious to me that Times HAVE changed.
The 4 DOMINANCE charts also tell us a story
These are WEEKLY charts :-
Top Left BTC.D - Top right ETH.D
Bottom Left OTHERS.D - bottom Right USDT.D
We all know about Bitcoins utter Dominance this cycle, the main cause of the lack of a sustained ALT season. TOTAL chart, or BITCOIN is the only one that remains above its 100 EMA (blue), 128 EMA ( green) and the 200 EMA ( Yellow)
None of the other charts involve Bitcoin and they are Not as strong.
We See how ETH.D was falling away until recently when it turned higher in late April 2025 but as we see from the main chart, this failed to really make any inroads into Bitcoins status, and is now once again falling away
What is VERY Telling os how the OTHERS.D has been falling away since March 2024.
ALTS have been loosing the battle for over a year now, a sustained growth never appeared.
Quick flash in the Pan rises followed by massive sell offs.
Apart from some coins that have sustained growth, like SOLANA and BNB but this is another story for another post.
What I do find very interesting is how USDT.D is in a diminishing pennant....the use of USDT getting smaller and smaller as "Cashing out" is reduced.
So, where are we in the Market ?
I feel that the ALT Traders will soon begin to loose Faith and may begin the flow of whats left into the ore established ALTS...like SOLANA, BNB and maybe XRP etc. Rotation will begin.
The USa Will continue to push ETH as an alternative for BTC
I think we have a Very strong possibility this "Bull run" will morph into the Normality of Crypto, we may not see the massive sell off we got used to previously.
This will curb the massive profit possibilities and no one wants to see this but Bitcoin has Matured away from the petulant teenager...and is now an Adult.
This is very much my opinion and YES, I do still Hold some ALTS.....
But BITCOIN has ABSOLUTELY CONTROLLED THIS and will continue to do so.
$OTHERSL a bullish signal is about to happen on 1WThis bullish signal has historically marked the start of every altseason, leading to a total altcoin market cap increase of at least 40% and up to 150% in previous cycles.
The signal appears on the RSI, one of the most reliable momentum indicators — and it may even invalidate the current bearish MACD scenario.
We could see a few months of moderate growth due to the divergence between the 1W MACD and RSI, but once these two indicators align in the same direction — boom! 🚀
Get ready, because the next altseason might already be forming on the chart — and if everything lines up, it could be massive.
📆 We'll know the answer by November.
#Altseason #CryptoMarket #RSI #MACD #Altcoins #CryptoTrading #TechnicalAnalysis #BullishSignal #AltcoinSeason #MarketAnalysis #CryptoInvesting
