GOLD Weekly Levels: Buy/Hold 4270/4300 Target 4500/4633 🔱 GOLD WEEKLY SNAPSHOT — EXECUTIVE SUMMARY
✨ Gold in wave-4 accumulation after extended impulse
🟡 Primary impulse complete: 3910 → 4500 (H2/H4)
🔄 Current pullback: 4500 → 4268 = corrective, not reversal
🧱 Accumulation zone: 4300–4268 (buy dips only)
📈 Trend remains bullish while above 4210
🚀 Wave-5 target: 4630–4650 price discovery zone
⏳ Expect consolidation before expansion
⚠️ Invalidation: acceptance below 4210
🎯 Strategy: buy & hold dips, don’t chase highs
🏦 Final leg likely followed by larger consolidation
🗳️ Gold Weekly Scenarios — What’s Your Play?
Which path do you have for XAUUSD next week?
🅰️ Hold 4,27x–4,30x → continuation toward 4,500+ / wave-5 extension
🅱️ Dip into 4,25x–4,26x, then rotate higher (accumulation before breakout)
🅲 Acceptance > 4,380 → squeeze confirms upside continuation
🅳 Your level: drop one price you’re watching most next week
🔥 GOLD WEEKLY SNAPSHOT — BY PROJECTSYNDICATE
🏆 Swing High / Swing Low
$4,500 → $4,268 — controlled pullback from the wave-3 peak following an extended impulse. The decline into the $4,26x area shows overlap, compression, and reduced momentum, consistent with a wave-4 corrective phase rather than trend reversal. Weekly structure remains constructive while price holds above key invalidation.
📈 Trend
Higher-timeframe:
Primary trend remains bullish following a completed 5-wave impulse on H2/H4, with wave-3 extension from $4,000 → $4,500 confirming strong trend participation.
Tactical:
Current price action fits a wave-4 accumulation / consolidation phase:
Shallow pullback relative to wave-3
Overlapping ranges
Compression above prior breakout structure
As long as price holds above $4,210, the tape favors continuation into wave-5 rather than deeper correction.
🛡 Supports – Accumulation / Buy-Side Zones
$4,300–$4,270 🟢 Accumulation zone
Primary wave-4 basing area. This zone represents:
Prior minor breakout structure
Overlapping corrective price action
Area of strongest dip-buying interest
Preferred zone for buy-the-dip positioning, not aggressive chasing.
$4,250–$4,230:
Secondary support shelf and intraday defense zone. Acceptance below this area would increase corrective risk but does not yet invalidate the bullish structure.
$4,210 🔑 Structural invalidation
Loss and acceptance below $4,210 invalidates the wave-5 continuation thesis and signals a deeper corrective phase instead of immediate trend extension.
🚧 Resistances – Upside Objectives / Expansion Targets
$4,380–$4,400:
First upside resistance and near-term liquidity magnet. A clean reclaim and hold above this zone would confirm wave-4 completion.
$4,500:
Prior high and breakout trigger. Acceptance above $4,500 opens the door for wave-5 price discovery.
$4,630–$4,650 🎯 Wave-5 target zone
Projected wave-5 expansion objective based on prior impulse proportions. This zone represents the final upside leg of the current impulse sequence before a larger-degree consolidation becomes likely.
🧭 Bias Next Week
Primary bias: buy dips within the accumulation zone, do not chase highs.
The market structure favors:
Continued consolidation early week
Holding above $4,250–$4,210
Breakout attempt toward prior highs later in the week
As long as price remains above $4,210, upside continuation remains the dominant scenario.
⚖️ Base Case Scenario
Early week:
Price continues to range within $4,270–$4,330, maintaining compression and absorbing supply from late longs.
Mid-week:
Sustained holding above the accumulation zone invites renewed upside momentum toward $4,380–$4,400.
Expansion phase:
Acceptance above $4,500 triggers wave-5 continuation toward $4,630+, with momentum-driven price discovery.
🚀 Breakout / Invalidation Triggers
Bullish confirmation:
Daily acceptance above $4,500 confirms wave-5 in progress and shifts focus to higher expansion targets.
Bullish invalidation:
A clean break and acceptance below $4,210 invalidates the wave-5 thesis and signals a deeper corrective structure instead of continuation.
🔓 Bull / Bear Structural Lines
Bull structure line:
Above $4,210 — impulse structure intact, dips are corrective and buyable.
Bear expansion line:
Below $4,210 — bullish continuation delayed; opens scope for a deeper retracement toward lower demand zones before any renewed upside.
🧭 Recommended Strategy — Buy & Hold Dips (Accumulation Phase)
⚠️ Illustrative framework, not financial advice. Manage risk according to your own rules.
1️⃣ Primary Strategy — Accumulate Pullbacks
Focus on $4,300–$4,270 for staged long exposure
Avoid chasing strength near highs
Use acceptance and structure confirmation for entries
Risk management / invalidation:
Tactical invalidation: sustained acceptance below $4,210
Upside objectives:
First objective: $4,380–$4,400
Breakout objective: $4,500
Expansion target: $4,630–$4,650 (wave-5 projection)
Outlook

Gold Weekly Levels: Break above 4555 → 4625/4635🔱 GOLD WEEKLY SNAPSHOT — EXECUTIVE SUMMARY
✨ Bulls remain in control as price transitions into the Wave-5 extension sequence
🟡 Key unlock level: 4555 — a clean break/acceptance above opens continuation fuel
🚀 Wave-5 extension target: 4625–4635 (primary upside objective / price discovery ceiling)
🧲 Fresh overhead sell-side liquidity: 4625–4635 = high-probability “max-out + reversal” zone
🔄 Expectation after 4625–4635: corrective rotation lower profit-taking + liquidity sweep
🛡 Bull structure remains intact while above: 4350 first major buy-side pool
⚠️ Bears’ post-extension objectives: 4350 → 4275 fresh buy-side liquidity targets
🎯 Strategy this week: trade with the trend into 4625–4635, then shift mindset to correction timing
🏦 Core play: don’t chase highs under 4625–4635; scale out into target, then stalk reversal setup
________________________________________
🗳️ Gold Weekly Scenarios — What’s Your Play?
Which path do you have for XAUUSD next week?
🅰️ Hold above 4555 → wave-5 extension triggers → 4625–4635 sweep
🅱️ Fakeout / dip under 4555 early week → reclaim → squeeze into 4625–4635
🅲 Direct drive into 4625–4635 → rejection confirms reversal → correction targets 4350/4275
🅳 Your key level: 4555
________________________________________
🔥 GOLD WEEKLY SNAPSHOT — BY PROJECTSYNDICATE
🏆 Swing Structure
Gold is still operating in a bull-controlled tape, but this week is about finishing the move:
• 4555 is the trigger level that opens the door for continuation.
• Once continuation engages, the market is likely to seek a final liquidity run into 4625–4635.
• That zone is important because it’s not just a target — it’s fresh overhead sell-side liquidity, meaning it’s where late longs get trapped and smart money sells into strength.
• After the sweep completes, the roadmap flips: correction phase begins, with bears likely targeting fresh buy-side liquidity at 4350 and 4275.
________________________________________
📈 Trend
Higher-timeframe bias
Primary bias remains bullish, with the market positioned for a Wave-5 extension.
Tactical
This week is likely to trade in two phases:
Phase 1: Continuation & Extension
• Bulls defend structure, build pressure, then break 4555
• Momentum rotates higher as stops/liquidity fuel expansion
• Price seeks the 4625–4635 magnet
Phase 2: Max-Out & Correction
• Once 4625–4635 is tagged/swept, upside becomes asymmetric risk
• Expect rejection behavior stall → wick → displacement down
• Market shifts to “where’s the next liquidity pool?” → 4350, then 4275
________________________________________
🛡 Supports — Demand / Buy-Side Liquidity Zones
4555 Pivot / Trigger
This is the most important tactical level this week:
• Above it: continuation bias stays active
• Below it: market may chop, reload, or run a dip-reclaim pattern
4350 Fresh buy-side liquidity
• This is a post-extension magnet.
• If Wave-5 completes near 4625–4635, 4350 becomes the first major “bear target”.
• Also likely to act as a reaction zone once tagged.
4275 Fresh buy-side liquidity
• Secondary downside objective once 4350 is taken.
• Often the “final grab” zone that completes the correction leg.
• Expect increased bid interest here after liquidity is swept.
________________________________________
🚧 Resistances — Upside Objectives / Wave-5 Expansion Targets
4555 Breakout gate
• Break + acceptance = green light
• Rejection + failure = delay, not necessarily reversal until 4625–4635 is visited
4625–4635 Wave-5 extension + fresh sell-side liquidity
This is the main event:
• The market is expected to run this zone because it holds fresh overhead liquidity
• This is where you expect:
o stop runs
o late FOMO entries
o liquidity sweep behavior
o reversal conditions forming
Trade mindset at 4625–4635:
✅ take profits / reduce risk
❌ don’t initiate fresh longs late into the zone (unless you’re scalping with strict rules)
________________________________________
🧭 Bias Next Week
Primary bias: bullish continuation into 4625–4635, then correction expected.
What you’re trading this week:
• Bulls: break 4555 → push extension
• Bears: wait for 4625–4635 sweep → trigger correction → target 4350/4275
________________________________________
⚖️ Base Case Scenario Most likely path
Early week: pressure + positioning
• Market holds firm and works around the pivot zone
• Any dips are likely corrective and designed to reload liquidity for the break
Mid-week: trigger + acceleration
• 4555 breaks/holds
• Momentum expands; price begins seeking the upper liquidity pool
Late week: target hit + reversal risk increases sharply
• Price reaches 4625–4635
• Expect “max-out” behavior:
o stall / compression at highs
o wick sweeps
o sharp rejection candles
• Once rejection confirms, correction leg begins targeting:
o 4350 first
o 4275 next
________________________________________
🚀 Breakout / Invalidation Triggers
✅ Bullish confirmation trigger
Clean break + acceptance above 4555
• Confirms Wave-5 continuation is active
• Increases probability of reaching 4625–4635
⚠️ “Max-out” reversal trigger (what you’re watching at the top)
Sweep into 4625–4635 + rejection
Common confirmation behaviors:
• quick spike into the zone, then close back below
• repeated failure to hold above 4630-ish
• sharp displacement down after a liquidity grab
✅ Bearish continuation trigger
Rejection confirmed from 4625–4635 + breakdown through local supports
• Opens correction flow into 4350, then 4275
________________________________________
🔓 Bull / Bear Structural Lines
🟢 Bull control line: Above 4555
🟡 Transition line: 4625–4635
🔴 Bear objective line: Below post-top breakdown correction seeks 4350 → 4275
________________________________________
🧭 Recommended Strategy Framework
1️⃣ Primary Play — Ride Wave-5 into the extension
Idea: Bulls maintain control → break 4555 → push into 4625–4635
• Build exposure only when the market proves it can hold above 4555
• Prefer entries on:
o reclaim/hold of 4555
o shallow pullbacks that respect the breakout structure
• Risk management focus: avoid chasing once price is extended and nearing 4625–4635
2️⃣ Profit-taking Plan — Scale out into 4625–4635
This is your sell-side liquidity zone:
• Reduce longs into the target
• Tighten risk aggressively
• Assume reversal risk rises the closer price gets to 4635
3️⃣ Secondary Play — Hunt the correction AFTER the sweep
Once Wave-5 extension completes:
• Bears likely target fresh buy-side liquidity:
o 4350
o 4275
Correction mindset:
• First drop often sharp (trap release)
• First bounce likely around 4350
• If 4350 breaks clean, expect continuation into 4275
________________________________________
✅ Weekly Levels
• 4555: breakout gate / continuation trigger
• 4625–4635: wave-5 extension + sell-side liquidity (reversal window)
• 4350: buy-side liquidity target #1 (post-top correction)
• 4275: buy-side liquidity target #2 (deeper correction objective)

XRPUSDT: Bullish Breakout – Trend Reversal Ahead?Hello TradingView Community!
This is our first post as we join this amazing community. Today we're taking a look at the XRPUSDT pair on Binance.
After more than 4 months trapped in a descending channel with lower highs and consistent selling pressure, XRP has finally broken out to the upside, closing decisively above the upper trendline on Daily timeframe.
This breakout suggests a potential shift from bearish to bullish trend, marking the end of the corrective phase.
Now price has pulled back and is currently retesting the former channel resistance (now flipped support) around $2.10, which perfectly overlaps with a 3-day Fair Value Gap / imbalance — a clear Point of Interest (POI).
As of this writing, price is testing this zone from above. A bullish reaction here (e.g., rejection of lower wicks, volume increase, or reversal candle) would confirm the flip and open the door for continuation higher.
I'm personally already long from this area, targeting:
• First TP: $2.83 (previous channel high / measured move)
• Main TP: Fibonacci Extension 1.272 (~$3.10 region) → offers ~3:1 RR from entry near the zone
As long as price respects this retest zone as support, the bullish bias remains intact. Watching closely for confirmation on close and volume!
What do you think — ready for the next leg up? 🚀
#XRP #Ripple #Crypto

EURUSD - Bulls in Control… But For How Long?OANDA:EURUSD
Daily Timeframe
Swing Structure: Bullish
Fractal Structure: Bullish
Price continues to respect the daily bullish swing structure, with two upside liquidity pools (previous highs) acting as longer-term objectives.
Our primary Point of Interest (POI) sits within the daily fractal structure, aligned with a Daily FVG, where an immediate bullish response is expected — contingent on LTF confirmation.
Below the daily fractal low, price intersects a confluence of Daily FVG + BB + OB, which could provide another bullish reaction point. However, if price reaches this zone, the daily fractal structure shifts into a potential bearish transition, and therefore stronger confirmation is required before considering long positions.
Invalidation:
A clean break below the Daily OB would weaken the current bullish narrative, suggesting the need to reassess the structure as bearish on the higher timeframe.
4H Timeframe
Swing Structure: Bullish
Fractal Structure: Bearish
On the 4H chart, early short positions taken on the bearish daily fractal structure have been liquidated, followed by price entering a small consolidation phase. From there, we observed a fractal shift from bullish to bearish, aligning the 4H direction with the potential HTF pullback.
The immediate reaction zone is the Daily bullish FVG, where price may deliver a short-term move higher.
The ideal setup would involve a touch of both the Daily FVG + 4H FVG, allowing for structural alignment.
Execution Plan:
Conservative: Wait for 4H bullish fractal confirmation before entering longs.
Aggressive: Look for a dual fractal break to the upside on the 1H as early confirmation.
If the Daily FVG fails, the next POI becomes the next 4H FVG in confluence with a nearby OB.
Again, long positions require 4H bullish fractal change or the same 1H double-break confirmation.
Deeper retracement scenario:
A move below the Daily fractal low places focus on the next Daily FVG + BB + OB confluence, ideally aligned with 4H BB + 4H OB.
In this case, LTF confirmation becomes insufficient — I would require either:
Double 4H fractal break → bullish, or 1D fractal break to the upside to signal a shift in orderflow.

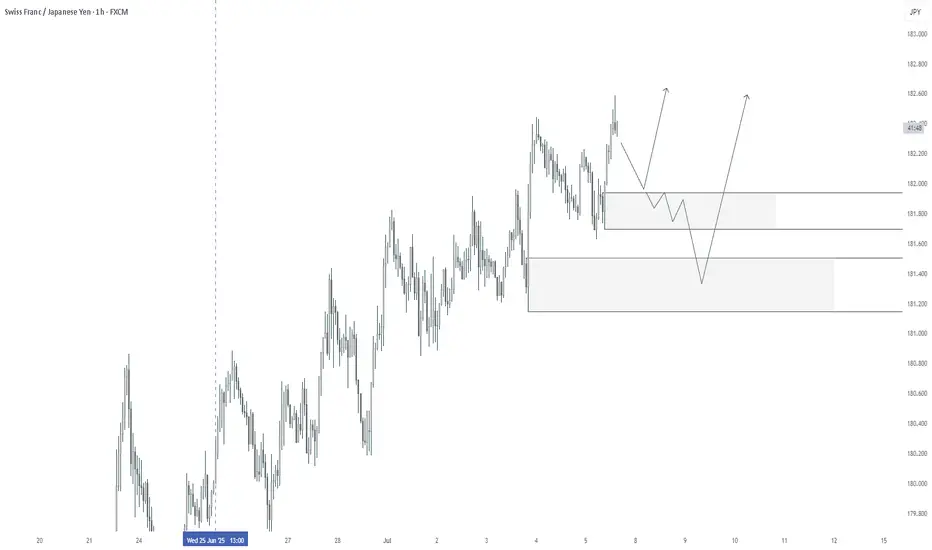
Swiss Franc: Approaching Key ER SupportThe Swiss franc is now testing the lower boundary of the Expected Range (ER) — a zone for potential pause or bounce.
Also
this ER level aligns perfectly with a visible liquidity cluster (marked with arrow) .
📌 In other words:
It's not only a statistical support — it’s a confluence = higher probability reaction.

General Market OutlookHello, I want to talk about markets in general before the week start.
The Federal Reserve is trying to navigate with limited data. Recently, after Governor Waller used ADP data without authorization, the Fed lost access to ADP’s high-frequency employment data as well.
CPI and core CPI both came in at 3%, slightly below market expectations but in line with Cleveland Fed and Bloomberg models. With inflation not overheating, there is little reason for the Fed to delay rate cuts in its remaining two meetings this year, though these cuts are likely already priced in. The real focus will be on what FED will do in 2026.
This week brings meetings from the Fed, ECB, BOJ, and BOC, while the Trump–Xi talks will take center stage. For me, the most important event will be the US–China negotiations. China holds a structural advantage: its exports have remained resilient despite US tariffs, supported by rising trade with South America, Africa, the EU, and South Asia. Meanwhile, the US remains heavily dependent on China for rare earths, a situation unlikely to change soon. However, China’s top priority remains its economy, which should keep the door open for compromise and negotiations.
Also, keep an eye on the shutdown situation and upcoming earnings reports.
US bond yield is falling, now a battle around 4% is ongoing for 10-y yield. If it bounced from 3.85% trendline dollar might try to recover, but so far I don't see any reason for a dollar jump, rather the tight range between the trendline from 2011 and 100 resistance likely to continue.
EURUSD is trying to recover with slighlty bullish trend but this trend could turn into flag formation easily if dollar index to make a move towards 100. I expect EURUSD to continue recover with strong data from EU and weaker data from US. If shutdown extends further, both stock market and dollar might turn bearish.
There’s nothing new to add for USDJPY beyond the previous analysis. If the base case scenario unfolds, it will support the dollar index retesting its trendline in the coming weeks.
Nasdaq is still trending high with insane amount of AI investments and better than expected earnings. High valuations, shutdown and China fears are not in the spotlight yet. As long as Nasdaq trend channel continues, no reason to back out bullishness, but careful if it break because corrections often came very hard.
Crypto market is yet to recover after the massive sudden crash. Bitcoin is less effected, but still has a problem. If 114k regained, maybe signs of recovery will be more clear. But the danger is not over yet.
My base case for gold to hold above 4000 and recover towards 4250. 4160 is a key resistance this week. I expect gold is getting to a long term peak, likely to hit before the year end but still has some way to go. I will write about Silver's long term cycle in a couple of days so stay tuned for that.

Wall Street Weekly Outlook - Week 44 2025 [27.10.- 31.10.2025]Wall Street Weekly Outlook – Week 44, 2025 📊💥
Let’s dive into another exciting trading week! 🚀
Rate decisions, month-end flows, and fresh quarterly earnings are setting the stage for strong market moves.
Sit back, enjoy the overview, and dive into the world of banks, hedge funds, and institutional flows — with exclusive insights into how the pros are positioning right now. 🧠💼📈
Extra Lessons: Strategies, setups, and market psychology — everything you need to know for the week ahead. ⚡️
**S&P500 Performance after FED rate cuts**
**Overview: The most important events of the week**
Have a great start to the trading week!
Meikel

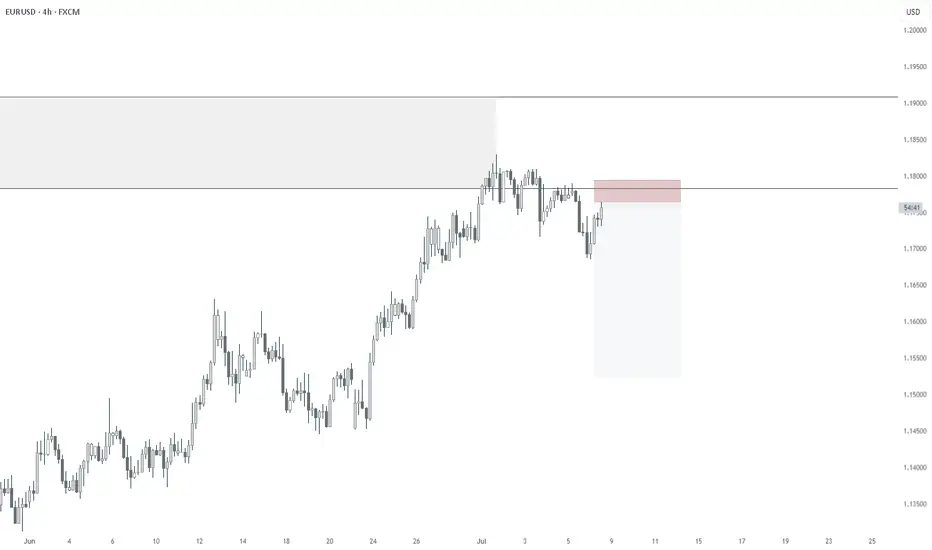
EUR/USD - Outlook (LTF ranging market)🔥 EUR/USD Outlook Breakdown 🔥
Let’s decode this clean structure — multi-time-frame style with a punch of trader slang 👇
🧭 Weekly Timeframe
We’re chilling just under a long-term bearish resistance trend, and the last few weeks show clear compression beneath that line.
The weekly breakout candle couldn’t sustain upside, hinting sellers are still lurking.
Price holds under 1.1800, keeping HTF (higher-time-frame) structure bearish.
➡️ Eyes on the 1.1500–1.1450 zone as next liquidity grab if momentum kicks in.
📆 Daily Timeframe
Daily shows a ranging market between 1.1750 resistance and 1.1550 support.
We saw a BOS earlier in the structure, but bulls couldn’t follow through.
Multiple rejections from the supply block confirm short-term hesitation.
The support trendline is hanging on — but if it snaps, expect the cascade to begin.
Targets line up clean:
🎯 Target 1: 1.1400
🎯 Target 2: 1.1150
🎯 Target 3: 1.1000
⏰ 8H Timeframe
On the 8H, we’re playing ping-pong inside that same range.
Price grabbed the BSL (Buy-side Liquidity) up top and retraced to the mid-range demand.
Both BH zones are acting as intraday traps — classic indecision setup.
Until we break out clean, expect chop.
➡️ However… here’s the key line:
“HTF supports bearish price action although STF is currently ranging giving unclear direction. HTF will take control.”
That means we’re likely setting up for a fake bullish pop before a strong bearish drive, once HTF order flow dominates.
🎯 Trade Idea
Bias : Bearish (waiting for HTF dominance)
Setup : Sell the fake-out above range highs or on break & retest of 1.1550 support
Targets : 1.1400 → 1.1150 → 1.1000
Invalidation : Daily close above 1.1750
Gameplan : Stay patient — HTF flow will win.
⚡ Summary
EUR/USD is stuck in a rangey mess, but the bigger picture screams bearish.
When HTF takes back control, expect a breakdown toward 1.1400+ zones.
Shorts will be the move once that range floor cracks.

Wall Street Weekly Outlook - Week 43 2025 [20.10.- 24.10.2025]Wall Street Weekly Outlook - Week 43 2025
Every week I release a Wall Street Weekly Outlook that highlights the key themes, market drivers, and risks that professional traders are watching.
+Extra lessons:
Any questions? Drop a comment or reach out directly.
Best,
Meikel

Wall Street Weekly Outlook - Week 42 2025Every week I release a Wall Street Weekly Outlook that highlights the key themes, market drivers, and risks that professional traders are watching.
This week promises to be particularly volatile.
With tensions escalating in the U.S.–China trade conflict, markets already began to show the first signs of risk-off sentiment late Friday. In this video, I’ll break down what this shift means for global markets and how investors can navigate the current environment.
+Extra lesson:
Any questions? Drop a comment or reach out directly.
-Meikel

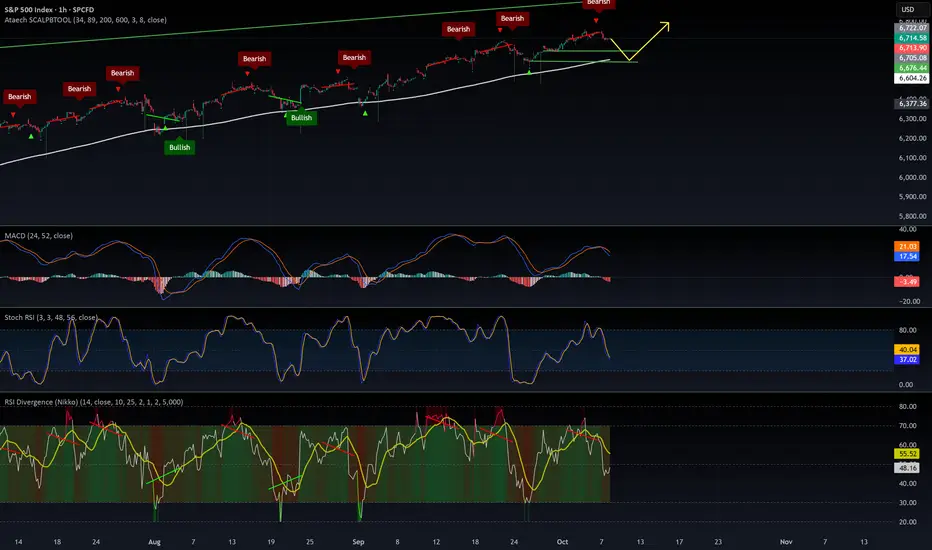
A healthy consolidation should dip lowerA healthy consolidation should dip lower (around $6,648 or even better $6,000) before bouncing.
But will the billionaires manipulating this market have the patience — or will they fire their money into the air too soon?
Hopefully, we get a deeper correction for a solid long setup by the end of the week and a strong rebound next week.
Patience is key. 🕒
Wall Street Weekly Outlook - Week 41 2025Every week I release a Wall Street Weekly Outlook that highlights the key themes, market drivers, and risks that professional traders are watching.
This week promises to be particularly important, with important fundamental developments... 📊 Stay ahead of the curve—watch the video now and get prepared like a Wall Street insider.
Any questions? Drop a comment or reach out directly.
-Meikel

Wall Street Weekly Outlook - Week 40 2025Every week I release a Wall Street Weekly Outlook that highlights the key themes, market drivers, and risks that professional traders are watching.
This week promises to be particularly important, with several events likely to move markets. 📊 Stay ahead of the curve—watch the video now and get prepared like a Wall Street insider.
Any questions? Drop a comment or reach out directly.
-Meikel

Wall Street Weekly Outlook - Week 39 2025Every week I release a Wall Street Weekly Outlook that highlights the key themes, market drivers, and risks that professional traders are watching.
This week promises to be particularly important, with several events likely to move markets. 📊 Stay ahead of the curve—watch the video now and get prepared like a Wall Street insider.
Any questions? Drop a comment or reach out directly.
-Meikel

USD/JPY - Forecast 🕰 Weekly View
Price is ranging under 148–150 weekly resistance while holding above the 142–144 weekly demand zone. If demand continues to hold, we could see a push back toward the 156–158 target. A clean break below 142 would invalidate this outlook.
📉 Daily Structure
Major Resistance: 148–150 supply block
Major Support: 142–144 demand zone
Price is coiling between mid-range weak support and overhead resistance, building liquidity for the next move.
⏱ 8H Breakdown
On the 8H, price is capped under the descending trendline. Refined demand sits around 144–145. A sweep into this level could fuel the next bullish continuation. Breakout above 150 opens the road directly into 156–158.
🔎 Outlook
Short-term pullback still possible → but overall structure favors a mid-term bullish continuation targeting 156–158.
Bias: Short-term pullback → mid-term bullish.

Wall Street Weekly Outlook - Week 38 2025Every week I release a Wall Street Weekly Outlook that highlights the key themes, market drivers, and risks that professional traders are watching.
This week promises to be particularly important, with several events likely to move markets. 📊 Stay ahead of the curve—watch the video now and get prepared like a Wall Street insider.
Any questions? Drop a comment or reach out directly.
-Meikel

Gold Weekly Outlook - September 1 - 5Gold is bullish. We close the month of August with a strong bullish candle. I would like for gold to continue buying to the extensions of the the month of April's candle. See the video for the complete breakdown.

EURNZD - LONG🚀 Yo Edgeflow — Bias for today is live!
🎯 100 % model-driven.
No trend-line art, no gut calls. Just a repeatable institutional process delivered every day at London Open
🧠 What Chronex does (bird’s-eye view)
- Scans all 28 major FX pairs every session.
- Ranks each currency’s relative strength / weakness from multi-TF data.
- Pairs strongest vs. weakest to create a tight outlook list.
- Adds built-in risk filters → posts one clean table: *Direction · Conviction · Entry zone · SL*.
📍 Today’s Playbook:
Checklist
H1 Structure:
H1 Orderflow:
m15 Orderflow:
Entry Model:
Risks
1. Do we have economic high impact news release?
2. Any higher-timeframe counter-trend zones?
3. Has better zone above/below?
💬 Drop questions, challenge the outlook, or share your own setups below!

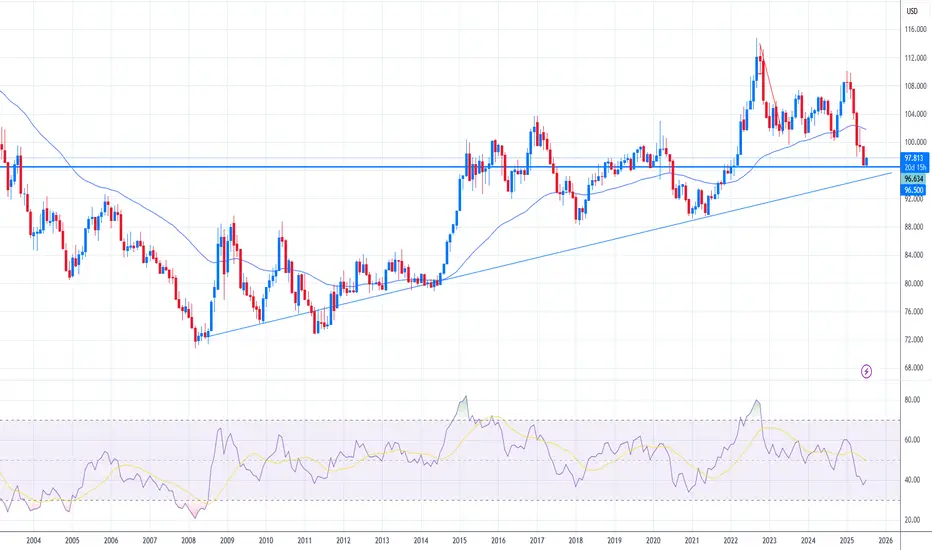
DXY Tests Key Support – What’s Next for the Dollar?
The U.S. Dollar Index (DXY), which tracks the dollar’s performance against a basket of major currencies, recently broke below its 50-month moving average based on the monthly chart —a significant technical signal. After this drop, the index is now bouncing off a key support zone near 96.50.
This area has acted as a pivot point in past cycles, and a sustained bounce could indicate the dollar regaining strength. If risk sentiment fades—due to weaker equity markets, geopolitical tensions, or stronger U.S. data—the dollar might find new momentum.
On the flip side, failure to hold 96.50 could open the door toward the 90.00 zone, a major long-term support level. Such a move would likely reflect expectations of looser U.S. monetary policy or further deterioration in economic confidence.
For now, price action near 96.50 will be decisive. A rebound could shift sentiment back in favor of the dollar, while a deeper decline may trigger broader adjustments in FX markets. Traders should closely monitor upcoming macro data and risk sentiment for cues on the next leg.
07/08/2025 - EURUSD - HEDGE SHORTHedge Short for FX:GBPUSD
COT Retailer still extended
We are on the higher timeframe weekly zone
Substructure is already confirmed bearish
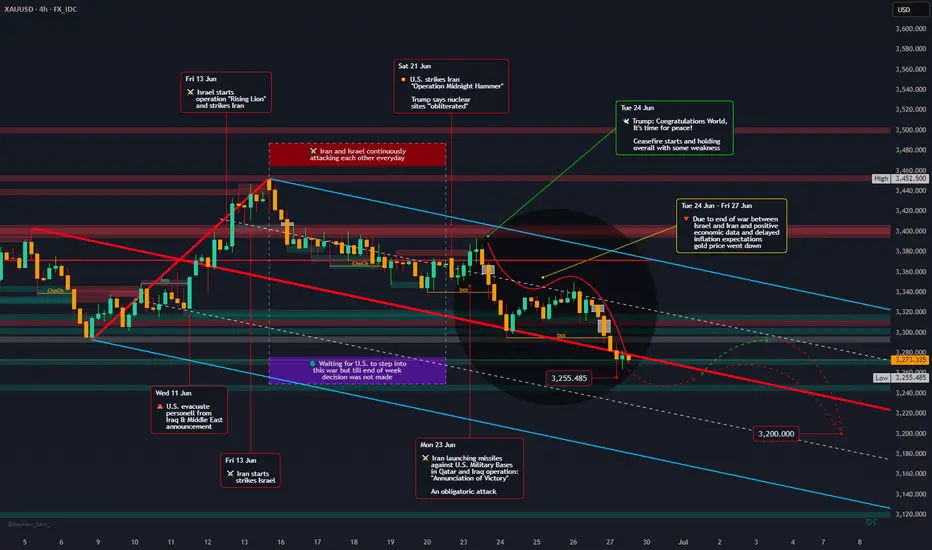
Down the road - Gold Outlook June 30 - July 24, 2025FX_IDC:XAUUSD
📰 The past weeks has been a wild ride for gold prices, caught between the fiery conflict in the Middle East and a deluge of crucial economic data from the U.S. 📈 Adding to this, a detailed technical analysis provides a deeper look into gold's immediate future.
**Geopolitical Drama Unfolds & Peace Prevails!** 🕊️ ceasefire negotiations.
Initially, gold was shrouded in uncertainty 🌫️ due to the Iran-Israel war, with markets bracing for potential U.S. involvement and a full-blown escalation. Daily tit-for-tat attacks between Iran and Israel kept everyone on edge, and the question of U.S. intervention remained a nail-biter 😬, though President Trump did announce a 14-day "timeout".
Then came the dramatic twist on June 21st: "Operation Midnighthammer" saw the U.S. unleash bunker-buster bombs on Iranian uranium enrichment facilities. 💥 Short time later, the U.S. declared mission accomplished, stating their goal of destroying these sites was achieved, and no further attacks would follow.
Iran's response, "Operation Annunciation of Victory," on the following Monday, involved missile strikes on U.S. military bases in Qatar and Iraq. 🚀 Interestingly, these attacks were pre-announced, allowing for safe evacuations and thankfully, no casualties. 🙏
The biggest surprise came from President Trump as he declared, "Congratulations world, it's time for peace!" 🎉 He then brokered a ceasefire between Israel and Iran, which, despite being fragile, largely held, leading to the war's end.🤝 Both nations, as expected, officially claimed victory – a common move to satisfy their citizens. 🏅
Personally, I was genuinely surprised that the U.S.President mediated ceasefire, actually brought the conflict to a close – but it's a welcome outcome! 🙏
**Economic Data & Fed's Steady Hand** 💹🏛️
The cessation of hostilities triggered a steady downward slide in gold prices from June 24th to 27th. ⬇️ This dip initially met some market resistance but it ultimately prevailed, especially with the release of mixed U.S. economic data, which, despite being varied, was generally interpreted positively by the market.
The spotlight also shone on the Federal Reserve, with several representatives speaking and Fed Chair Jerome Powell undergoing a two-day Senate hearing. 🎤👨⚖️ Powell meticulously explained the Fed's rationale for holding interest rates steady, despite market pressures. 🤷 However, recent whispers suggest the Federal Reserve might actually cut rates in September! 😮
## Geopolitical News Landscape 🌍📰
India / Pakistan
Pakistan rejected claims that it supported militant groups active in Indian Kashmir. India issued a formal protest but reported no fresh border clashes during the week.
Outlook 🔮: De-escalation is possible in the short term. However, unresolved disputes over water rights (Indus Treaty) could reignite tensions.
Gaza Conflict
Heavy Israeli airstrikes killed dozens in Gaza, including civilians near aid centers. The UN warned that U.S.-backed aid systems are failing. Humanitarian corridors remain blocked.
Outlook 🔮: Ceasefire talks may resume in July, but success depends on international pressure and safe humanitarian access.
Russia / Ukraine
Russia advanced 36 sq mi in eastern Ukraine, deploying outdated T-62 tanks. Ukraine reinforced defensive lines, aided by Western military packages.
Outlook 🔮: The front remains volatile. Sustained Western support will be key to halting further Russian gains.
U.S. – China Trade War
A breakthrough deal was signed for China to fast-track rare-earth exports to the U.S. Talks on tech transfer and tariffs continue behind closed doors.
Outlook 🔮: A phased de-escalation is possible, but deep trust issues linger, especially over semiconductors and AI.
🌐 Global Trade War
Several countries, including Brazil and Thailand, imposed fresh restrictions on Chinese imports, echoing the U.S. stance. Global supply chains remain fragmented.
Outlook 🔮: Trade blocs like the EU and Mercosur may take on greater importance as countries hedge against rising protectionism.
Trump vs. Powell
Fed Chair Powell resisted political pressure, stating rate cuts are unlikely before September. Trump called him “stubborn” and demanded immediate easing.
Outlook 🔮: The Fed’s independence is under strain. If Trump wins re-election, major policy shifts could follow.
📈 U.S. Inflation
Despite tariffs, core inflation remains elevated. Powell warned of persistent price pressures. Trump insists the Fed should cut rates to boost growth.
Outlook 🔮: A rate cut later in 2025 is possible—if labor market data weakens. Until then, inflation will remain politically explosive.
## Technical View 📐📈
**Current Market Context:** Gold plummeted to $3,273.67 USD/t.oz on June 27, 2025, marking a 1.65% drop from the previous day, which confirms the strong bearish momentum. The price action shows a significant retreat from recent highs around $3,400.
**ICT (Inner Circle Trader) Methodology Analysis:**
* **Market Structure:**
The trend is clearly bearish, with a definitive break of structure (BOS) to the downside.
* **Order Blocks:**
Several bearish order blocks have been identified at prior resistance levels, specifically in the $3,380-$3,400 range.
* **Fair Value Gaps (FVG):**
The aggressive sell-off has created multiple imbalances, particularly in the $3,350-$3,320 range.
* **Liquidity Pools:**
Buy-side liquidity above $3,400 has been swept. Sell-side liquidity is now accumulating below the $3,270 lows, which is the current target zone.
* **Session Analysis:**
The London session showed aggressive selling, followed by a continuation of bearish momentum in the New York session. The Asia session could see consolidation or further declines.
* **Smart Money Concepts:**
Heavy selling pressure suggests "smart money" distribution. There's been strong bearish displacement from $3,380 down to $3,270, indicating the market is currently in a "sell program" phase.
**Gann Analysis:**
* **Gann Angles & Time Cycles:**
The primary 1x1 Gann angle has been broken, pointing to continued weakness. Key price squares indicate resistance at $3,375 (25²) and support at $3,249 (57²). Daily cycles suggest a potential turning point around June 30-July 1, while weekly cycles indicate continued pressure through early July.
* **Gann Levels:**
* Resistance: $3,375, $3,400, $3,481 (59²)
* Support: $3,249, $3,136, $3,025
**Fibonacci Analysis:**
* **Key Retracement Levels (from recent swing high to low):**
* 78.6%: $3,378 (Strong resistance)
* 61.8%: $3,348 (Key resistance zone)
* 50.0%: $3,325 (Psychological level)
* 38.2%: $3,302 (Minor resistance)
* 23.6%: $3,285 (Current area of interest)
* **Fibonacci Extensions (Downside Targets):**
* 127.2%: $3,245
* 161.8%: $3,195
* 261.8%: $3,095
* **Time-Based Fibonacci:**
The next significant time cluster is July 2-3, 2025, with a major cycle completion expected around July 15-17, 2025.
**Institutional Levels & Volume Analysis:**
* **Key Institutional Levels:**
* Major Resistance: $3,400 (psychological + institutional)
* Secondary Resistance: $3,350-$3,375 (order block cluster)
* Primary Support: $3,250-$3,270 (institutional accumulation zone)
* Major Support: $3,200 (monthly pivot area)
* **Volume Profile Analysis:**
* High Volume Node (HVN): $3,320-$3,340 (fair value area)
* Low Volume Node (LVN): $3,280-$3,300 (potential acceleration zone)
* Point of Control (POC): Currently around $3,330
**Central Bank & Hedge Fund Levels:**
Based on recent COT data and institutional positioning, heavy resistance is seen at $3,400-$3,430, where institutions likely distributed. An accumulation zone for "smart money" re-entry is anticipated at $3,200-$3,250.
**Cycle Timing Analysis:**
* **Short-Term Cycles (Intraday):**
Bearish momentum is expected to continue for another 12-18 hours. A daily cycle low is likely between June 29-30, with a potential reversal zone on July 1-2 for the 3-day cycle.
* **Medium-Term Cycles:**
The current weekly cycle is in week 3 of a 4-week decline. The monthly cycle indicates a mid-cycle correction within a larger uptrend. For the quarterly cycle, Q3 2025 could see a major low formation.
* **Seasonal Patterns:**
July-August is typically a weaker period for gold ("Summer Doldrums"). September has historically been strong for precious metals ("September Effect"), setting up for a potential major move higher in Q4 2025 ("Year-End Rally").
**Trading Strategy & Levels:**
* **Bearish Scenario (Primary):**
* Entry: Sell rallies into the $3,320-$3,350 resistance zone.
* Targets: $3,250, $3,200, $3,150.
* Stop Loss: Above $3,380.
* **Bullish Scenario (Secondary):**
* Entry: Buy support at $3,250-$3,270 with confirmation.
* Targets: $3,320, $3,375, $3,400.
* Stop Loss: Below $3,230.
**Key Events to Watch:**
* **US PCE Data:**
Fresh downside risks could emerge ahead of the US Personal Consumption Expenditures (PCE) Price Index data release.
* **Fed Communications:**
Any hawkish rhetoric from the Federal Reserve could further pressure gold.
* **Geopolitical Developments:**
Ongoing global events could trigger safe-haven demand.
**Conclusion:**
The technical picture for gold suggests continued short-term weakness, with the metal testing its 2025 trend line at $3,290 following last week's rejection at the $3,430 resistance. However, the longer-term outlook remains constructive, given gold's robust performance year-to-date. Key support at $3,250-$3,270 will be crucial in determining the next significant price movement.
**Upcoming Week's Economic Calendar (June 29 - July 4, 2025):** 🗓️🌍
🗓️ Get ready for these important economic events (EDT)
* ** Sunday , June 29, 2025**
* 21:30 CNY: Manufacturing PMI (Jun) - Forecast: 49.6, Previous: 49.5
* ** Monday , June 30, 2025**
* 09:45 USD: Chicago PMI (Jun) - Forecast: 42.7, Previous: 40.5
* ** Tuesday , July 1, 2025**
* 05:00 EUR: CPI (YoY) (Jun) - Forecast: 2.0%, Previous: 1.9%
* 09:30 USD: Fed Chair Powell Speaks
* 09:45 USD: S&P Global Manufacturing PMI (Jun) - Forecast: 52.0, Previous: 52.0
* 10:00 USD: ISM Manufacturing PMI (Jun) - Forecast: 48.8, Previous: 48.5
* 10:00 USD: ISM Manufacturing Prices (Jun) - Forecast: 70.2, Previous: 69.4
* 10:00 USD: JOLTS Job Openings (May) - Forecast: 7.450M, Previous: 7.391M
* ** Wednesday , July 2, 2025**
* 08:15 USD: ADP Nonfarm Employment Change (Jun) - Forecast: 80K, Previous: 37K
* 10:30 USD: Crude Oil Inventories - Forecast: -5.836M
* ** Thursday , July 3, 2025**
* Holiday: United States - Independence Day (Early close at 13:00) 🇺🇸⏰
* 08:30 USD: Average Hourly Earnings (MoM) (Jun) - Forecast: 0.3%, Previous: 0.4%
* 08:30 USD: Initial Jobless Claims - Forecast: 239K, Previous: 236K
* 08:30 USD: Nonfarm Payrolls (Jun) - Forecast: 129K, Previous: 139K
* 08:30 USD: Unemployment Rate (Jun) - Forecast: 4.2%, Previous: 4.2%
* 09:45 USD: S&P Global Services PMI (Jun) - Forecast: 53.1, Previous: 53.1
* 10:00 USD: ISM Non-Manufacturing PMI (Jun) - Forecast: 50.3, Previous: 49.9
* 10:00 USD: ISM Non-Manufacturing Prices (Jun) - Forecast: 68.7
* ** Friday , July 4, 2025**
* All Day: Holiday - United States - Independence Day 🎆
**Gold Price Forecast for the Coming Week** 🔮💰
Given last week's market movements, there's a strong likelihood that the downward trend in gold prices will continue.🔽 However, fresh news can always flip the script! 🔄 As of now, I expect gold to dip further to $3255 by mid-next week. Yet, a brief rebound towards $3300 isn't out of the question before a potential drop to $3200 by week's end or early the following week. 🤞
Please take the time to let me know what you think about this. 💬
-------------------------------------------------------------------------
This is just my personal market idea and not financial advice! 📢 Trading gold and other financial instruments carries risks – only invest what you can afford to lose. Always do your own analysis, use solid risk management, and trade responsibly.
Good luck and safe trading! 🚀📊
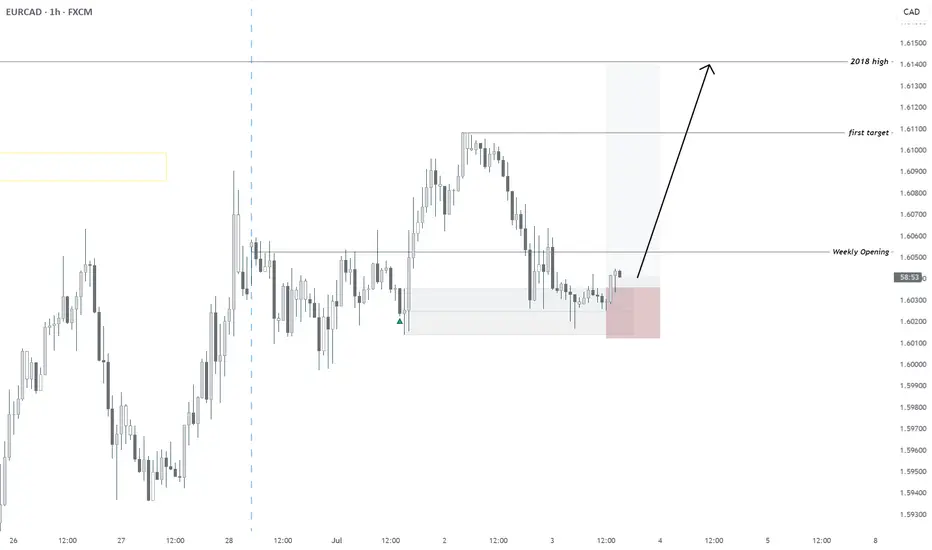
07/02/2025 | EURCAD | BULLISH - REACHING MULTI-YEAR HIGHDaily FX Outlook today:
All timeframes Bullish
Invalidation: 1.60055
First TP: on chart
Second: 2018 High