ETH - is it time for a correction?ETH is starting to look over-bought.
Price is currently hovering around a strong intersection between the orange supply zone and the upper red trendlines. This is not just any resistance, it’s a zone where momentum has historically cooled off.
As long as this area holds, a bearish correction is expected, with price likely rotating back toward the lower blue trendlines, where buyers previously stepped in.
This doesn’t change the bigger picture... it’s simply a reset within structure.
⚠️ Disclaimer: This is not financial advice. Always do your own research and manage risk properly.
📚 Stick to your trading plan regarding entries, risk, and management.
Good luck! 🍀
All Strategies Are Good; If Managed Properly!
~Richard Nasr
Overbought

GBPUSD - Right Into Resistance… Again!GBPUSD is now trading at a very important intersection.
Price is pressing right into the upper red trendline, while also sitting inside the green resistance zone. This is not a random area... it’s a level that has already rejected price multiple times in the past.
From a bigger-picture perspective, the structure remains overall bearish, with price still respecting the descending channel. The recent push higher looks more like a corrective move rather than a true trend reversal.
As long as this trendline + resistance intersection holds, my focus stays clear:
I’ll be looking for trend-following shorts, preferably after lower-timeframe confirmation and signs of bearish control.
Only a strong and clean break above this zone would force a reassessment. Until then, sellers still have the edge.
⚠️ Disclaimer: This is not financial advice. Always do your own research and manage risk properly.
📚 Stick to your trading plan regarding entries, risk, and management.
Good luck! 🍀
All Strategies Are Good; If Managed Properly!
~Richard Nasr

GBPUSD - Bears Loading at a Major Confluence???⚔️GBPUSD is approaching a powerful intersection where the upper blue trendline meets the green supply zone. This area has acted as a strong barrier before, and price is now retesting it from below.
📉If this confluence holds, the bearish pressure is likely to kick back in. As long as the rejection is confirmed, we will be looking for trend-following shorts, with the next objective being the lower bound of the rising channel, where buyers may attempt to step in again.
A very clean and technical setup, now we wait for confirmation. 📉🔥
What do you think, will the supply zone hold, or will GBPUSD break higher this time? 👀
⚠️ Disclaimer: This is not financial advice. Always do your own research and manage risk properly.
📚 Stick to your trading plan regarding entries, risk, and management.
Good luck! 🍀
All Strategies Are Good; If Managed Properly!
~Richard Nasr

Potential Downside Short-term - Long Term EntriesCOINBASE:BTCUSD has broken below the ascending channel that has held for several months, indicating a possible shift in momentum from bullish to bearish. BITSTAMP:BTCUSD is overbought on the RSI and broke below it's 200-day EMA as well. I'll certainly be adding to my long-term position on the way down and will likely grab a long position at some point- will post an update then. Until then, some RSI-based supply and demand zones to keep an eye on, watching closely

CADJPY - Overbought at Resistance… Correction Ahead?⚔️CADJPY is approaching a major rejection zone around 111.00 , which aligns perfectly with the upper bound of the rising channel. Price is also showing clear overbought behavior, making this area a critical decision point for the next move.
For now, the pair remains overall bullish, trading inside a clean ascending structure. However, the current location leaves CADJPY vulnerable to a corrective move as long as the 111.00 resistance continues to hold.
If the bulls manage to break and hold above 111.00, the momentum could extend toward higher highs. But if the resistance rejects price again, we can expect a move back toward the lower trendline of the channel to reset the structure.📉
The market is now at a key inflection zone… will 111.00 act as a ceiling or fuel the next breakout? 🤔
⚠️ Disclaimer: This is not financial advice. Always do your own research and manage risk properly.
📚 Stick to your trading plan regarding entries, risk, and management.
Good luck! 🍀
All Strategies Are Good; If Managed Properly!
~Richard Nasr.

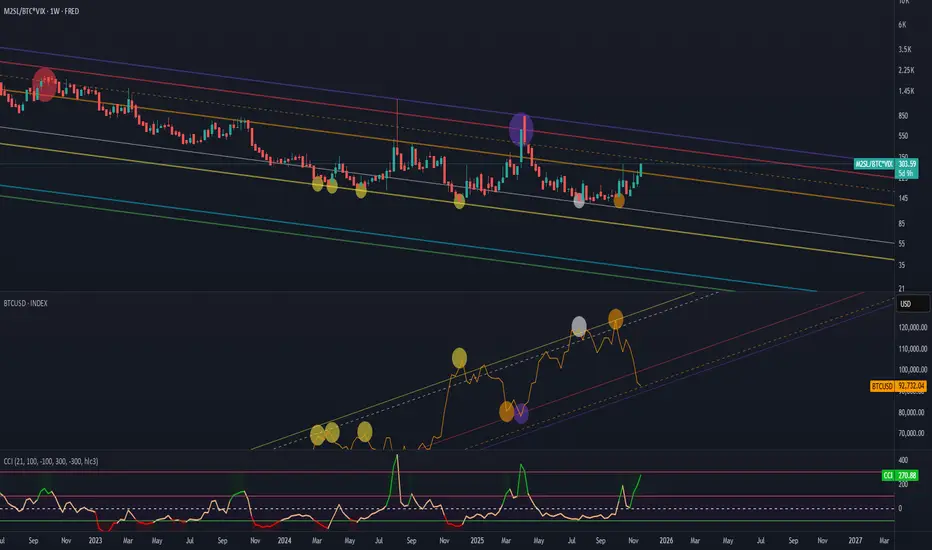
Liquidity (M2) to BTC.D, amplified by (VIX) FEARIt shows the ratio of global liquidity (M2) to Bitcoin’s market capitalization, amplified by market fear (VIX), relative to BTCUSD.
Thanks to this formula, we have an understanding of which phase of the market we are currently in.
In this case the CCI indicator shows:
overbought conditions — meaning money is outside the market and
oversold conditions — meaning there is too much money in the market and it’s time to sell
FRED:M2SL/CRYPTOCAP:BTC*TVC:VIX
For some reason the Bitcoin chart isn’t displaying with all the markings, so I’ll attach a screenshot below.
JP Morgan says EURCHF oversold --- Could target 0.96 on rebound?JP Morgan sees the surge in the Swiss franc as not justified. According to JP Morgan, the Eurozone economy is holding up better than markets had anticipated. Under this environment, JP Morgan believes the current EUR/CHF levels present an opportunity to fade franc strength and rebuild long positions.
If the pair does rebound from current levels, the first area of interest could be 0.9350, followed by 0.9450, where prior swing highs and short-term structure converge. A more sustained recovery could bring the pair back toward 0.9600–0.9700, a major resistance band that has capped every rally over the past year.

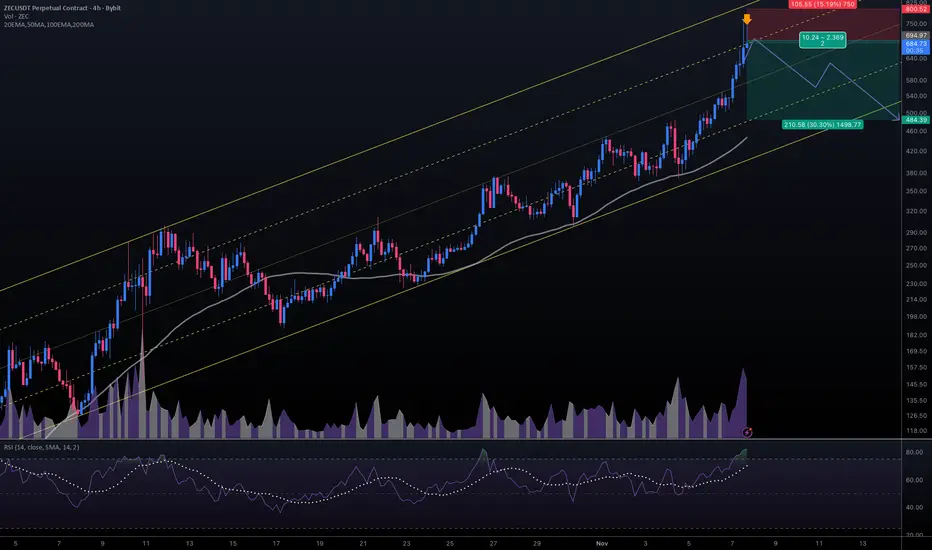
#ZECUSDT #4h (ByBit) Ascending channel on resistance [SHORT]Zcash just printed a shooting star and entered overbought territory again.
It seems likely to finally retrace down towards 50MA support, short-term.
⚡️⚡️ #ZEC/USDT ⚡️⚡️
Exchanges: ByBit USDT
Signal Type: Regular (Short)
Leverage: Isolated (3.0X)
Amount: 4.4%
Current Price:
684.73
Entry Targets:
1) 694.97
Take-Profit Targets:
1) 484.39
Stop Targets:
1) 800.52
Published By: @Zblaba
CRYPTOCAP:ZEC BYBIT:ZECUSDT.P #4h #Privacy #ZK z.cash
Risk/Reward= 1:2.0
Expected Profit= +90.9%
Possible Loss= -45.6%
Estimated Gaintime= 1 week
What's the point of buying now ?Gold is overbought at levels which is basically not seen in modern history. Being long right now makes no sense. I'm personally short.
Disclaimer: I've been a gold bug all these years

CADJPY - The Trio Retest Setup!📈CADJPY has been on a strong bullish run lately, but price is now approaching a critical confluence zone, the perfect Trio Retest Setup.
The red circle highlights the intersection of two upper trendlines (the rising channel and the short-term wedge) together with a major horizontal resistance at 111.00.
⚔️This trio intersection creates a powerful technical barrier, suggesting that the pair is overbought in the short term. From here, I’ll be looking for signs of exhaustion or reversal patterns to catch the next corrective leg down.
🔎A potential retracement could send CADJPY back toward the 106.00–105.00 support zone, which also aligns with the lower boundary of the main ascending channel.
Until the trio zone is broken decisively to the upside, the bears might step in to cool off the momentum.
⚠️ Disclaimer: This is not financial advice. Always do your own research and manage risk properly.
📊All Strategies Are Good; If Managed Properly!
~Richard Nasr

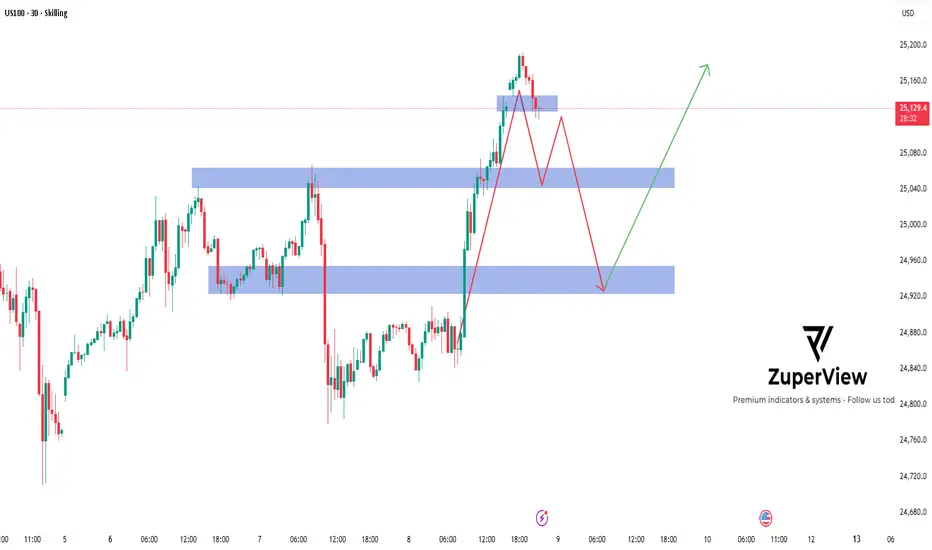
US100: Potential reversal from overbought zone
Symbol: SKILLING:US100
Timeframe: 30 Minutes
Indicators: OB/OS Overlap (RSI, MFI, Stochastic) + S/R
________________________________________
🔍 Quick Summary
After a strong rally 🚀 from the 24,750–24,800 support area, US100 has reached the 25,280–25,300 resistance zone — where multiple oscillators are showing overbought signals.
This suggests potential profit-taking or a technical correction may occur soon.
________________________________________
📊 Price Structure
• Price formed a temporary top after tapping the overbought area, with clear rejection candles near resistance.
• A pullback toward the first support zone around 25,000–25,050 could occur before the next move.
• If selling pressure continues, the next target area lies near 24,800–24,850, where previous structure and demand overlap 📉.
________________________________________
🧩 Technical Highlights
• OB/OS Overlap: RSI, MFI, and Stochastic are all in overbought territory (3/3 alignment) — a strong early signal of potential short-term exhaustion.
• Price Action: A minor double top or bearish divergence may be forming if momentum indicators continue to decline.
• Key Zones: Blue zones on the chart mark areas of potential buyer reaction (demand).
________________________________________
🧭 Scenario Outlook
Main Scenario (🔻 Pullback Expected):
Price could retrace toward 25,000–24,850 before buyers attempt a rebound.
Alternative Scenario (🚀 Continuation):
If the price holds above 25,100 and breaks 25,280, the bullish momentum might continue short-term.
________________________________________
⚙️ Risk Note
This analysis is for educational purposes only and not financial advice.
Always manage risk carefully and align your trade plan with your own strategy 📘💡.
Market conditions can change rapidly — stay flexible and objective!
Please like and comment below to support our traders. Your reactions will motivate us to do more analysis in the future 🙏✨
Harry Andrew @ ZuperView
NZDJPY – Retesting Upper Channel: Looking for Shorts!NZDJPY remains inside a falling channel on the 4H.
Price just spiked back into the upper trendline / supply (87.40–87.80), where sellers have reacted before.
As long as this red zone holds, I’ll look for lower-high + break-of-structure sell setups toward 86.30, then the 85.40–85.00 channel low.
A clean 4H close above ~88.00 would invalidate the idea and open room for 88.70–89.00.
⚠️ Disclaimer: This is not financial advice. Always do your own research and manage risk properly.
📚 Stick to your trading plan regarding entries, risk, and management.
Good luck! 🍀
All Strategies Are Good; If Managed Properly!
~Richard Nasr

oct 6: tp hit xDoct 6: tp hit xD
hell yeah brother.
well, I guess the strategy was applied anyway.
and the FRVP helped, maybe?
Sweep + Low Volume Node + OTE + FVG, among the other confluences on my checklist.
What I could have done better on this trade though... was not enter prematurely. in that way, I could have put my 2RR TP above the "TARGET" liquidity. Because as you can see, price swept the target liquidity, and then reversed immediately.
Only by strong orderflow was price able to go lower again. But if it wasn't for this, price would have reversed and hit my SL.
check one of my previous trades, I have this described there in more detail.
everything on this trade is perfect besides my TP point. and maybe my entry, it was kinda rushed ngl.
AUDJPY — Buy the Retest?AUDJPY remains overall bullish inside a rising channel. Price is hovering above a 96.0–96.5 support zone, which previously acted as resistance and now aligns with the channel’s lower boundary, a solid confluence area.
🔑 Key levels
Support: 96.0–96.5 (zone to watch for bullish rejection)
Resistance: 98.5 then 100.0 (round number / channel upper band)
📊 Scenarios
Bullish 📈 If price retests 96.0–96.5 and prints confirmation (higher low / bullish candle), I’ll look for longs toward 98.5 → 100.0.
Bearish 📉 A daily close below 96.0 would invalidate the setup and open room toward the next liquidity pocket near the channel low.
What’s your plan here => wait for the retest into 96s, or trade the continuation if momentum kicks in first? 🤔
⚠️ Disclaimer: This is not financial advice. Always do your own research and manage risk properly.
📚 Stick to your trading plan regarding entries, risk, and management.
Good luck! 🍀
All Strategies Are Good; If Managed Properly!
~Richard Nasr

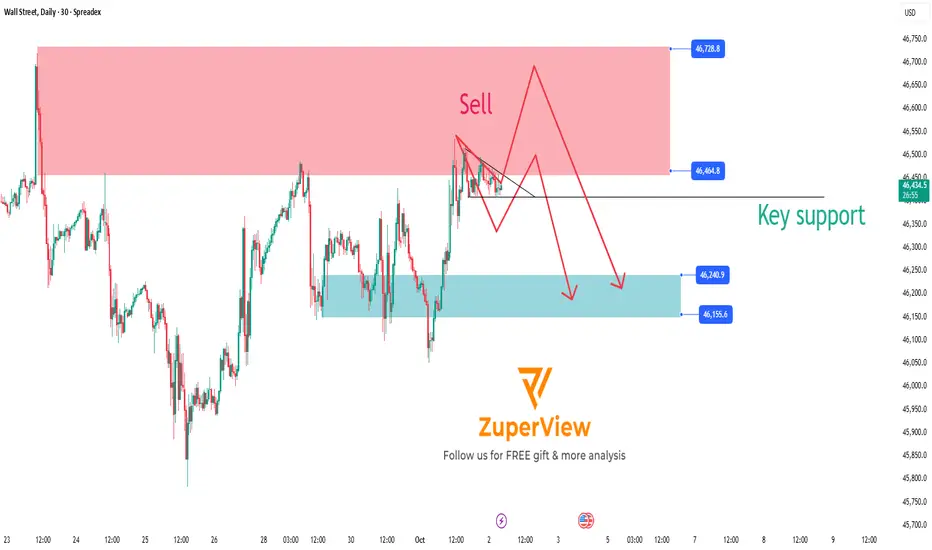
US30: Key support breakdown signals potential sell opportunity
1. Current Market Overview 🌐
The SPREADEX:DJI index is approaching a significant resistance zone where selling pressure is expected to be strong. The price is currently consolidating and moving sideways around this area, preparing for a major move.
2. Technical Signals and Momentum Indicators 📊
Momentum indicators such as MFI, RSI, and Stochastic have all entered the oversold territory, while also showing signs of price compression (consolidation), indicating the market is waiting for the next breakout.
The strong resistance zone and the Overbought/Overextended (OB/OS) signals suggest that buying pressure is weakening, which is favorable for sellers.
3. Sell Scenario on Key Support Breakdown 🔻
If the price breaks below the important Key Support level shown on the chart, this will confirm the beginning of a downtrend.
Traders can consider opening sell positions as soon as the breakout occurs to take advantage of the downward momentum.
The price target is expected to move toward lower support zones where buying interest may emerge to cause a price correction.
4. Risk Management ⚠️
Place stop-loss orders above the resistance zone or the nearest recent highs to protect against unexpected market moves.
Adjust your position size according to your risk tolerance.
5. Conclusion 🔑
The sell setup on US30 is very clear with a strong resistance zone and momentum signals indicating a potential upcoming downtrend.
Main scenario: Breaking the Key Support will trigger a strong decline, providing a profitable trading opportunity for sellers.
Wait for a confirmed support break before entering the trade to ensure safety and effectiveness.
Please like and comment below to support our traders. Your reactions will motivate us to do more analysis in the future 🙏✨
Harry Andrew @ ZuperView
oct 1: SHORT TERM SELL oct 1: SHORT TERM SELL
- ngl price action seems trash...
- all bullish targets but price is consolidating.
- put up a sell limit just in case it gets hit.

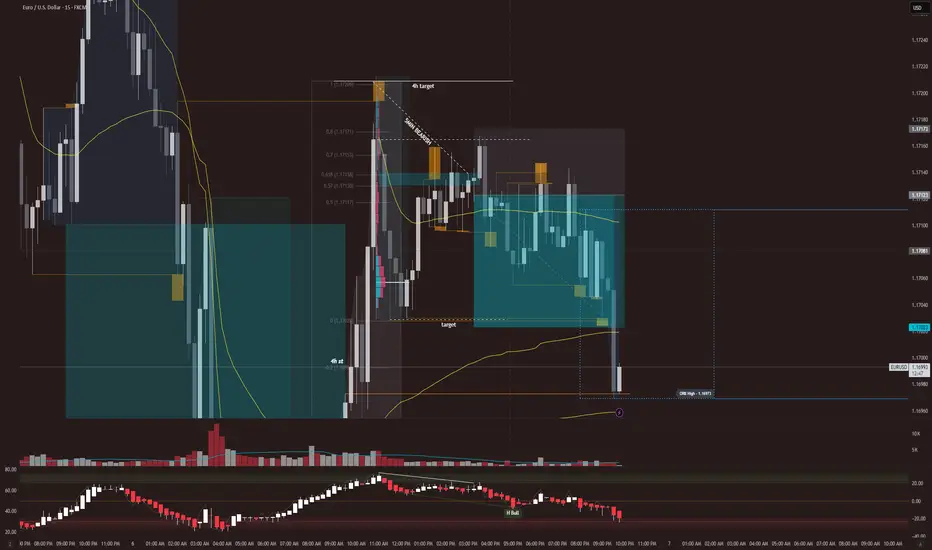
First Time Losing... That The Reason is ObviousFirst Time Losing... That The Reason is Obvious
I feel like this is a good losing trade.
I basically won.
Figured out the market bias correctly, found the target liquidity, and the narrative(POI) to get there.
1H POI, 1H TARGET, Bearish Orderflow, BSL Sweep, Divergence, Overbought, and entered on the 5min FVG after the sweep.
All criteria for entry are aligned.
Price went to where I expected it to, with momentum.
The only mistake?
Setting the take profit point farther than the 1H TARGET LIQUIDITY.
That's it.
After it hit that liquidity, price really just moved uptrend with momentum.
I've read some comment on youtube that said, “Price seeks liquidity, and once that liquidity is filled, it rebalances back to equilibrium.” or some shit like that honestly it was such an awesome quote that i remembered the meaning of it(very rare). The exact wording, I forgot.
well, that's it.
Honestly, this might seem obvious to you, but this is such a big step for me.
I used to NOT KNOW why my trades were losing. Like, what am I doing wrong, is the strategy wrong, should i find another strategy, should i switch to elliot wave, etc etc lmfao.
But now... the fact that I immediately knew what was wrong with my trade, and the fact that only one thing was wrong and is easily fixable in the next trade... is such a breakthrough for me.
Well, thanks for listening to my TedTalk.
$Btc Turning PointBitcoin has bounced from its lower low and is now pressing toward the upper wall, but here’s the catch — it still hasn’t printed a higher high. The market seems to be preparing for a potential higher low formation, yet the RSI slipping from the overbought zone hints at profit-taking.
What does this mean? If CRYPTOCAP:BTC confirms a new lower high and holds, we could witness a push upward as buyers regain control. But if that setup fails and a fresh lower low forms, a clear bearish phase might kick in. The coming sessions will reveal whether Bitcoin is setting up for a healthy continuation or a deeper downturn.
Keep a close watch — this zone could define the next big move.
#Bitcoin #CryptoMarket #BTCAnalysis #TradingView

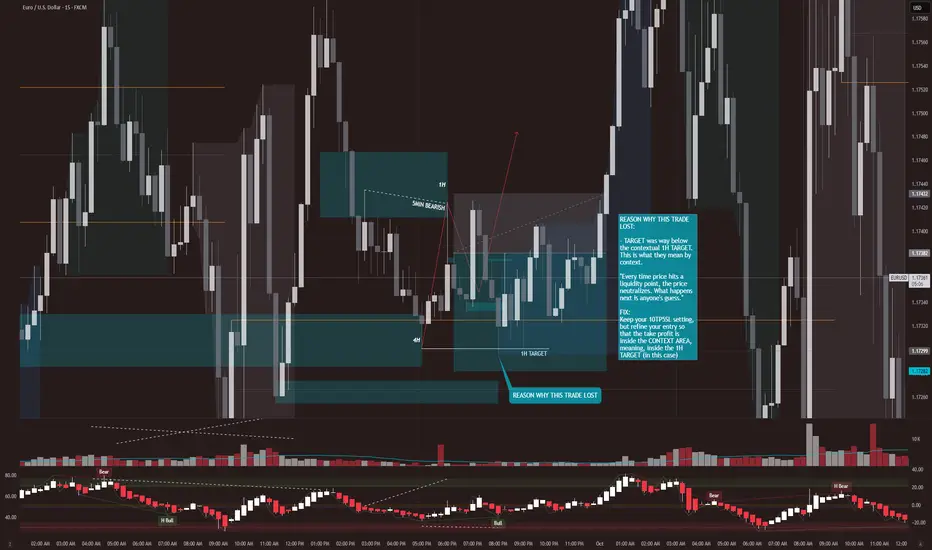
SEPT 26: PRICE GOES DOWN TO 4H FVG BEFORE COMING UP AGAINSEPT 26: PRICE GOES DOWN TO 4H FVG BEFORE COMING UP AGAIN
I think price is going up more until a HTF POI is hit.
It has to come down first to a bullish 4h FVG so i entered short once my criteria for entry has appeared(sweep, divergence, overbought, reversal candle+engulfing candle).
Let's see how it goes.

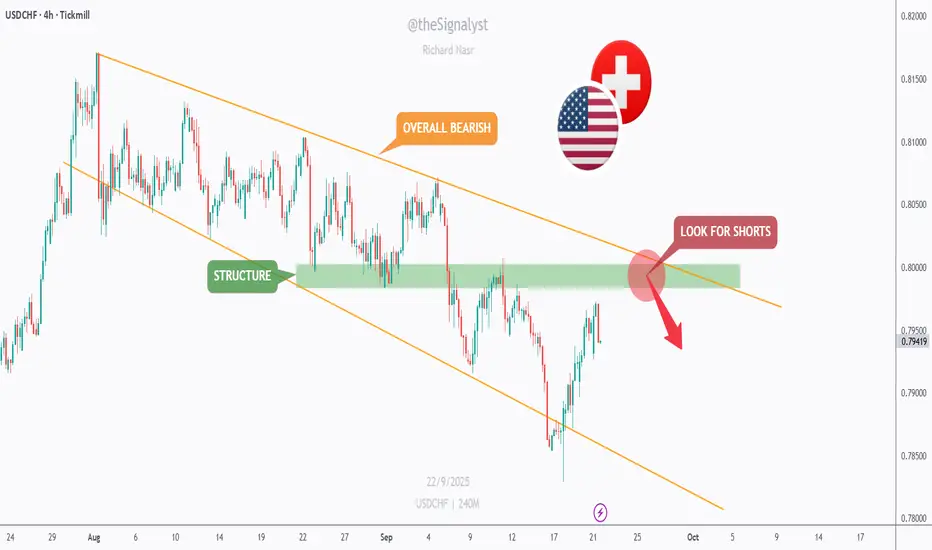
USDCHF — Rally Into Structure, Short the Retest?USDCHF has been overall bearish on the 4H, sliding inside a falling channel. After a bounce, price is rotating back into the 0.798–0.802 structure zone, right at the channel’s upper bound.
This confluence is key 🔑. If sellers react here, I’ll look for rejection shorts toward 0.790 first, then 0.785–0.780 near the channel floor. A clean 4H close and hold above 0.802 would invalidate the idea and expose 0.806–0.810 next ⏳.
What’s your plan => fade the rally at supply, or wait for confirmation before jumping in? 🤔
⚠️ Disclaimer: This is not financial advice. Always do your own research and manage risk properly.
📚 Stick to your trading plan regarding entries, risk, and management.
Good luck! 🍀
All Strategies Are Good; If Managed Properly!
~Richard Nasr
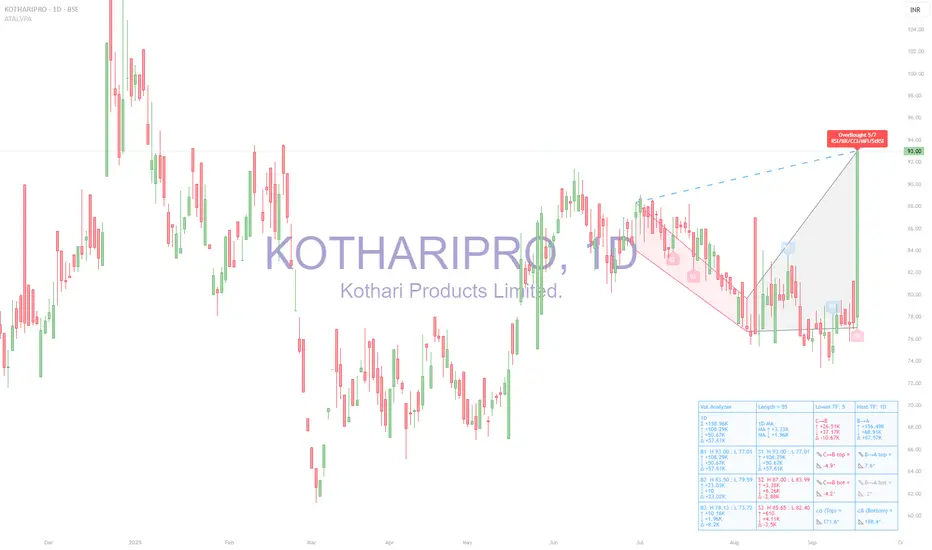
KOTHARIPRO (BSE: 1D) — Volume Pressure Analyzer | OB 5/7 Tool used
Analysis made with ATAI Volume Pressure Analyzer (VPA), which decomposes daily flows into buy/sell volume, prints half-window deltas (C→B vs B→A), ATR-normalized wing slopes, α/β geometry at vertex B, and OverBought/OverSold spike labels confirmed by a 7-oscillator vote
1) Snapshot from HUD
◉ OB 5/7 fired on today’s +20% candle (RSI/Stoch/CCI/MFI/StRSI cluster).
◉ C→B (earlier half): Δ −14.21 → seller-tilted.
◉ B→A (recent half): Δ +72.25K → buyers in control.
◉ Angles: C→B wing both <0° (down), B→A wing both >0° (up).
◉ α=171.6°, β=188.4° → no red flags (thresholds are α>180 or β<180).
◉ Ranked zones:
- B1 High 93.0 / Low 77.0 (resistance)
- S1 Low 83.9 (support)
2) Interpretation
◉ The OB 5/7 tag warns of short-term exhaustion after an impulsive surge.
◉ Yet the right wing (B→A) shows positive deltas and slopes, meaning structure still favors buyers.
◉ No α/β stress flags, so the geometry is not “over-stretched.”
◉ The zone map is clean: B1 = resistance (93.0) and S1 = first support (83.9).
3) Scenarios
A) Base case — Pullback / Digestion
◉ Likely reaction into the S1 zone (≈84–87) after OB tag.
◉ Watch Δ(B→A): if it fades to ≤0 and wings flatten, pullback deepens.
B) Bullish continuation
◉ Requires daily acceptance above 93 with a buy-spike (TF_buy / SMA ≥1.6 or Z≥1.8).
◉ Validation = B→A Δ stays >0 and right wing >0°.
C) Bearish rotation
◉ Triggers if B→A Δ flips negative and right wing turns gray/red.
◉ Breakdown below 83.9 on a sell-spike would confirm shift.
4) Conclusion
Bias: Constructive with pullback risk.
◉ Immediate OB tag suggests a pause; however, the buyer regime in the recent half (B→A) is still active.
◉ Key invalidation = loss of 83.9 (S1) with negative Δ.
◉ Key confirmation = acceptance above 93 with buy-spike absorption.
The points above are the technical and educational details from the ATAI Volume Pressure Analyzer (VPA). Put simply, the takeaway is this:
The stock made a sharp +20% move today up to 93, and the indicator flagged an “OverBought” condition. That means buying pressure was unusually strong and the market may need to cool off with a pause or short pullback. Still, the recent volume balance shows buyers remain in control, so the broader structure is still constructive.
If price can hold above 93 with renewed strong buy-side volume, continuation to the upside is favored. But if it slips below 84 and selling pressure grows, that would mark the start of a deeper correction. In simple terms: the main trend is still positive, but after today’s surge it makes sense to expect some digestion before the next leg.
EURUSD - Already Overbought!Hello TradingView Family / Fellow Traders. This is Richard, also known as theSignalyst.
📈EURUSD has been overall bullish trading within the rising channel marked in blue.
However, it is currently retesting the upper bound of its channel.
Moreover, the green zone is a strong resistance.
🏹 Thus, the highlighted red circle is a strong area to look for sell setups as it is the intersection of the upper blue trendline and green resistance.
📚 As per my trading style:
As #EURUSD approaches the red circle zone, I will be looking for bearish reversal setups (like a double top pattern, trendline break , and so on...)
📚 Always follow your trading plan regarding entry, risk management, and trade management.
Good luck!
All Strategies Are Good; If Managed Properly!
~Richard Nasr

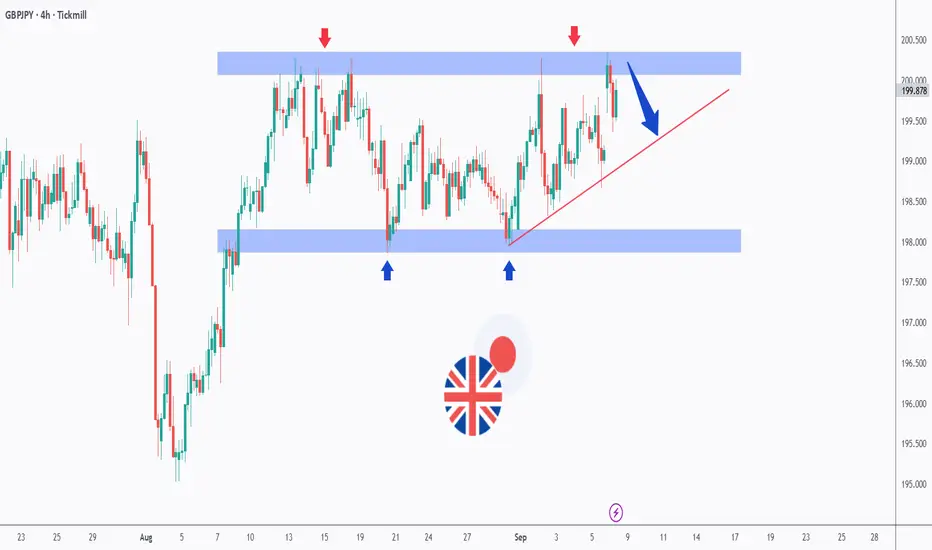
GBPJPY – Testing the Range Once AgainGBPJPY has been stuck in a wide range between 198.00 (support) and 200.50 (resistance) for several weeks now.
🔻 Sellers continue to defend the upper boundary (red arrows).
🔹 Buyers are stepping in around the 198.00 demand zone (blue arrows).
📈 Price is currently rejecting the resistance area once more while also sitting above the rising trendline (red).
If the resistance holds, we could see a rejection toward the lower bound of the range. On the other hand, a clean breakout above 200.50 would be needed for bulls to take full control. 🚀
This setup makes GBPJPY one of the key pairs to watch in the coming days.
Disclaimer:
This analysis is for educational purposes only and does not constitute financial advice. Always do your own research and follow your trading plan before making any investment decisions.
📚 Stick to your trading plan regarding entries, risk management, and trade execution.
Good luck!
All Strategies Are Good; If Managed Properly!
~Richard Nasr