Be prepared to short a cross over of the MACD on Nasdaq Futures.In spite of all major economic indicators showing a rapid decay of conditions and inflation showing no signs of letting up, the market continues its rally, now into its 7th week. Nasdaq investors seem particularly focused on buying, even under selloff pressure. This is what I call a zombie market. It's hard to wrap ones head around why the market continues higher, except to recognize too much liquidity in the market and stock purchases made in desparation, for lack of a better word.
With consumer sentiment at all time lows, and concerns within the market, this market is setting itself up for a rapid downward move to the lows. Be cautious and wait for the MACD to cross, before you look for your set up to short. In the mean time, I would wait for a one day pullback to relieve the overbought condition and go long, using stops to make sure you're not caught in a huge plummet downward, which can come at any time in my opinion.
If you do not use the MACD, an approximation would be 3 consecutive closes down and a failed rally on the daily to short.
Note: We are in a bull market, regardless what the news says every day. its contrary to what makes sense. I would not recommend any long position, other than intraday trading with stops. This market will resume the down trend eventually, unless by some miracle, the economy recovers.
Overbought

Does WING's Earnings Bounce Have Legs?WING has been an interesting story in the restaurant sector over the past 7 years. Wingstop has experienced above-average growth in both top and bottom line figures over this timeframe. Let us explore why this is the case and where the stock may go from here...
Fundamentals: WING's fundamentals are nightmarish. Incredibly high levels of debt (likely why WING has been able to expand so quickly), negative stockholders equity, 17% of shares float are short, a forward P/E of 70, yoy revenue beginning to stall with current year-end revenue expectations up only 2-3% from 2021 year-end. WING's total liabilities make up more than double its total assets. The company is grossly overvalued, Wingstop's intrinsic value is roughly 35-45 dollars a share. This bounce off of earnings is unsustainable, to say the least. The company did not even post a beat, and its shares surge 20%... this move simply does not make sense.
Technicals: Long-term uptrend still intact. This will change if a move below the A trend line occurs. Currently, WING is struggling to break above the short-term bearish trend line labeled as B . A touch at 128.43 resistance and a quick retreat back to trend line B leads me to believe this is a temporary bull run in what is a longer-term downtrend for WING.
Global macro conditions: Tightening of financial conditions, supply chain woes, war, sanctions, Supply crunches in energy commodities, climate crises, hot inflation, political unrest, and sovereign default concerns intensifying -along with other factors- all play a role in a rapidly worsening macroeconomic narrative. These factors are often talked about by economists but I fear they are overlooked in cases such as these when the market rewards a weak growth stock such as WING with a massive bounce in price off of an average earnings report, all during an unprecedentedly difficult global economy.
Targets: Unclear as to when WING will significantly fall in price. I think the deterioration of financial markets over the next few years will be serious- things will get worse and stay worse for longer than expected- and companies with trash fundamentals like WING will be the first to suffer. Needless to say, I would be short WING if given an option. I see a fall to 113.92 as a short-term lock. Longer term I expect a choppy downward trade from lower support levels to lower support levels eventually forming fresh lows at the 49.89 support level. Seems like a bit of a wild prediction I'm sure, but this is what I see.
As always this is not trading advice, good luck!

Harmonic Cypher Perfects at Gapfill 4018The gap must fill. Short not until it does imo. Measured Move projected with price bands, +302 pips for a 1:1 move.
Gap may fill Friday. Expect weakness before FOMC, then a stupid bullup as follows:
7/27 1400 rate decision; initial ludicrous pop followed within minutes by a selloff. Price declines until ~1425 in falling wedge.
At ~1428 EST J Powell will step up to the mic and make soothing comments.
Irrational mad bullishness follows, rising price in giant arc up to close.
Thursday after the hike could turn into a bloodbath. Last time bad news was so good they bought it next day.
This time, who knows? Don't get caught short in these nutty rallies.
The Shark Cypher is a giant W with right leg taller than left. Other variants include crab, nenstar, etc;
nomenclature based on leg heights.
It is a BEARISH construct which usually leads to lower prices after break from right leg. There is the short entry.
Included RSI, Stoch and Stoch/RSI indicators for comparision to each other, these are interesting.
All approaching overbought. Target: The gap to fill below at 3796. Price very unlikely to fall below lower BollBand imo.
This is STILL A BEAR MARKET; all rallies are setup for lower prices ahead, until proved otherwise.
IMO the LOTY is still not in; could be mistaken, let us see what madness transpires in October... GLTA!

Update For This WeekI tried to study the drop on July 22nd to determine if there were 13 waves for a corrective Minor wave 4 or if there were 21 waves for the first wave 1 in Primary wave 5 down. I saw the former more than the latter. If this is true, my previous forecasts are only off by 3 days and the levels to which they finish will remain with the exception of the wave 4 to wave 5 duration calculations.
If the markings on this chart are true, the market should leap up tomorrow. Consumer confidence numbers come out 30 minutes into the session, however, the data is delayed as it does not depict current consumer conditions. A jubilation of this reading could get us up to and above the current recent high of 4012. This would mean the final top would likely arrive before the Fed announcement on Wednesday at 2 pm eastern time.
This chart would be wrong and the complete prior forecast is valid if we drop below 3940 and then 3902. Tomorrow should tell us where we are heading this week. We should ultimately begin moving down toward 3400 by Friday.

LENNAR appears overboughtBased on historical movement, the peak could occur anywhere in the larger red box. The final targets are in the green boxes. The pending bottom should occur within the larger green box as has been the historical case. Half of all movement has ended in the smaller green box. In this instance, the signal indicated SELL on July 21, 2022 with a closing price of 82.08.
If this instance is successful, that means the stock should decline to at least 81.65 which is the top of the larger green box. Three-quarters of all successful signals have the stock decline 2.218% from the signal closing price. This percentage is the top of the smaller green box. Half of all successful signals have the stock decline 4.588% which is the end point of the black dotted arrow. One-quarter of all successful signals have the stock decline 7.85% from the signal closing price which is the bottom of the smaller green box. The maximum decline on record would see a move to the bottom of the larger green box. These are the same concepts for the levels in the red boxes as well.
The ends/vertical sides of the boxes are determined in a similar fashion. The trough of the decline can occur as soon as the next trading bar after signal close, while the max decline occurs within the limit of study at 40 trading bars after the signal. A 0.5% decline must occur over the next 40 trading bars in order to be considered a success. Three-quarters of successful movement occur after at least 11 trading bars; half occur within 23 trading bars, and one-quarter require at least 35 trading bars.
The black dotted arrow represents median historical movement. Medians are a good metric, but they are just one of many I use when forecasting future movement.
As always, the stock could decline the very next bar after the signal without looking back (therefore the red boxes would not come into play) or the stock may never decline (and the green boxes may never come into play).

BTCUSD 1H timeframe(TF) overbought? Accending triangle probably will continue Bull run if it manages to break the structure to the upper side. It can possibly be reaching overbought levels which will force BTCUSD to break the structure to the downside. In any case great trading opportunities!

I might be wrong, but I am bearish, fundamental Last time 1D RSI went this high we had a massive dump, furthermore we had a touch of top of bear flag, and you don't turn bear into bull (all these 20 to 30% pumps) into a few days or weeks, we still getting mt gox dump and the interest hikes

making money with Avaxusdt today!Avax gives you the chance to profit 20ish percent and make some cash! this is how you can short with less risk
God bless you

Opportunity to make some money Keep your eyes on matic in coming days. it's potentially ready to drops around 26% !
Invest with confident!

DXY Is Overbought! Sell!
Hello,Traders!
DXY is trading in a strong uptrend
But the index is super overbought at the moment
So IF we see a breakout of the horizontal key level
Then the price will go lower in the bearish correction
Sell!
Like, comment and subscribe to boost your trading!
See other ideas below too!

US OIL analyzehello everybody.
according to the technical analyze we can see the terminal trend in US oil.
and i think the trend in 1D timeframe become weak and i see a correction potential for that.
after we break out of disjoint channel that i draw on my chart we could have a pullback and after that
go down.
the first target for swing traders is around 93 94
and we can see a strengh support around 85-90 area like i illustrate in chart.
PCC(point of control)is in this area and we have the MA200 here too.
in addition longterm trendline is around this condition.
so we have 3 important levels and support in this area (85-90).
our momentum is in overbought level and going downward.
dont forget to put stoploss above the last major high.
(NOTE:friends this is my personal opinion and its not a trade suggestion.
please analyze in your own strategy and help me be better)
thank you all.

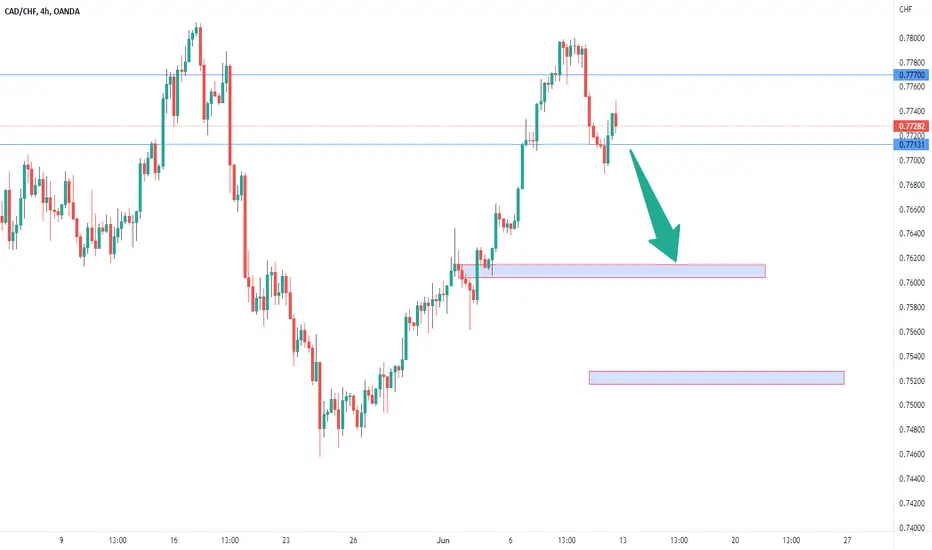
CADCHF SELLPrice has made a double top at the monthly resistance with bearish divergence on RSI.
We can expect a drop towards the monthly support with the initial target at the pivot highlighted on the chart.
DXY Short Term Massively Over Bought When DXY hit support on the bottom trend line, it has been pumping parabolically. Right now, it seems to have hit resistance and showing to be incredibly over bought on the RSI if it closes below the top trend line, we could expect a massive dump to occur for the rest of June. This could result in BTC to have that rally in June like we have been anticipating.

Soooooooo... CONTINUATION?! Or nah...I think everythings gonna keep moving the same way! I mean, AJ might've roc'd me a bit but that 200pip move on gold was saucy! EU did me som justice too. They also BLEW TF UP AGAIN! But, its not about trading all the time, its about trading well often ;)
So with that being said, make it do what it do my trading family!! Happy trading <3

CPS likely to continue downtrendBased on historical movement, the peak could occur anywhere in the larger red box. The final targets are in the green boxes. The pending bottom should occur within the larger green box as has been the historical case. Half of all movement has ended in the smaller green box. In this instance, the signal indicated SELL on June 3, 2022 with a closing price of 5.72.
If this instance is successful, that means the stock should decline to at least 5.675 which is the top of the larger green box. Three-quarters of all successful signals have the stock decline 2.502% from the signal closing price. This percentage is the top of the smaller green box. Half of all successful signals have the stock decline 4.91% which is the end point of the black dotted arrow. One-quarter of all successful signals have the stock decline 9.026% from the signal closing price which is the bottom of the smaller green box. The maximum decline on record would see a move to the bottom of the larger green box. These are the same concepts for the levels in the red boxes as well.
The ends/vertical sides of the boxes are determined in a similar fashion. The trough of the decline can occur as soon as the next trading bar after signal close, while the max decline occurs within the limit of study at 40 trading bars after the signal. A 0.75% decline must occur over the next 40 trading bars in order to be considered a success. Three-quarters of successful movement occur after at least 9.5 trading bars; half occur within 20.0 trading bars, and one-quarter require at least 34.0 trading bars.
The black dotted arrow represents median historical movement. Medians are a good metric, but they are just one of many I use when forecasting future movement.
As always, the stock could decline the very next bar after the signal without looking back (therefore the red boxes would not come into play) or the stock may never decline (and the green boxes may never come into play).

OLED looks overbought again, time for snapback?Based on historical movement, the peak could occur anywhere in the larger red box. The final targets are in the green boxes. The pending bottom should occur within the larger green box as has been the historical case. Half of all movement has ended in the smaller green box. In this instance, the signal indicated SELL on June 3, 2022 with a closing price of 124.42.
If this instance is successful, that means the stock should decline to at least 123.68 which is the top of the larger green box. Three-quarters of all successful signals have the stock decline 2.843% from the signal closing price. This percentage is the top of the smaller green box. Half of all successful signals have the stock decline 6.8475% which is the end point of the black dotted arrow. One-quarter of all successful signals have the stock decline 12.939499999999999% from the signal closing price which is the bottom of the smaller green box. The maximum decline on record would see a move to the bottom of the larger green box. These are the same concepts for the levels in the red boxes as well.
The ends/vertical sides of the boxes are determined in a similar fashion. The trough of the decline can occur as soon as the next trading bar after signal close, while the max decline occurs within the limit of study at 40 trading bars after the signal. A 0.5% decline must occur over the next 40 trading bars in order to be considered a success. Three-quarters of successful movement occur after at least 5.0 trading bars; half occur within 16.0 trading bars, and one-quarter require at least 31.5 trading bars.
The black dotted arrow represents median historical movement. Medians are a good metric, but they are just one of many I use when forecasting future movement.
As always, the stock could decline the very next bar after the signal without looking back (therefore the red boxes would not come into play) or the stock may never decline (and the green boxes may never come into play).

June swoon about to hit Starbucks stock?Based on historical movement, the peak could occur anywhere in the larger red box. The final targets are in the green boxes. The pending bottom should occur within the larger green box as has been the historical case. Half of all movement has ended in the smaller green box. In this instance, the signal indicated SELL on June 1, 2022 with a closing price of 76.28.
If this instance is successful, that means the stock should decline to at least 75.47 which is the top of the larger green box. Three-quarters of all successful signals have the stock decline 2.684% from the signal closing price. This percentage is the top of the smaller green box. Half of all successful signals have the stock decline 5.604% which is the end point of the black dotted arrow. One-quarter of all successful signals have the stock decline 13.653% from the signal closing price which is the bottom of the smaller green box. The maximum decline on record would see a move to the bottom of the larger green box. These are the same concepts for the levels in the red boxes as well.
The ends/vertical sides of the boxes are determined in a similar fashion. The trough of the decline can occur as soon as the next trading bar after signal close, while the max decline occurs within the limit of study at 35 trading bars after the signal. A 1% decline must occur over the next 35 trading bars in order to be considered a success. Three-quarters of successful movement occur after at least 6 trading bars; half occur within 14 trading bars, and one-quarter require at least 25 trading bars.
The black dotted arrow represents median historical movement. Medians are a good metric, but they are just one of many I use when forecasting future movement.
As always, the stock could decline the very next bar after the signal without looking back (therefore the red boxes would not come into play) or the stock may never decline (and the green boxes may never come into play).

NBHC about to correct with the rest of market?Based on historical movement, the peak could occur anywhere in the larger red box. The final targets are in the green boxes. The pending bottom should occur within the larger green box as has been the historical case. Half of all movement has ended in the smaller green box. In this instance, the signal indicated SELL on May 27, 2022 with a closing price of 40.89.
If this instance is successful, that means the stock should decline to at least 40.73 which is the top of the larger green box. Three-quarters of all successful signals have the stock decline 1.425% from the signal closing price. This percentage is the top of the smaller green box. Half of all successful signals have the stock decline 2.254% which is the end point of the black dotted arrow. One-quarter of all successful signals have the stock decline 3.606% from the signal closing price which is the bottom of the smaller green box. The maximum decline on record would see a move to the bottom of the larger green box. These are the same concepts for the levels in the red boxes as well.
The ends/vertical sides of the boxes are determined in a similar fashion. The trough of the decline can occur as soon as the next trading bar after signal close, while the max decline occurs within the limit of study at 50 trading bars after the signal. A 0.4% decline must occur over the next 50 trading bars in order to be considered a success. Three-quarters of successful movement occur after at least 7 trading bars; half occur within 24 trading bars, and one-quarter require at least 37 trading bars.
The black dotted arrow represents median historical movement. Medians are a good metric, but they are just one of many I use when forecasting future movement.
As always, the stock could decline the very next bar after the signal without looking back (therefore the red boxes would not come into play) or the stock may never decline (and the green boxes may never come into play).

Pending drop may not create a lower low for APAMBased on historical movement, the peak could occur anywhere in the larger red box. The final targets are in the green boxes. The pending bottom should occur within the larger green box as has been the historical case. Half of all movement has ended in the smaller green box. In this instance, the signal indicated SELL on May 26, 2022 with a closing price of 37.49.
If this instance is successful, that means the stock should decline to at least 37.28 which is the top of the larger green box. Three-quarters of all successful signals have the stock decline 2.643% from the signal closing price. This percentage is the top of the smaller green box. Half of all successful signals have the stock decline 4.675% which is the end point of the black dotted arrow. One-quarter of all successful signals have the stock decline 8.234% from the signal closing price which is the bottom of the smaller green box. The maximum decline on record would see a move to the bottom of the larger green box. These are the same concepts for the levels in the red boxes as well.
The ends/vertical sides of the boxes are determined in a similar fashion. The trough of the decline can occur as soon as the next trading bar after signal close, while the max decline occurs within the limit of study at 40 trading bars after the signal. A 0.5% decline must occur over the next 40 trading bars in order to be considered a success. Three-quarters of successful movement occur after at least 11 trading bars; half occur within 21 trading bars, and one-quarter require at least 33 trading bars.
The black dotted arrow represents median historical movement. Medians are a good metric, but they are just one of many I use when forecasting future movement.
As always, the stock could decline the very next bar after the signal without looking back (therefore the red boxes would not come into play) or the stock may never decline (and the green boxes may never come into play).

Marvell Technology appears to have set a bull trapBased on historical movement, the peak could occur anywhere in the larger red box. The final targets are in the green boxes. The pending bottom should occur within the larger green box as has been the historical case. Half of all movement has ended in the smaller green box. In this instance, the signal indicated SELL on May 27, 2022 with a closing price of 59.8.
If this instance is successful, that means the stock should decline to at least 59.55 which is the top of the larger green box. Three-quarters of all successful signals have the stock decline 1.956% from the signal closing price. This percentage is the top of the smaller green box. Half of all successful signals have the stock decline 3.897% which is the end point of the black dotted arrow. One-quarter of all successful signals have the stock decline 6.432% from the signal closing price which is the bottom of the smaller green box. The maximum decline on record would see a move to the bottom of the larger green box. These are the same concepts for the levels in the red boxes as well.
The ends/vertical sides of the boxes are determined in a similar fashion. The trough of the decline can occur as soon as the next trading bar after signal close, while the max decline occurs within the limit of study at 50 trading bars after the signal. A 0.4% decline must occur over the next 50 trading bars in order to be considered a success. Three-quarters of successful movement occur after at least 8 trading bars; half occur within 22 trading bars, and one-quarter require at least 43 trading bars.
The black dotted arrow represents median historical movement. Medians are a good metric, but they are just one of many I use when forecasting future movement.
As always, the stock could decline the very next bar after the signal without looking back (therefore the red boxes would not come into play) or the stock may never decline (and the green boxes may never come into play).

Blackstone Inc joins the overbought clubBased on historical movement, the peak could occur anywhere in the larger red box. The final targets are in the green boxes. The pending bottom should occur within the larger green box as has been the historical case. Half of all movement has ended in the smaller green box. In this instance, the signal indicated SELL on May 26, 2022 with a closing price of 118.28.
If this instance is successful, that means the stock should decline to at least 117.58 which is the top of the larger green box. Three-quarters of all successful signals have the stock decline 2.609% from the signal closing price. This percentage is the top of the smaller green box. Half of all successful signals have the stock decline 5.353% which is the end point of the black dotted arrow. One-quarter of all successful signals have the stock decline 9.08% from the signal closing price which is the bottom of the smaller green box. The maximum decline on record would see a move to the bottom of the larger green box. These are the same concepts for the levels in the red boxes as well.
The ends/vertical sides of the boxes are determined in a similar fashion. The trough of the decline can occur as soon as the next trading bar after signal close, while the max decline occurs within the limit of study at 40 trading bars after the signal. A 0.5% decline must occur over the next 40 trading bars in order to be considered a success. Three-quarters of successful movement occur after at least 10 trading bars; half occur within 29 trading bars, and one-quarter require at least 36 trading bars.
The black dotted arrow represents median historical movement. Medians are a good metric, but they are just one of many I use when forecasting future movement.
As always, the stock could decline the very next bar after the signal without looking back (therefore the red boxes would not come into play) or the stock may never decline (and the green boxes may never come into play).

Steel Dynamics is overbought according to thisBased on historical movement, the peak could occur anywhere in the larger red box. The final targets are in the green boxes. The pending bottom should occur within the larger green box as has been the historical case. Half of all movement has ended in the smaller green box. In this instance, the signal indicated SELL on May 27, 2022 with a closing price of 85.6795.
If this instance is successful, that means the stock should decline to at least 84.85 which is the top of the larger green box. Three-quarters of all successful signals have the stock decline 2.103% from the signal closing price. This percentage is the top of the smaller green box. Half of all successful signals have the stock decline 4.89% which is the end point of the black dotted arrow. One-quarter of all successful signals have the stock decline 8.016% from the signal closing price which is the bottom of the smaller green box. The maximum decline on record would see a move to the bottom of the larger green box. These are the same concepts for the levels in the red boxes as well.
The ends/vertical sides of the boxes are determined in a similar fashion. The trough of the decline can occur as soon as the next trading bar after signal close, while the max decline occurs within the limit of study at 40 trading bars after the signal. A 0.75% decline must occur over the next 40 trading bars in order to be considered a success. Three-quarters of successful movement occur after at least 10 trading bars; half occur within 22 trading bars, and one-quarter require at least 36 trading bars.
The black dotted arrow represents median historical movement. Medians are a good metric, but they are just one of many I use when forecasting future movement.
As always, the stock could decline the very next bar after the signal without looking back (therefore the red boxes would not come into play) or the stock may never decline (and the green boxes may never come into play).

Overextended Markets (Overbought And Oversold)1) Bollinger Bands:
Some traders will determine the market as "over-extended"
when the price is piercing above or below the Bollinger bands.
If above then the price is considered overbought and price may start to reverse.
If below then the price is considered oversold and the price may start to reverse.
2) Stochastic RSI:
some traders will determine the market as "over-extended" once the price is over the 70% line or below the 30% line.
The bottom 30% means the price might be oversold and buyers are projected to come in.
When the price is above the 70% line the market is considered overbought and sellers are projected to come in.
3) Supply And demand
When we have 3x continuation patterns in a row DBD or RBR in a row, we can draw a downward or upward aggressive trend line (momentum line).
When this happens, we consider the market overextended and call it the “elastic band effect”.
stretch out an elastic band to the breaking point and let go, the elastic band snaps back at a high-speed force and hurts.
This is the same for trading, When the market is overextended and breaks the downward or upward momentum line, we can assume the market will snap back and remove 2 if not 3 of the opposing zones that gave us the ability to draw the aggressive momentum line.
Buying or selling the pullback into the demand or supply is usually a good call if the criteria are met for a good trade.
