ETH - The Last Standing Low!ETH is now sitting right around the lower bound of its range, and this isn’t just any support.
This level marks the last standing low from the weekly timeframe, a zone that has already proven it matters.
As long as this weekly low holds, ETH still has a real chance to rotate higher and work its way back toward the upper bound of the range. This is where strong markets usually make a decision:
either defend structure… or break it.
For now, I’m not guessing bottoms. I’m simply respecting the level.
Hold this zone, and upside scenarios stay valid. Lose it, and the picture changes entirely.
⚠️ Disclaimer: This is not financial advice. Always do your own research and manage risk properly.
📚 Stick to your trading plan regarding entries, risk, and management.
Good luck! 🍀
All Strategies Are Good; If Managed Properly!
~Richard Nasr
Oversold

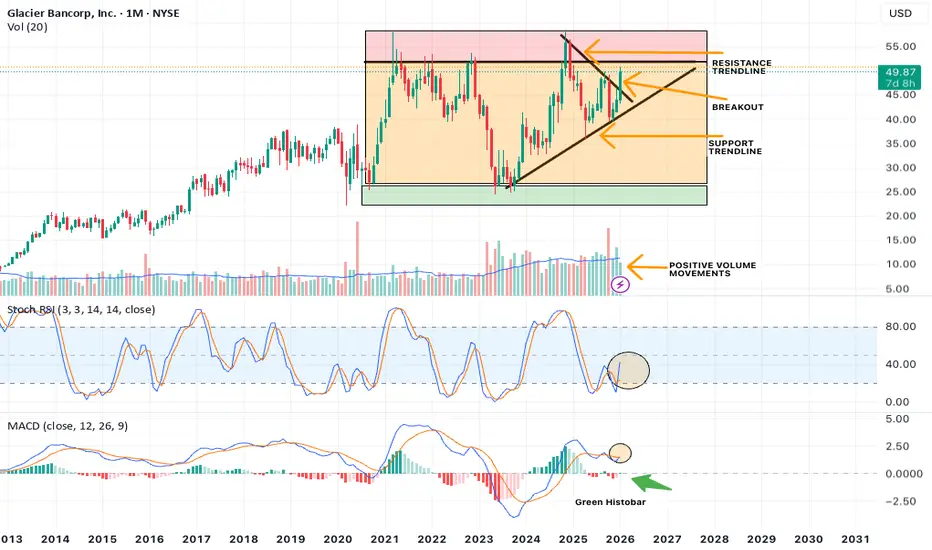
MACRO Bullish Case for GBCI on 1 MonthGlacier Bancorp (GBCI) has some Macro develops that have caught my eye on the 1 Month timeframe.
With the right lower timeframe signals, there may be a trade at some point.
Ill be looking at price action, chart patterns, indicators, candle configurations and more to continue my assessment on this.
NOTE: Being that this initial assessment is on 1 Month, keep in mind we still have 8 days for this month's candle close.
Also being that this is on 1 Month, price movements can showcase strong macro level trends, with potential long duration.
WHY this stock has caught my fancy?
Note price action, we are in a clear uptrend, maintaining the support trendline.
We are also currently breaking out of a Resistance trendline that was responsible for the declines from its top at roughly $58.00.
Though breakout seen, we are still in need of confirmation. Which we maybe able to gauge at in the 1 week.
The candle responsible for breakout is a massive Engulfing Bullish Candle.
We are also getting close to the Resistance Zone depicted by the red rectangle placed. WHich is an extreme Supply zone. It won't be easy to get past this so keep in mind potential push back.
Areas to consider Support test on the Resistance trendline and the Uptrend Support trendline.
Also we may be in a Ascending Triangle Pattern created by Support trendline + Horizontal Resistance.
Other Signs:
VOLUME: Positive Volume Uptrend, will need to see Volume Continue upward especially during breakout through resistance.
MOMENTUM Indicators:
If we maintain current trajectory of indicators at the close of this Months candle, Momentum will be on our side.
With Stoch RSI showcasing Bullish Cross above 20 lvl and MACD attempting to Cross ABOVE 0 lvl with Green histobar print.
All positive signs.
Such developments supports attention and observation on GBCI.
Look to more updates on this.
(AAV) Fast Bounce Setup | Price:$11.28 →Target:$11.84(+ 5 %)💎 The Sleeping Giant of the Montney: Advantage Energy’s Bold Leap 🏔️🔋
Imagine a company that doesn’t just pull energy from the earth but is pioneering the technology to "clean" it as well. 🌍✨ Founded in the heart of Calgary, Advantage Energy is a dual-threat powerhouse in the prolific Montney formation. 🏗️❤️ While their core business pumps out record production, their subsidiary Entropy Inc. is revolutionizing Carbon Capture and Storage (CCS). They are proving that the future of fossils is clean, efficient, and highly profitable! 💎🔥
📉 Technical Setup: The "Quick Strike" Plan 🎯
We are tracking a classic support bounce within a long-term ascending trend channel. 🎢✅ Here is the tactical play for the short term:
🚩 Entry Point: $11.28. This level aligns with a recent technical support zone where buyers have historically stepped in. 🛡️📉
🏁 Exit Target: $11.84 (A clean +5% gain). 💰🎯 This target sits just below major overhead resistance, offering a high-probability "quick strike" for swing traders. ⚡📈
🔭 The Long-Term Vision: $15.00+ and Beyond? 🚀
While we take our profits at 5% for the short term, the "Big Picture" suggests this giant is just getting started. 🏔️💎
Production Surge: With the Progress Gas Plant set to commission in Q2 2026, production is expected to jump to 90,000 boe/d by the second half of the year. 📈🌊
Revenue Growth: Analysts forecast a massive 159% EPS growth for the coming year as high-margin liquids production ramps up. 💰🚀
Analyst Consensus: While we target $11.84 for a swing, professional analysts have a 12-month average price target of $14.14 – $15.15, with some "blue sky" estimates reaching as high as $21.00. 🎯✨
🏗️ Strategic Projects: The 2026 Catalyst 🕒
Entropy Glacier Phase 2: On track for commercial operations in Q2 2026, aiming to capture 160,000 tonnes of CO
2
annually. 🌪️❄️
The Shareholder Engine: Once debt targets are met, Advantage plans to funnel 100% of free cash flow into share buybacks, which could drive a 14% increase in production per share. 🔄🎁
What’s your strategy? 🧐 Are you taking the quick 5% profit at $11.84, or are you holding for the $15.00+ long-term transformation? Let me know in the comments! 👇💬

(DOTL) Fast Bounce Setup | Price:$ 11.67 → Target:$14 (+ 20 %)🚨 D2L (DTOL.TO): Whale Trap + RSI Oversold + The "Spring" Setup 🐋⚡
Ticker: TSX:DTOL Outlook: Bullish 🟢 Target: $14.00 🎯
1. The "Whale Trap" Signal 🕵️♂️ Yesterday, a massive 87,000 share block printed "Below Bid" at $11.10.
The Trap: Retail panic-sold seeing the red print. 🩸
The Reality: Smart money absorbed nearly $1M of stock in one second. The price instantly snapped back to $11.27.
Verdict: $11.10 is the new institutional floor. 🧱
2. RSI is Screaming "Oversold" 📉➡️📈 The Relative Strength Index (RSI) has dropped into deep oversold territory.
The Pattern: Historically, every time D2L’s RSI hits these lows, the stock acts like a stretched rubber band and snaps back violently.
The Signal: Sellers are exhausted. The elastic is pulled back. We are ready for the release. 🏹
3. The "$12 Springboard" (Year 3) 🧬 History is repeating on the yearly chart. This level is a loaded spring:
2024: Bounced from ~$12 ➡️ $20 🚀
2025: Bounced from ~$12 ➡️ $20 🚀
2026: We are back at the load zone. Load the Spring.
4. Sector Weakness vs. Strong Fundamentals 💎 The Education sector is weak and volume is low (boring), BUT D2L is getting stronger:
Wins: Recently stole Western University & NAIT from competitors. 🇨🇦
Value: Trading at ~3x Sales vs. Instructure (Canvas) buyout at ~7x.
Trade: Buy the "Boredom" to sell the "Euphoria."
📉 Trade Plan:
Entry: Under $12.00 (Deep Value Zone)
Stop Loss: Close below $10.80 (Invalidates the Whale floor) 🛑
Target: $14.00 (Gap Fill & Resistance) 💰
Summary: The Whale print at $11.10 was the clue. The RSI is the trigger. Don't let the low volume fool you—the move is loading. 🌊🚤
Not financial advice. Do your own DD!

Historical Support Zone reached for BRZE warrants attentionsBraze (BRZE) analysis on the 1 week.
Recent price action has brought BRZE to a Major Historical Support Zone of roughly $22.77 to 24.00.
There is no price data below this zone.
We've only touched this area ONCE before in October 2022 to January 2023. Which lead to massive rally to roughly $61.00.
This recent move merits Observation and Attention on this stock.
We need to ask and look at further evidence if this price area expresses enough demand for another BOUNCE UP or we continue to SELL OFF.\
We also have a confluence of 4 indicators flashing OVERSOLD conditions on the 1 Day.
The confluence and such Oversold conditions hasnt really been seen in the history of price action for this asset.
This indicates potential for price to bounce from here in my opinion. This zone is also merits solid stop loss. Risk to reward is good in my opinion.

Roblox (RBLX) Macro oversold conditions + trade potentialHello. This is a Macro analysis on Roblox (RBLX). I will discuss Technical developments indicating oversold conditions from its recent DECLINE in price. Aim of this is educational in purpose.
I will use price action, candlestick patterns, indicators and more to bring up the idea that there is potential trade opportunity here.
Firstly, notice the timeframe of 1 week. I personally love to start here. Than move up timeframes and lastly check down timeframes to 1 Day when i actually want to take a trade.
Notice we hit a HIGH of roughly $140.00 and stayed around here between Summer 2025 to September.
Once Fall hit, we began a Price DECLINE of roughly -48%, bringing us to current price action. It is due to the Major resistance trend line highlighted in chart.
We hit Major Support at around $71.00 and bounced up this week roughly +13%.
Note however this weekly candle hasnt CLOSED yet.
We need to watch closely what this week does. And observe whether this $71.00 level holds or not. Usually we'd like to see a few weeks of solid candles to print ABOVE.
We also need to see how Price interacts with Resistance trendline. Watch for potential breakout and confirmation.
This recent price decline is a relatively sharp decline in my opinion. Which warrants the thinking that it may not be sustainable with potential price bounce in the horizon. As seen this week. BUT we need to make sure whether the bounce will continue upward or if it will fake us out and continue down. It is always important to base actions on the facts in the charts ONLY. Never let emotions take over.
Tune in for more evidence and analysis as RBLX continues this current price move.

(AAV)Fast Bounce Setup | Price:$ 11.11→ Target:$11.66(+ 5 %)⚡📊 AAV – Pullback at Trendline with Strong Fundamentals 📊⚡
AAV continues to look interesting both fundamentally and technically 👀📈.
📰💰 Fundamental Outlook
Revenue forecasts remain very positive for the coming years 🚀, and the company maintains solid fundamentals, providing a strong long-term backdrop 🧱✅.
📉📊 Momentum Check (RSI)
On the daily timeframe, RSI recently pulled back from the oversold area, moving from around 34 to 39 over the past week 🔄📈. This signals improving momentum after a cooldown phase.
📐📍 Price Action Perspective
From a price action angle, the $11 zone is acting as a key pullback area 🧲. Price has once again touched the ascending trendline, showing respect for structure 📈✍️.
✅📉 Technical Confirmation
This pullback is supported by RSI confirmation on the daily chart, increasing the probability of a potential bounce from this zone ⚡🎯.
⚠️📌 Note
This looks like a technical pullback within structure, not a breakdown.

INTC – What Price and Volume Are Telling Us ?INTC - CURRENT PRICE : 37.40 - 37.60
INTC is currently undergoing a controlled pullback within a broader rising structure, as indicated by the rising trendline support (white dashed line). Notably, the recent price decline is accompanied by diminishing volume, which suggests that selling pressure is losing momentum rather than aggressive distribution.
This type of price-down / volume-down behavior typically reflects profit-taking and short-term exhaustion by sellers, often seen during healthy corrections within an uptrend. As long as price continues to respect the rising trendline, the broader bullish structure remains intact.
From a volume perspective, there is no evidence of panic selling, while prior upswings were supported by higher relative volume — reinforcing the view that buyers remain in control at higher timeframes.
Take note that stochastic oscillator is approaching near oversold zone. In an uptrend, any oversold condition may be considered as a potential buy on dips.
Trading Plan (Price & Volume Based)
Buy on pullback near the rising trendline support
ENTRY PRICE : 36.00 - 37.00 zone
Upside Targets:
🎯 Target 1: 40.00 (near-term resistance)
🎯 Target 2: 44.00 (prior swing high)
🧊 Cut Loss: Below 33.00, which would signal a breakdown of trend support.

(QLYS)Fast Bounce Setup | Price:$133.36 → Target:$140 (+ 5 %) 🚀📊 QLYS — Short-Term Trade Setup (Daily) 📊🚀
💰 Entry: 133.36 (Current Price)
🎯 Target: 140.03 (+5%)
📈 Bias: Bullish continuation
💼 Fundamentals
✅ Strong & consistent EPS growth
📊 EPS trend: 3.72 → 6.13 → higher forward estimates
🔁 High-margin recurring SaaS revenue
🏦 Strong institutional-quality business
📌 Fundamentals continue to support higher prices
🧠 Behavioral Pattern
🔄 QLYS often pulls back → bases → pushes higher
📉 RSI reset after prior advance
🧲 Buyers historically step in near demand zones
📌 Current behavior matches previous continuation structures
📉➡️📈 Technical Structure
📍 Price sitting near key demand / value area
📊 RSI ~38–40 → historical bounce zone
📐 Rising structure still intact
📉 Selling pressure fading, not expanding
🚧 Key Resistance Zone — VERY IMPORTANT
🔴 $136 = Major resistance level
⚠️ Heavy supply previously appeared in this zone
🧱 Expect strong reaction / battle near this level
✨ Bullish scenario:
➡️ Clean break above $136 could open the path toward $140+
➡️ Demolishing this level likely triggers momentum continuation
⚡ Day Trading / Zone (Lower Timeframes)
🎯 $136 area = ideal scalp zone
⏱️ Best suited for 1–5 minute timeframe
📉📈 Potential sub-0.5% moves on rejection or breakout attempts
🧠 Excellent for quick reaction-based trading

EURAUD - Shorts Played, Now Watching the Other SidePreviously, this one was pretty straightforward.☀️
📉As EURAUD approached the upper bound of the falling channel, the bias was clear, we were looking for shorts, and price reacted perfectly from that area.
Fast forward to now, and context has changed.
Price has pushed all the way down into a strong confluence:
• The lower bound of the falling channel
• The previous weekly low (also demand zone)
At the moment, we’re seeing rejection from the lower channel, suggesting selling pressure may be slowing down.
⚔️As long as this area continues to hold, my focus shifts from selling rallies to looking for longs, targeting a rotation back toward higher levels inside the range.
This doesn’t mean blind buying... it means waiting for confirmation on lower timeframes and letting the market prove that bulls are stepping in.
⚠️ Disclaimer: This is not financial advice. Always do your own research and manage risk properly.
📚 Stick to your trading plan regarding entries, risk, and management.
Good luck! 🍀
All Strategies Are Good; If Managed Properly!
~Richard Nasr

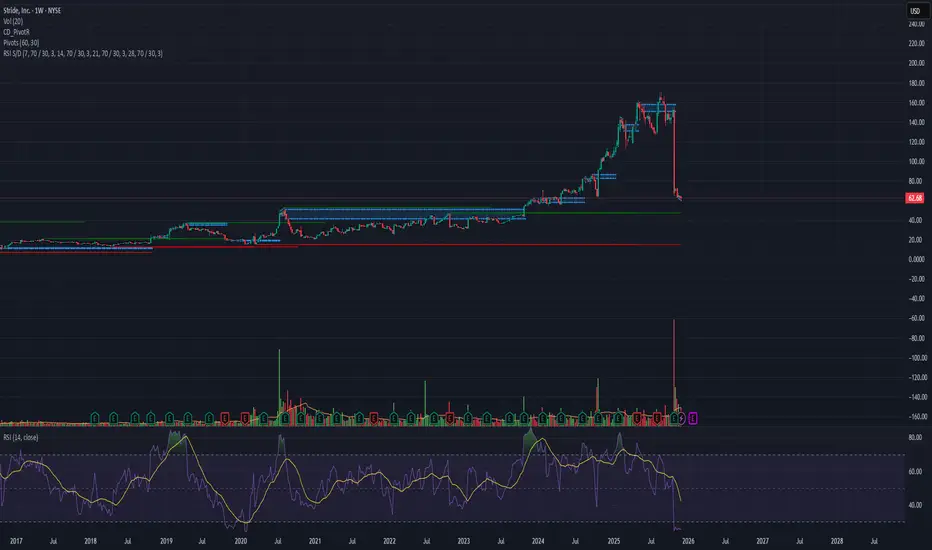
Fast Reversal Setup | Price: 62.68 → Target: 65.81 (+5%)
After the recent lawsuit-related news, LRN dropped sharply from $155 → $62 and is now deep in the oversold area 📉🔥
Volume Signal 📊
This week’s traded volume is higher than anything since its IPO, which often marks a reversal zone.
Repeated Patterns 🔍
Across the daily, weekly, and monthly intervals, the stock is showing its typical reversal pattern, matching previous bounce cycles.
Entry: 62.68
Target: 65.81
Profit: +5% 💰⚡
NZDUSD - Triple Confluence Zone in Play!NZDUSD has been in a steady bearish trend, but the pair is now reaching a major confluence area that could act as a strong turning point.
🔎The blue circle marks the intersection of two descending trendlines and a key demand zone, making it a massive area to look for long opportunities.
⚔️This triple intersection increases the probability of a bullish rebound, especially as the pair is also showing signs of being oversold. A potential rejection from this zone could trigger a short-term correction toward the upper orange trendline, aligning with the next resistance area.
🏹As long as this demand zone holds , the bulls have a chance to step in and shift short-term momentum upward.
⚠️ Disclaimer: This is not financial advice. Always do your own research and manage risk properly.
📊All Strategies Are Good; If Managed Properly!
~Richard Nasr

Fast Bounce Setup | Price: 242 → Target: 254.10 (+5%)Fast Bounce Setup | Price: 242 → Target: 254.10 (+5%) 📈⚡
Fundamentals 📊
VEEV shows steady revenue and profit growth, supported by strong demand for its cloud solutions in the life sciences sector.
Repeated Behavior 🔍
Historically, VEEV produces 5%–25% quick bounces after oversold or sharp pullback zones.
Current price action matches those previous reversal patterns.
Volume & Price Action 🔥
Volume shows accumulation and the price is sitting on a familiar bounce level.
Entry: 242
Target: 254.10
Profit: +5% expected 💰⚡

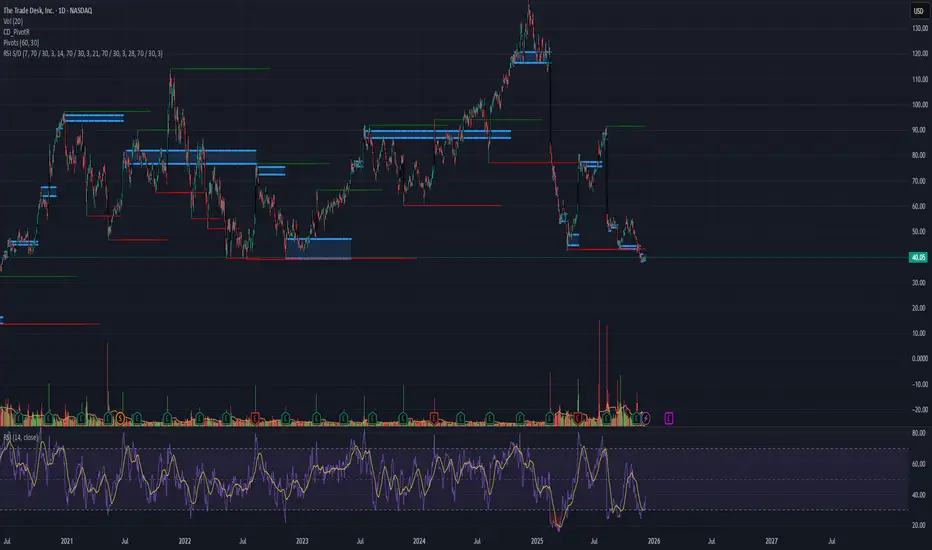
Fast Bounce Setup | Price: 40.05 → Target: 42.05 (+5%)Fast Bounce Setup | Price: 40.05 → Target: 42.05 (+5%) 📈⚡
Fundamentals 📊
TTD maintains strong long-term revenue growth, driven by rising digital ad spending and increasing adoption of programmatic advertising.
Profit forecasts also show healthy growth, strengthening the short-term upside potential.
Repeated Behavior 🔍
TTD has a well-defined behavioral pattern historically:
after sharp selloffs or oversold conditions, the stock often delivers 5%–100% quick bounces before consolidating.
Today’s setup fits the same repeated cycle seen in prior reversals.
Volume & Price Action 🔥
Recent volume indicates buyer accumulation after a wave of selling pressure.
Price is currently sitting at a familiar zone where TTD has shown fast short-term rebounds multiple times.
Entry: 40.05
Target: 42.05
Profit: +5% expected 💰⚡
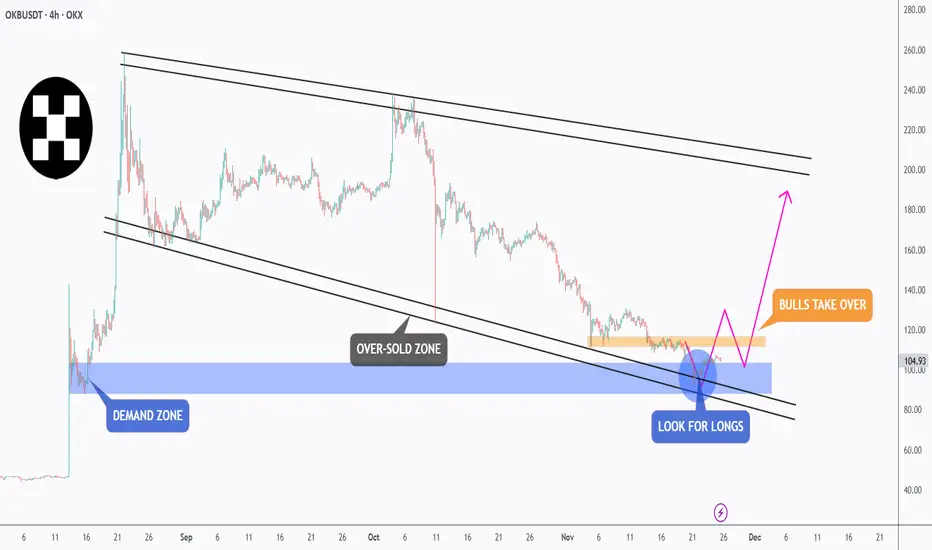
OKB - Demand Holding Strong… Correction on the Horizon?📉OKB is currently trading inside a broad falling channel , but price has just reacted from a major demand zone, which also aligns with the lower bound of the black channel. This confluence creates a strong oversold area where buyers typically step in.
⚔️As long as this demand zone continues to hold, we will be looking for bullish correction setups toward the upper bound of the falling channel. This would be the natural corrective wave after an extended sell-off.
🏹However, for the bulls to fully confirm control, price must break and hold above the orange high. A breakout above that structure would signal a shift in momentum and open the way for a larger trend reversal.
For now, demand is holding, the channel is intact, and the market is positioned for a potential rebound… will OKB deliver the correction we’re waiting for? 🤔
⚠️ Disclaimer: This is not financial advice. Always do your own research and manage risk properly.
📚 Stick to your trading plan regarding entries, risk, and management.
Good luck! 🍀
All Strategies Are Good; If Managed Properly!
~Richard Nasr
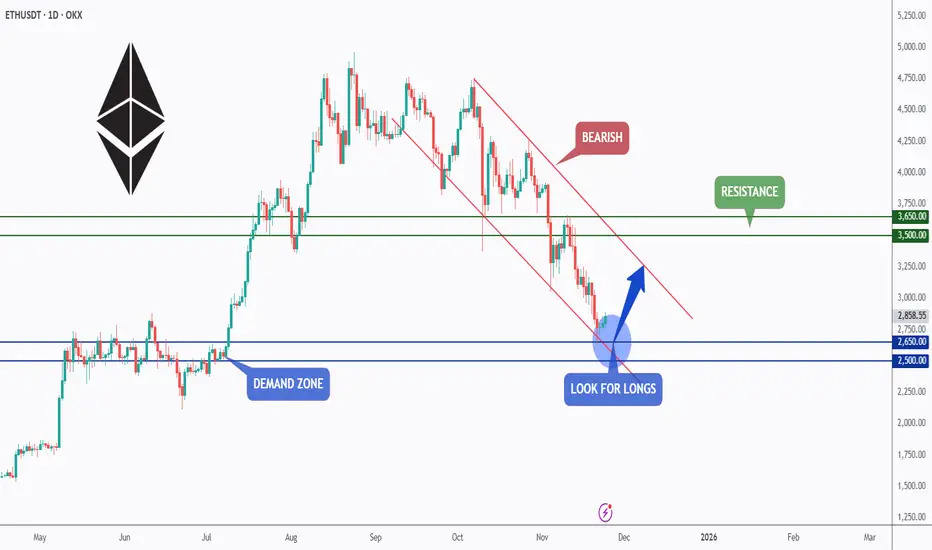
ETH - Demand Zone Meets Channel Support… Correction Loading?⚔️ETH is currently trading around a major demand zone, which lines up perfectly with the lower bound of the falling channel. This intersection forms a strong confluence area where buyers typically step in to absorb the selling pressure.
🏹As long as ETH holds above the $2,500–$2,650 zone, we will be looking for long setups, anticipating a big corrective move toward the upper bound of the falling channel. This would align with the natural rhythm of impulse → correction inside a bearish channel.
If the bulls manage to defend this area, the next targets sit around $3,500–$3,650, which represent the next key resistance levels. However, a break below the demand zone would invalidate the bullish correction setup and open the door for further downside.
ETH is now at a decisive point… will the demand zone trigger the next corrective leg upward? 🤔
⚠️ Disclaimer: This is not financial advice. Always do your own research and manage risk properly.
📚 Stick to your trading plan regarding entries, risk, and management.
Good luck! 🍀
All Strategies Are Good; If Managed Properly!
~Richard Nasr
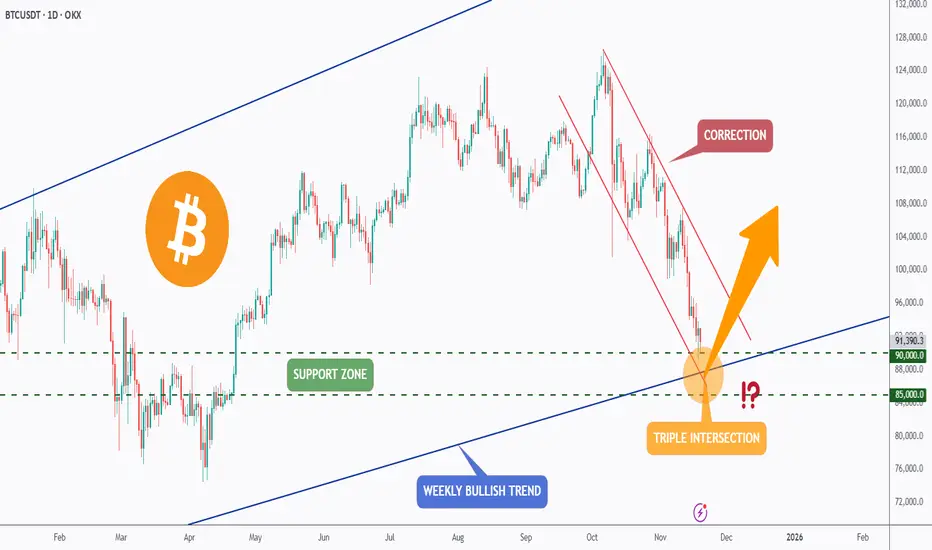
BTC - Triple Intersection… Now or Never for the Bulls?Bitcoin has been in a steep correction for weeks, sliding inside a clear falling channel. Despite the heavy sell-off, price is now approaching one of the strongest confluence zones on the entire chart, a triple intersection.
This key level combines:
1- The major weekly bullish trendline
2- The horizontal support between $85,000–$90,000
3- And the lower boundary of the falling corrective channel
This kind of alignment doesn’t happen often. It’s the area where long-term bulls typically show up.
As long as BTC holds above $85,000–$90,000, the macro bullish structure remains intact. A strong reaction here could trigger a reversal and kick off the next impulsive wave upward. However, if this triple confluence fails, the market may face a deeper correction before stabilising.
We’re standing at a decisive moment… will this zone ignite the next bullish leg or break down into another wave of fear? 🤔
⚠️ Disclaimer: This is not financial advice. Always do your own research and manage risk properly.
📚 Stick to your trading plan regarding entries, risk, and management.
Good luck! 🍀
All Strategies Are Good; If Managed Properly!
~Richard Nasr.
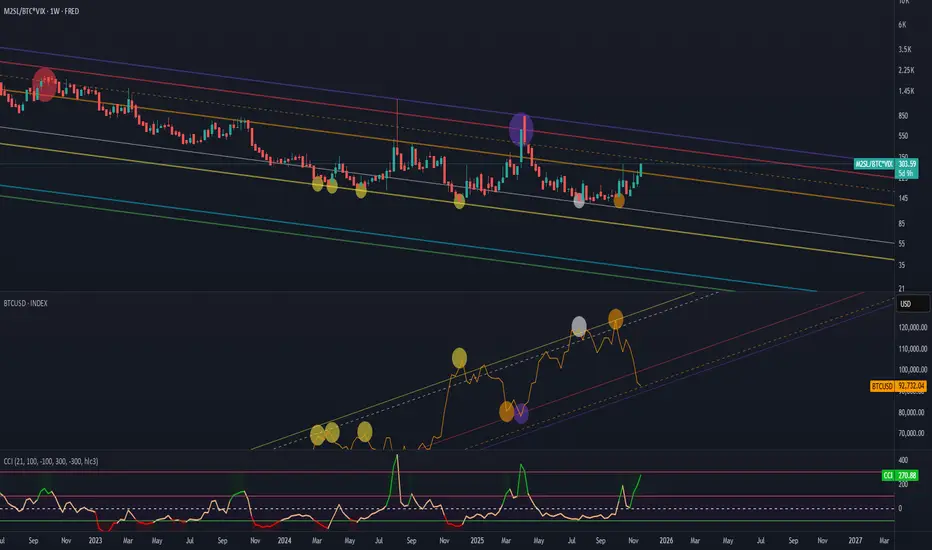
Liquidity (M2) to BTC.D, amplified by (VIX) FEARIt shows the ratio of global liquidity (M2) to Bitcoin’s market capitalization, amplified by market fear (VIX), relative to BTCUSD.
Thanks to this formula, we have an understanding of which phase of the market we are currently in.
In this case the CCI indicator shows:
overbought conditions — meaning money is outside the market and
oversold conditions — meaning there is too much money in the market and it’s time to sell
FRED:M2SL/CRYPTOCAP:BTC*TVC:VIX
For some reason the Bitcoin chart isn’t displaying with all the markings, so I’ll attach a screenshot below.
JP Morgan says EURCHF oversold --- Could target 0.96 on rebound?JP Morgan sees the surge in the Swiss franc as not justified. According to JP Morgan, the Eurozone economy is holding up better than markets had anticipated. Under this environment, JP Morgan believes the current EUR/CHF levels present an opportunity to fade franc strength and rebuild long positions.
If the pair does rebound from current levels, the first area of interest could be 0.9350, followed by 0.9450, where prior swing highs and short-term structure converge. A more sustained recovery could bring the pair back toward 0.9600–0.9700, a major resistance band that has capped every rally over the past year.

OKB - Entering the Oversold Zone!📉OKB has been steadily correcting within a descending channel , but the price is now approaching a massive confluence area, the intersection of the blue demand zone, lower black trendline, and the oversold region.
⚔️This area has historically acted as a strong accumulation zone, where buyers tend to step back in and drive the next impulsive wave. From here, I’ll be looking for long opportunities, ideally after a clear bullish confirmation or a break above the short-term red channel.
🏹If the bulls manage to defend this zone, we could see a strong push toward the upper bound of the black channel, around the $200 mark.
⚠️ Disclaimer: This is not financial advice. Always do your own research and manage risk properly.
📊All Strategies Are Good; If Managed Properly!
~Richard Nasr

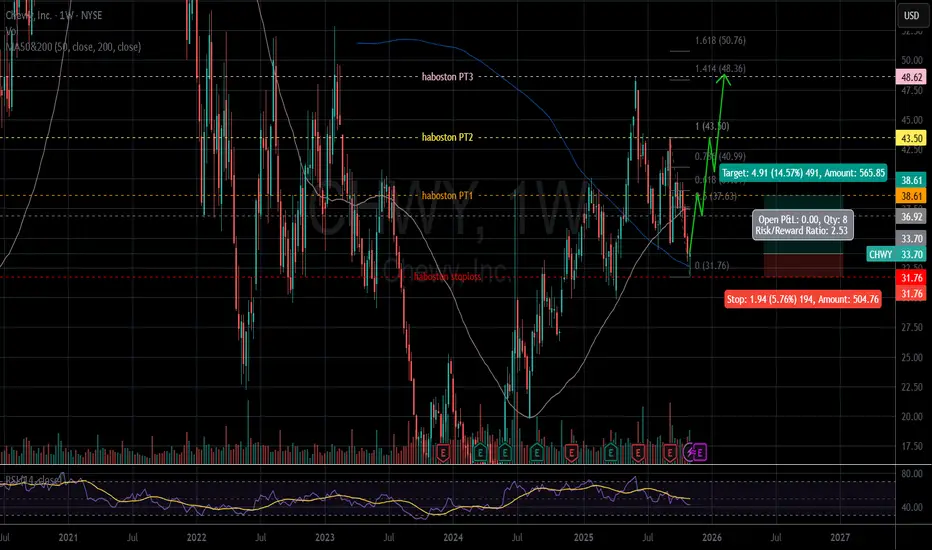
CHWY - Uptrend long term with Golden Cross in Weekly chartIn Daily chart: CHWY is recovering after oversold.
In Weekly chart: The chart has a Golden Cross in July 2025. Price has retested MA200 twice. It is expected that now is the time for CHWY to bounce strongly.
The price closed on 11.07.2025: $33.70 (Entry).
Price target: $38.61/ $43.50/ $48.62.
Stop loss: $31.76 (-5.76%).
IMO, amateur trader.
Good luck!
SLDP | Powering to Move Up | LONGSolid Power, Inc. focuses on the development and commercialization of all-solid-state battery cells and solid electrolyte materials for the battery-powered electric vehicle market in the United States. The company was founded in 2011 and is headquartered in Louisville, Colorado.

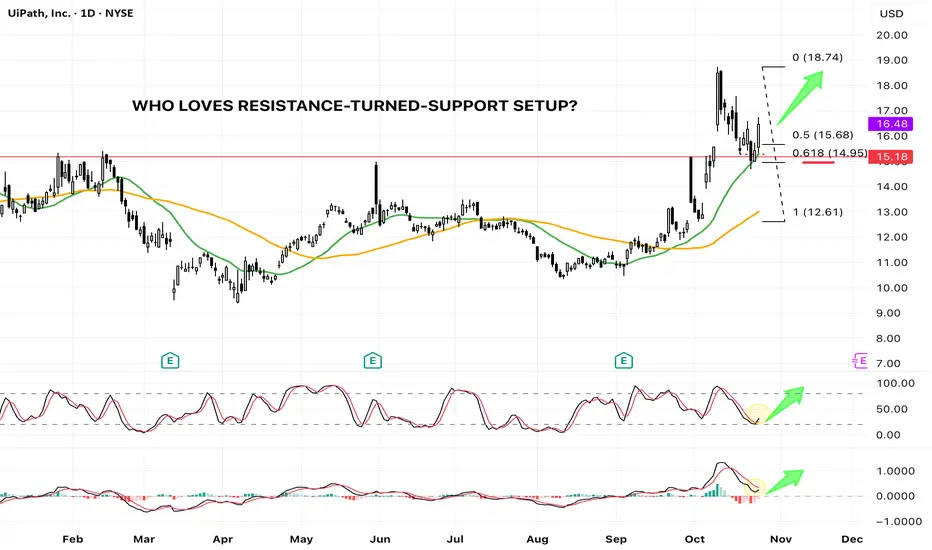
PATH - Textbook R/S Flip at Key Fib & MA Support (Bullish Setup)UiPath ( NYSE:PATH ) spent the majority of 2025 range-bound, oscillating between the $10 and $15 marks. This consolidation phase ended dramatically in early October, when the price decisively breached the long-standing 2025 horizontal resistance at approximately $15.
The breakout led to a swift rally, tagging a new year-to-date high of $18.74 . Following this strong move, the stock began a healthy retracement, pulling back to test the very level that had previously acted as resistance—the classic Resistance-Turned-Support (R/S Flip) setup.
The Confluence of Support
This current pullback is resting on a powerful confluence of technical supports, significantly increasing the probability of a bullish continuation:
1. Horizontal Support: The previous major resistance line (around $15) now acts as a crucial horizontal support.
2. Moving Average Support: The price is testing the 20-day Simple Moving Average (SMA 20, Green Line) . Importantly, this is the first time the price has pulled back to the SMA 20 since the bullish SMA 20/SMA 50 Golden Cross , signaling a strong trend retest.
3. Fibonacci Golden Pocket: The retracement has landed perfectly into the 0.618 Fibonacci Retracement level (from the $12.61 swing low to the $18.74 swing high), a statistically significant reversal zone often called the "Golden Ratio."
Momentum Indicators Confirm Bullish Bias
Beyond the price action, our auxiliary indicators are flashing constructive signals:
* Stochastic: The Stochastic oscillator is reversing from the oversold territory and is showing a clear bullish cross , indicating waning selling pressure and the start of a new upward momentum cycle.
* MACD: The Moving Average Convergence Divergence (MACD) indicator is attempting a bullish cross above the zero line , a powerful sign of increasing positive momentum.
Conclusion
The confluence of price action and indicator signals presents a high-probability bullish setup. The market is currently rewarding the successful test of the R/S flip at the 0.618 Fib and SMA 20 support.
While this setup suggests a strong likelihood for the next leg higher, traders must remember that trading involves probabilities. A clearly defined stop-loss is essential to manage risk should the market invalidate this robust support zone.