xauusd next target 4161?the next target for XAU/USD (Gold) is highly dependent on its ability to break through key resistance levels, with an immediate focus on the $4,161 area. The upcoming Federal Reserve policy meeting is the primary catalyst that will determine the direction.
The table below summarizes the key price levels and potential targets you should watch.
Timeframe Key Support Key Resistance Bullish Target (if resistance breaks) Bearish Target (if support breaks)
Short-Term $4,004, $3,951 $4,050, $4,161 $4,200 → $4,300 → $4,381 (All-Time High) $3,944 → $3,900
Medium-Term (e.g., 1-3 months) $3,874 - $3,878 - $4,249 - $4,300+ -
🚀 What Will Drive the Next Move?
The consensus among analysts is that the immediate price direction hinges almost entirely on the Federal Reserve's upcoming meeting and subsequent commentary.
The Primary Catalyst: The Federal Reserve
The Rate Decision: A 25-basis-point rate cut is almost fully priced in by the market. Therefore, the decision itself is unlikely to cause a major surprise .
What Really Matters: Powell's Tone: The market will react to the forward guidance from Fed Chair Jerome Powell during his press conference.
Dovish Powell (signaling potential for further easing): This would likely weaken the US Dollar and push gold above $4,161, opening the path toward $4,200 and $4,300 .
Hawkish Powell (suggesting a "cut and pause" approach): This could strengthen the Dollar and trigger a sell-off in gold, pushing it below $4,004 to test the $3,944 - $3,900 support zone .
Supporting Factors
Central Bank Demand: Ongoing accumulation of gold by central banks (e.g., India, China, Germany) provides a solid foundation, limiting severe downside moves.
Geopolitical Tensions: Factors like trade tariffs and global instability continue to bolster gold's role as a safe-haven asset.
P-signal

EURCAD Will Explode! BUY!
My dear subscribers,
This is my opinion on the EURCAD next move:
The instrument tests an important psychological level 1.6228
Bias - Bullish
Technical Indicators: Supper Trend gives a precise Bullish signal, while Pivot Point HL predicts price changes and potential reversals in the market.
Target - 1.6286
About Used Indicators:
On the subsequent day, trading above the pivot point is thought to indicate ongoing bullish sentiment, while trading below the pivot point indicates bearish sentiment.
Disclosure: I am part of Trade Nation's Influencer program and receive a monthly fee for using their TradingView charts in my analysis.
———————————
WISH YOU ALL LUCK

ABTUSDT - October 29, 2025The market structure remains bearish, with the token historically losing significant value during downturns and showing limited signs of recovery. A potential short setup could emerge following a manipulated upside move, with optimal short entries near resistance and profit targets around the $0.0530 level.

COAIUSDT.P - October 29, 2025The chart exhibits a strong bearish trend with sustained lower highs and lows, indicating continued downside momentum. Expecting potential continuation toward the lower target near $0.01 — I am basically shorting this until it loses 99% of its market cap.

ENSOUSDT.P - October 29, 2025My personally developed minimalist buy-and-sell signal indicator generated a buy signal on ENSOUSDT.P prior to a 60% price increase.
Disclaimer: This tool is for personal use only. It is not an advertisement or promotion. For educational purposes only.

PIUSDT.P - October 29, 2025The chart shows a clear bearish market structure with consistent lower highs and lower lows. Price is currently retracing toward the $0.3584–$0.5342 resistance zone, where a sell short limit order aligns with the broader downtrend, targeting a continuation toward the $0.0953 support area.

ADAUSDT.P - October 27, 2025Based on the current price action, the ADAUSDT.P 15-minute chart shows a potential high-risk short setup targeting a move lower from the resistance level around $0.6794. A confirmed aggressive rejection at this resistance is necessary to validate a short entry, with a target around $0.6462 and a stop loss at $0.6946.

BTCUSDT.P - October 28, 2025Price is currently consolidating near the immediate support around $113,800; a strong bullish reaction here could confirm a long entry targeting $115,900–$116,400, while a breakdown below this level would favor a short setup toward $111,500.
Trade based on the reaction and confirmation at the immediate support zone — only set buy long and sell short limit orders if the immediate support zone is touched. No trades should be taken if it is not touched. Strictly follow limit orders: the limit order sell short acts as the stop level for the buy long limit order, and the limit order buy long acts as the stop level for the sell short limit order. Only trade the limit order that is touched first and cancel the other order immediately — do not hedge to avoid multiple risk exposure. Profit targets are set at the next support or resistance level.

XRPUSDT.P - October 28, 2025Entry price is at 2.6375 with a market order; if price has moved slightly higher, consider placing a better limit order entry. Profit level is set at 2.6969, stop level at 2.5976, and move stop level to breakeven at 2.6614. Based on the recent consolidation and breakout attempt, this is a medium-risk setup due to moderate volatility and proximity of stop to recent swing lows.

BTCUSDT.P - October 28, 2025Quick BTC Trade: 15-Minute Timeframe
This chart outlines a short-term long setup after a significant price drop, suggesting a potential scalp or day trade based on a targeted nearest support zone.

ETHUSDT.P - October 28, 2025Price has broken the short-term descending trendline, showing early bullish momentum towards the profit level 4228.35, with the stop level at 4061.07 and breakeven adjustment at 4148.53. Given the wide stop distance relative to recent volatility, this is a medium-risk setup.

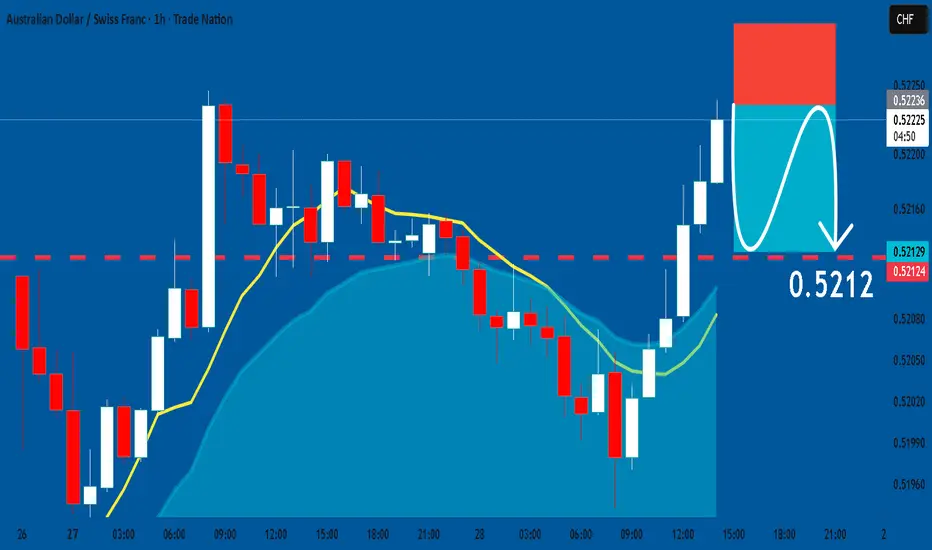
AUDCHF: Short Signal Explained
AUDCHF
- Classic bearish formation
- Our team expects fall
SUGGESTED TRADE:
Swing Trade
Sell AUDCHF
Entry Level - 0.5223
Sl - 0.5229
Tp - 0.5212
Our Risk - 1%
Start protection of your profits from lower levels
Disclosure: I am part of Trade Nation's Influencer program and receive a monthly fee for using their TradingView charts in my analysis.
❤️ Please, support our work with like & comment! ❤️
AUDNZD Technical Analysis! SELL!
My dear friends,
Please, find my technical outlook for AUDNZD below:
The price is coiling around a solid key level - 1.1374
Bias - Bearish
Technical Indicators: Pivot Points Low anticipates a potential price reversal.
Super trend shows a clear sell, giving a perfect indicators' convergence.
Goal - 1.1347
About Used Indicators:
The pivot point itself is simply the average of the high, low and closing prices from the previous trading day.
Disclosure: I am part of Trade Nation's Influencer program and receive a monthly fee for using their TradingView charts in my analysis.
———————————
WISH YOU ALL LUCK

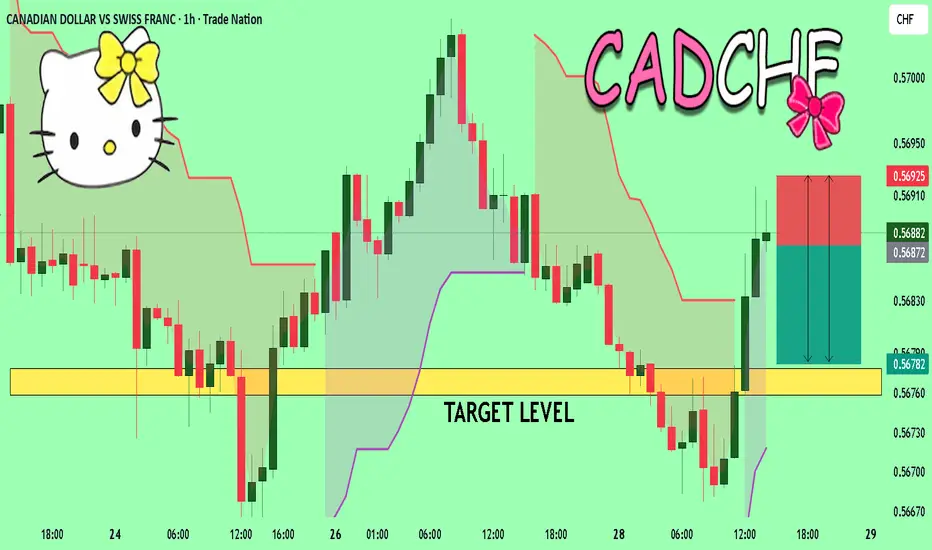
CADCHF A Fall Expected! SELL!
My dear followers,
I analysed this chart on CADCHFand concluded the following:
The market is trading on 0.5687 pivot level.
Bias - Bearish
Technical Indicators: Both Super Trend & Pivot HL indicate a highly probable Bearish continuation.
Target -0.5677
Safe Stop Loss - 0.5692
About Used Indicators:
A super-trend indicator is plotted on either above or below the closing price to signal a buy or sell. The indicator changes color, based on whether or not you should be buying. If the super-trend indicator moves below the closing price, the indicator turns green, and it signals an entry point or points to buy.
Disclosure: I am part of Trade Nation's Influencer program and receive a monthly fee for using their TradingView charts in my analysis.
———————————
WISH YOU ALL LUCK
GOLD: Long Signal with Entry/SL/TP
GOLD
- Classic bullish setup
- Our team expects bullish continuation
SUGGESTED TRADE:
Swing Trade
Long GOLD
Entry Point - 3901.6
Stop Loss - 3884.4
Take Profit - 3938.6
Our Risk - 1%
Start protection of your profits from lower levels
Disclosure: I am part of Trade Nation's Influencer program and receive a monthly fee for using their TradingView charts in my analysis.
❤️ Please, support our work with like & comment! ❤️

EURJPY The Target Is UP! BUY!
My dear friends,
EURJPY looks like it will make a good move, and here are the details:
The market is trading on 177.10 pivot level.
Bias - Bullish
Technical Indicators: Supper Trend generates a clear long signal while Pivot Point HL is currently determining the overall Bullish trend of the market.
Goal - 177.51
Recommended Stop Loss - 176.90
About Used Indicators:
Pivot points are a great way to identify areas of support and resistance, but they work best when combined with other kinds of technical analysis
Disclosure: I am part of Trade Nation's Influencer program and receive a monthly fee for using their TradingView charts in my analysis.
———————————
WISH YOU ALL LUCK

TRXUSDT.P - October 28, 2025TRXUSDT is consolidating near support around $0.292; a rebound above this zone could drive a bullish move toward $0.325. However, a breakdown below $0.29 would signal renewed bearish momentum, potentially extending toward the $0.28 area.

DOGEUSDT.P - October 28, 2025Price consolidating within a range, with bullish potential if price breaks above the $0.218 resistance, targeting the $0.28–$0.30 zone. Conversely, a rejection here and breakdown below $0.175 could trigger a deeper retracement toward $0.09 support.

BNBUSDT.P - October 28, 2025BNBUSDT is consolidating above the ascending trendline support, showing signs of bullish continuation; a breakout above the 1,150 resistance could confirm momentum toward the 1,340–1,374 zone.

GBPUSD: Short Trade with Entry/SL/TP
GBPUSD
- Classic bearish formation
- Our team expects pullback
SUGGESTED TRADE:
Swing Trade
Short GBPUSD
Entry - 1.3340
Sl - 1.3350
Tp - 1.3321
Our Risk - 1%
Start protection of your profits from lower levels
Disclosure: I am part of Trade Nation's Influencer program and receive a monthly fee for using their TradingView charts in my analysis.
❤️ Please, support our work with like & comment! ❤️

EURAUD Sellers In Panic! BUY!
My dear subscribers,
EURAUD looks like it will make a good move, and here are the details:
The market is trading on 1.7765 pivot level.
Bias - Bullish
Technical Indicators: Both Super Trend & Pivot HL indicate a highly probable Bullish continuation.
Target - 1.7842
About Used Indicators:
The average true range (ATR) plays an important role in 'Supertrend' as the indicator uses ATR to calculate its value. The ATR indicator signals the degree of price volatility.
Disclosure: I am part of Trade Nation's Influencer program and receive a monthly fee for using their TradingView charts in my analysis.
———————————
WISH YOU ALL LUCK

GBPJPY What Next? SELL!
My dear subscribers,
This is my opinion on the GBPJPY next move:
The instrument tests an important psychological level 203.99
Bias - Bearish
Technical Indicators: Supper Trend gives a precise Bearish signal, while Pivot Point HL predicts price changes and potential reversals in the market.
Target - 203.66
My Stop Loss - 204.17
About Used Indicators:
On the subsequent day, trading above the pivot point is thought to indicate ongoing bullish sentiment, while trading below the pivot point indicates bearish sentiment.
Disclosure: I am part of Trade Nation's Influencer program and receive a monthly fee for using their TradingView charts in my analysis.
———————————
WISH YOU ALL LUCK

$SOL - LONG - ABOUT TO POP?Analysis:
Following up on my Oct 14th BTC note — “Wait for arbitrage to balance spot markets” — we’re now nearing that blue box. As BTC approaches equilibrium, I’m eyeing CRYPTOCAP:SOL for a clean long setup.
Here’s why 👇
AVWAP Confluence Zone:
We’ve got the lower band of a HTF auction colliding with the VWAP line from another HTF auction — strong mean reversion and liquidity overlap. (Didn’t draw them out to keep the chart clean.)
Fibonacci Confluence:
A completed AB=CD right at 175.0, perfectly inside the HTF golden pocket (0.618). That’s a key structural retrace aligning with measured move completion.
Bullish Harmonic (4H):
A textbook bull harmonic forming — early signs of reversal pressure building.
No position yet. Waiting for SOL (CME) to close the gap at ~174.7 — that’s my trigger to go long.
🎯 Target: 223 — with a possible sweep of the 229–230 zone where shorts are stacked. Expecting a short squeeze flush through that region.
Seeing solid order flow confluence across the board.
Will update this post as things unfold.
