P-value
NOVAGRATZLOADED shares at $29.45 Friday. This is MSTR on steroids with actual revenue + AI data centers.
Just printed their best quarter ever ($505M net income, ~$29B rev) thanks to a $9B BTC whale trade 80k+ BTC sold OTC with minimal slippage + exploding trading volumes. But the real rocket fuel is HELIOS AI/HPC pivot: 800MW live, 2.7GW pipeline, NASDAQ:CRWV locked in for $435M+ annual EBITDA potential. Morgan Stanley calls it $30B terminal value. $1.15B convertible notes at 0.50%? Dirt-cheap capital to fund growth — not dilution yet. Catalysts: BTC >$120K (Galaxy amplifies 2-3x)
Helios revenue ramp H1 2026 On track for initial energization/power-up in December 2025
Technicals: Broke out of multi-month base
RSI cooling after dip (oversold bounce incoming)
Volume shelf at $29 = strong support $25 floor
Golden cross forming on weekly
This dip was the last shakeout post-notes FUD.
Add on dips around $30
Trail stops or take partials above $45
Full send to $60+ this year if BTC rips
Helios power-up = moonshot. Estimates backward-looking; if Helios hits + crypto cooperates, Q4 crushes again (revenue normalizes but margins fatten). $60+ YE

Zulu PrincipleJim Slater beat the market for decades by systematizing quality + reasonable price + momentum—first via a 1960s “earning situations” turnaround playbook, then (1992+) via the Zulu Principle: small/mid caps with fast EPS growth, efficient capital use, cheap vs growth (low PEG), and RS strength, managed by strict quarterly rebalances.
The two playbooks
1) “Capitalist” (1960s turnaround)
Yield ≥ 4%, EPS up in ≥4 of 5 years, EPS ≥ 2× in 4 years
Optimistic chairman’s statement, sound liquidity, no exceptional vulnerabilities
Reasonable asset value, not family-controlled, voting shares
Spirit: early GARP before it had a name—cash-generative, improving earners with robust balance sheets.
2) Zulu Principle (1990s, refined & timeless)
PEG < 0.75 (value vs growth in one metric)
P/E < 20
EPS growth > 15%
12-mo Relative Strength > 0% (price momentum)
ROCE > 12% (quality/efficiency)
Market cap £20M–£1B (small–mid where “elephants don’t gallop”)
Quarterly full rebalance: buy all qualifiers; sell anything that drops off; no in-between adds.
Why it still works
Aligns with the three empirically robust factors: Quality, Value (vs growth), Momentum.
Captures post-earnings-announcement drift by favoring positive EPS surprises and upgrades.
Rules ≫ opinions: removes emotion, enforces discipline via scheduled rebalances.
When few names qualify (tight markets)
Relax one notch (e.g., PEG < 1.0, P/E < 25, ROCE > 10%).
Widen geography (apply the same screen across EU/US/ROW).
Layer news filters (earnings beats, trading updates) on top of the screen.
Ready-to-run screen: www.tradingview.com
Universe: your domestic market + optional global small/mid
PEG (1y forward EPS growth) < 0.75
P/E (TTM or forward) < 20
EPS growth (TTM or forward) > 15%
Relative Strength (12m vs market) > 0%
ROCE > 12%
Market Cap , 1.1x USD
Liquidity guardrails: £5k ~ £20k Daily Volume
Sanity Check: Golden Cross, Price above 50/200 DMA
Portfolio construction & rules
Quarterly rebalance (strict): equal-weight all qualifiers; sell anything that no longer qualifies.
Max names: 20–40 (equal weight); if >40, rank by lowest PEG → highest RS → highest ROCE.
Risk: position size so any single name ≤ 5% weight; optional 15–25% stop from entry if you want overlays.
Costs/slippage: use liquid names (ADV filter) and quarterly cadence to keep friction low.
Upgrades you can test
Replace RS>0% with 6-Month RS > 5% or 12-Month RS > 10%.
Add Net debt/EBITDA < 10× (quality balance sheet).
Require positive estimate revisions in the last 3 months.
Momentum overlay: require price above 50/200-DMA to avoid value traps.

Value to Price Contraction PatternVPC Overview
What to Watch During Corrections
Stay engaged. Corrections are when future leaders reveal themselves.
Breadth divergence = danger. If indexes rise while the percentage of stocks above the 200-DMA is less than 50% (especially in the 30s), expect a pullback; rallies are narrow and fragile.
Look beyond cap-weighted indexes. Check equal-weight S&P, S&P 400 (midcaps), and Russell 2000; if they lag, leadership is thin.
Distribution vs. accumulation. Clusters of distribution days with few/brief accumulation days = risk-off regime.
How Leaders Reveal Themselves (3 Phases)
Predictive (during the correction):
Stocks hold up the best, often within ~25% of 52-week highs while the market is weak.
The RS line makes new highs even if the price is flat/down. Keep them on the A-list.
Right off the lows (post-FTD):
Explosive moves straight from lows, first into new high ground.
These often become the cycle’s monsters; wait for the first tight add-on/base if the initial thrust is extended.
Confirming (after the turn):
Breadth broadens; more proper bases are complete; opportunities are more obvious but still fruitful.
Entry Playbook
Require a Confirmed Uptrend: A follow-through day (FTD) + real setups. FTD alone is not a buy signal.
Focus on VCP bases (Volatility Contraction Pattern): successively tighter swings, drier volume, and right-side strength; buy as it clears the pivot with power.
RS Line New Highs into/at Breakout = Green Light.
Recent IPOs: prime “magnitude plays”; catch early primary bases coming out of corrections.
Progressive Exposure (when trades work)
Start with ~25% exposure (e.g., 4–5 x 5% “pilot” positions or one 20–25%).
If pilots gain traction, move quickly to ~50%, concentrating on the best names (add to winners).
If strength persists, scale to 75–100%.
Do not scale up if pilots aren’t working; reduce instead.
Selling & Timeframe
Define intent up front: trade (harvest faster, lower drawdown) vs campaign (accept drawdowns for bigger targets).
Sell into strength when the extension vs. key MAs is wide and the downside is greater than the upside.
For developing skill: take partials at 2–3× your initial risk (R) to “free-roll” the position; trail the rest.
Never raise cash just because the index is red; raise cash when your stocks show deterioration or hit stops.
Risk & Stops
Enter with a tight risk (Minervini style: often 3–5% below a well-defined pivot/low).
Position size so a stop hit costs ~1–2% of equity per idea.
Don’t average down. Cut quickly; the strategy is better than you—your job is to execute it.
Five Fast Filters for New Leaders
Shallow corrections from highs (ideally ≤25%) and quick recoveries.
Bases forming within long-term uptrends; VCP tightenings.
Fastest back to new highs after the market low; frequent up-days > down-days (“ants”: ≥12 up in 15).
The RS line is making new highs before/at breakout.
Recent IPOs with real growth.
Mindset
Commit to one sound strategy and master it; discipline is greater than prediction.
Trust the stocks, not the headlines. When the market confirms and the leaders set up, act.
Scanner:
www.tradingview.com
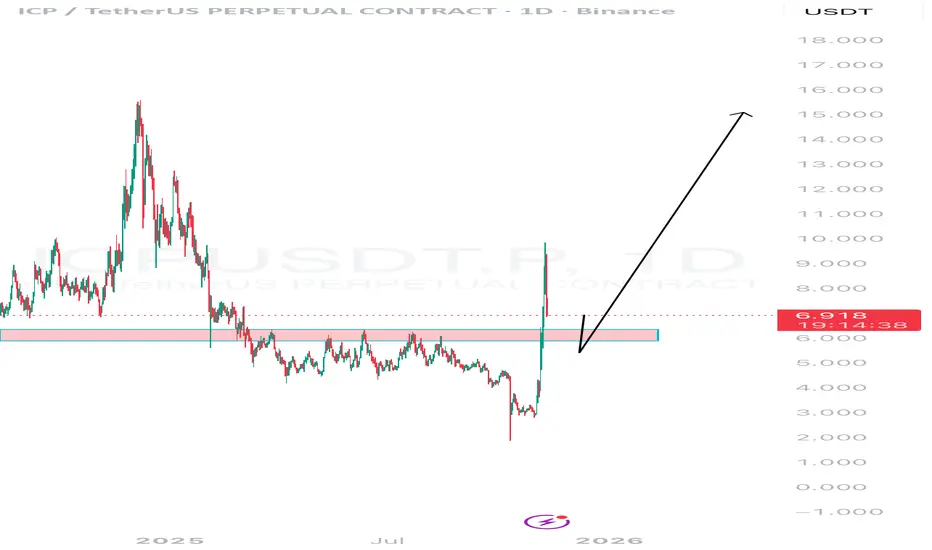
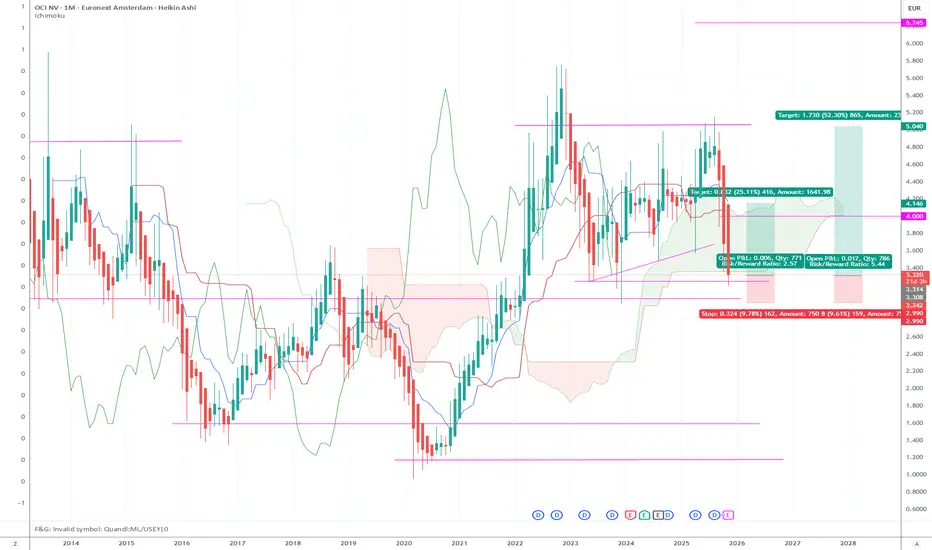
Risk / Reward optimal levelUpcoming merger with Orascom Construction PLC caused unnecessary fear and uncertanity. During such mergers in 75% of cases there is 20% premium paid. Intrinsic value is higher than current value on the market. Analyts recommended prices:
Average price target: Approximately €5.87 to €6.98.
High-end forecast: Around €8.86 to €10.50.
Low-end forecast: Around €4.30 to €4.36.
So calculate intrinsic value yourself for example if its €6 then add 20% premium and Value after merger will be €7,2. In other words you will get so much in value in Orascom Construction PLC stocks.
CAC 40: Poised for a Major UpsideThe French CAC 40 index — often overshadowed by Wall Street giants — may be standing at the edge of a powerful long-term rally. Beneath the surface, the forces driving this potential upside are not just economic cycles, but structural realities of modern finance.
Over the past decade, the global economy has entered an era of permanent liquidity. Central banks have normalized money printing as a policy tool — from the Federal Reserve to the European Central Bank. Every market slowdown or banking tremor now meets the same response: more stimulus, more debt, and more liquidity injections.
This infinite expansion of money supply inevitably pushes asset prices higher. Stocks, real estate, and even commodities have become the escape route from currency debasement. And the CAC 40, with its deep exposure to global blue-chip companies like LVMH, TotalEnergies, and Airbus, stands as one of Europe’s most direct beneficiaries.
Another quiet but powerful driver is demographics. Europe’s aging population means trillions of euros are tied up in pension funds — all of which must be parked in productive assets to sustain retirements. With bond yields historically low and inflation eroding purchasing power, the logical destination for this capital is equities.
Add it all up:
Endless government debt expansion
Central banks addicted to printing
Institutional demand from retirement funds
In such an environment, nominally, the CAC 40 almost has no choice but to rise. Whether measured in euros or in real purchasing power, the next leg up could surprise even the optimists.

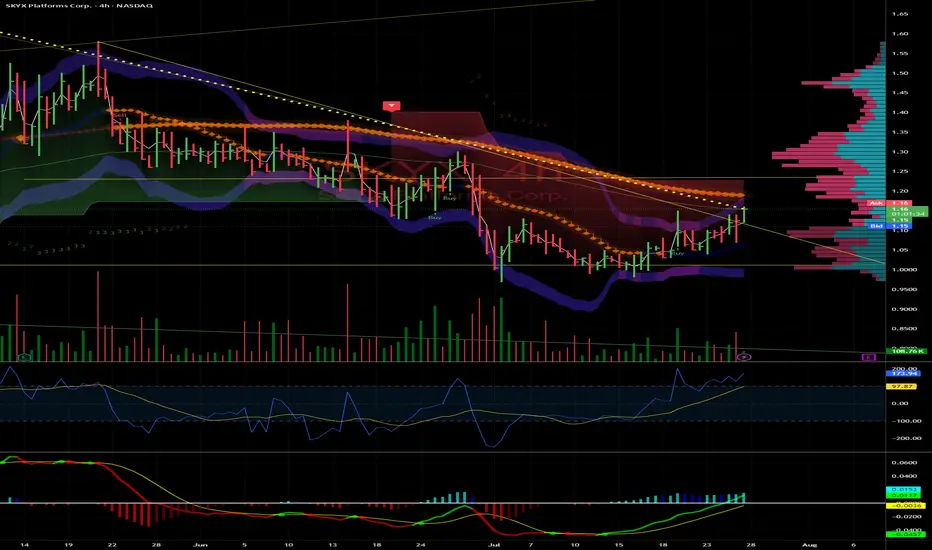
SKYX: Breakout to $1.58 and Potential Triple on Small-Cap Surge
SKYX Platforms Corp. (NASDAQ: SKYX) is primed for a run to $1.58 and could triple to $3.30 by year-end, driven by small-cap strength, e-commerce demand, and strong fundamentals. Here’s why SKYX is a must-watch.
Technicals: Clear Shot to $1.58
Trading at $1.10 , SKYX is coiling for a breakout. Resistance at $1.25 (psychological) and $1.40 (prior high) should fall easily with rising volume and a bullish MACD crossover. $1.58 is achievable by August, with $3.30 (200%+ gain) in sight if momentum holds.
Fundamentals: Smart Home Leader
With 97 patents and 60+ e-commerce websites, SKYX’s plug-and-play smart home platform is gaining traction. Their $3B Miami smart city deal (500,000+ units) and Profab Electronics partnership signal scalability . E-commerce sales, projected to hit $8T globally by 2027 , fuel SKYX’s growth.
Market Tailwind
The Russell 2000, which SKYX joined in June 2025, is breaking out, up 10% YTD . TNA’s 30% spikes amplify this . With a $138.61M market cap and 38 institutions adding shares (e.g., Susquehanna, 478,024 shares) , SKYX is set to ride this wave.
Risks
SKYX isn’t cash flow positive until H2 2025, and Q1 revenue missed ($20.1M vs. $21.15M). Small-cap volatility is a factor, but 12.4% YOY growth and the Russell breakout mitigate risks.The Play
SKYX hits $1.58 soon, clearing $1.25 and $1.40, then triples to $3.30+ by December on e-commerce, smart city deals, and small-cap momentum. I’m buying—thoughts, board?
Summary: Targets: $1.58 near-term, $3.30+ year-end.
Resistances: $1.25, $1.40.
Catalysts: Russell 2000/TNA breakout, e-commerce, smart city deal.
Risks: Cash flow, revenue misses, volatility.
Disclaimer: Not financial advice. Do your own DD. Stocks are volatile.
~Sherwood Coast's Group
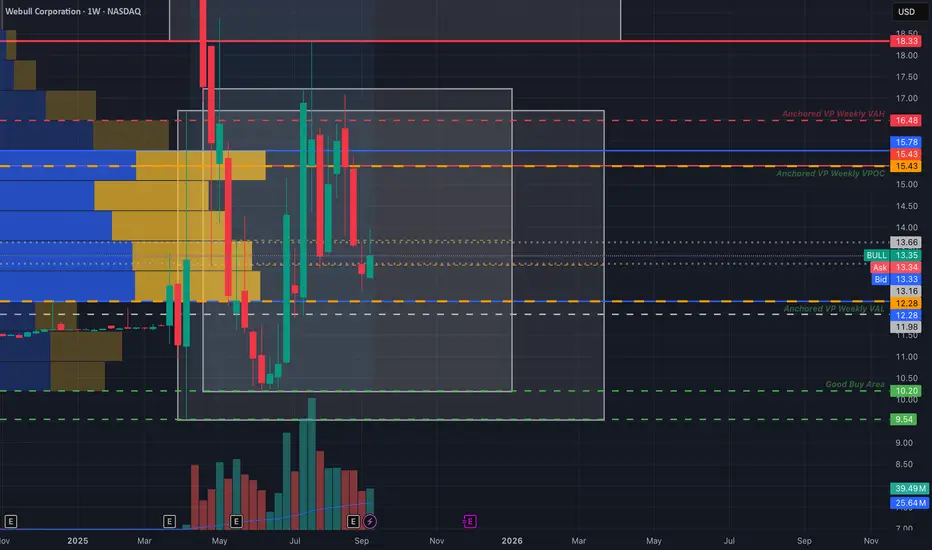
Webull Chart - Robinhood Competitor?Calling all matadors, we got a bull to corral.
I've charted some levels of interest for a speculative hold. Many view webull as a potential competitor for robinhood, although fundamentally, bull is in no-where near in the financial position that hood is in terms of free cash flow and expenses (or innovation as far as I've seen).
This could make a great swing trade on pure technicals. If the brokerage industry sees a period of exuberance(like we've seen in the quantum space), bull could catch a bid. This could also occur if we see a rotation out of hood.
I would love to pick up some shares or calls if the name completes a look below and fail of the anchored volume profile's value area low(around $12.28). or a LBAF of the box bottom @ $10.20.
So far webull has been consolidating. I believe a hold above the VPOC (volume point of control @ $15.43), a breakout of the lower boxes and reclaim of the larger upper box around $18.33-$18.87, could see a push to the mid 20s and 30s at least.
If we are following box rules for that potential trade, then I would not be surprised if bull goes to the box midpoint @ $48.97.
If this thing holds above the VPOC around $15.43 or does a LBAF of either $12.28 or $10.20 it's ripe for picking imo.
Now this is pure speculation, and my analysis could be a shack of shit, who knows, BUT if these set ups present themselves, I would like to roll the dice.
~ The Villain
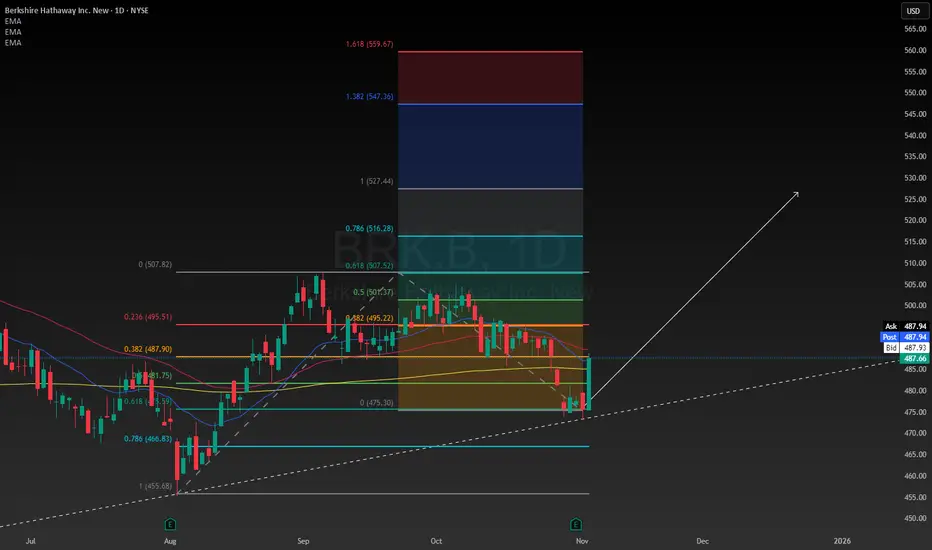
Strategically Investing in Berkshire HathawayI'm going to write about what makes Berkshire a good company, and why I am buying it. Since it is such a huge company I might not be able to define every single detail but I will do my best to cover the most important aspects of the company for you. I hope you enjoy my idea, I am using my time to write this for your benefit and entertainment. If your deciding whether or not you want to buy Berkshire shares maybe this idea can help you to be more informed without having to do a ton of research.
One of the most appealing things to me right now about the shares, is that they are significantly undervalued. The best way to determine the intrinsic value for this company would be to use the discounted cash flow calculation. Projecting 5 years into the future, based on how much money the company will be expected to generate over this period of time, it is reasonable to assume the intrinsic value of the shares to be approximately $560. I think it could take some time to get there so I'm estimating about one or two years from now Berkshire will be worth $560 or more.
Looking at how the company actually uses its capital is important. When the market is at all time highs, investors typically rebalance their portfolios into undervalued, less risky, more stable companies. Berkshire fits the narrative here, and I'm going to explain why.
-Berkshire reallocates capital to its diverse portfolio of businesses, including railroad, energy, manufacturing, and service and retail companies. This can involve funding growth and "bolt-on" acquisitions for subsidiary companies.
-A significant portion of capital is used to purchase equity securities, such as stocks in companies like Apple, American Express, and Coca-Cola, either for a full stake or a "part interest".
-The company holds a large amount of cash and short-term investments to be prepared for market opportunities, which can include waiting for the right time to make large acquisitions or investments.
-Berkshire's core insurance operations generate "float"—money taken in as premiums before claims are paid—which is then invested in other businesses and securities.
-Berkshire uses debt very sparingly and prioritizes equity and its insurance float as its primary sources of capital.
-While individual businesses manage their daily operations, top management, led by Warren Buffett, makes the major capital allocation decisions to ensure capital is deployed where it can generate the highest returns. However as many of you know, Warren Buffett will step down as CEO and leave Greg Abel in charge, I don't think this will change much in the core operations of the business.
All of these factors contribute to this being a low risk, undervalued investment opportunity despite unfavorable market conditions with the US500 being at all time highs. I have rotated some capital in Berkshire class B shares as a way to reduce my risk but also stay exposed to the market. Berkshire is a great defensive stock that can be added to a diversified portfolio to grow and protect it.
Reasons why Coca-Cola is a Great CompanyI'm going to do a deep dive into why I think Coca Cola is a great stock to buy and hold, or trade whatever really you want to do with it is up to you. I hope you enjoy my idea, I always start off my ideas discussing the intrinsic value of the stock in question as that is a very fundamentally important aspect of buying stocks! I prefer the dividend discount model because it assumes a 28% upside! However I did account for the discounted cash flow as well which represents an upside of 12% which I think is more reasonable to expect this year. Overall I would like to think this company will be worth at least $77 sometime this year or next.
Coca Cola has made significant capital investments in their business over the last few years. These investments support growth by funding projects like expanding its bottling operations and placing more cold-drink equipment in outlets worldwide to drive sales. Historically, Coca-Cola has acquired other beverage companies to diversify its portfolio, although it also focuses on inorganic growth through other opportunities. In 2024, the company made progress toward refranchising some of its company-owned bottling operations to shift towards a more asset-light model.
The company has a great track record of returning capital to its shareholders. Coca-Cola has a long history of paying and growing dividends, having increased its dividend for 62 consecutive years. In 2024, it paid out $8.4 billion in dividends. The company repurchases its own shares to return capital to shareholders, with net share repurchases of $1.1 billion in 2024.
Coca-Cola manages a mix of debt and equity to finance its operations, with debt representing approximately 37.5% and cash and equivalents making up about 15.0% of its total capital in a recent analysis. This balanced approach is used to support growth while managing financial risk and optimizing overall performance. Coca-Cola focuses on producing and marketing high-margin beverage concentrates, while largely outsourcing the capital-intensive bottling and distribution processes to partners. This efficient model helps maintain high profit margins and financial resilience.
In essence, Coca-Cola acts as an anchor in a diversified portfolio, providing stability and downside protection when other growth-oriented investments may be struggling.

My Waste Management Investment StrategyAfter the last earnings report causing one of my favorite stocks to fall, it presents a valuable opportunity in my opinion. I am going to write what I like about the company and why I feel like it is a good idea to have Waste Management in your portfolio. I will write about all the reasons I think this is a good investment. Enjoy!
The very first thing I do when I am looking at a company for the first time, is calculate the intrinsic value of the stock to determine if it is undervalued or not. According to the numbers I ran through the equation Waste Management is undervalued by approximately 40% at this time of writing. I reasonably believe the stock could be worth as much as $280 in the next couple years.
Waste collection and disposal are critical for public health and safety, making them essential services that society cannot function without. Demand for these services is stable and generally not affected by economic downturns or price increases because customers, whether residential or commercial, will continue to generate waste that needs managing.
Establishing waste management infrastructure, such as landfills and processing facilities, requires significant capital investment, technical expertise, and complex permitting processes, making it difficult for new competitors to enter the market. The industry is often fragmented, allowing large publicly traded companies to acquire smaller, regional firms, leading to economies of scale and increased market share.
Companies are increasingly investing in recycling facilities, converting landfill gas into renewable natural gas (RNG), and offering other environmental services. These initiatives align with global sustainability goals and create new revenue streams and growth opportunities, attracting ESG-focused investors.
Many established companies in this sector have a history of consistent dividend payments and share repurchase programs, appealing to investors seeking reliable income and long-term value. The low volatility of the waste sector can help diversify an investor's portfolio and provide some protection during volatile market cycles.
The cost of waste removal is typically a very small fraction of a customer's total expenses (e.g., well below 1% for commercial customers). This low relative cost makes customers less likely to scrutinize price increases or switch providers over small differences, making it easier for companies to raise prices.
In summary, garbage companies have significant pricing power primarily due to high barriers to entry, the essential nature of their services, and the localized, regional-monopoly characteristics of the industry.

DIS Falling WedgeDis rallied from April '25 until July '25 and then consolidated around $120, forming a bullish falling wedge. The red line is the 200-day moving average which is acting as support at $110. It has been bounced off twice. The seasonals look bullish going into the last 2 months of the year when considering 2023 and 2024 price movement. The P/E ratio is 17.66 which is almost a 3rd of its 2-year moving average which is 47.43, indicating a low valuation with lots of room for upside. The aqua line is the 50-day sma which needs to be closed beyond along with the top side of the rising wedge before this thing can really take off. Fundamentals look bullish as well, with an uptrend in annual revenue growth and downtrend in debt/equity.

Purchasing Power vs Gold, Stocks, Real Estate, BTC (1971 = 100)Since the U.S. left the gold standard in 1971, the dollar has lost more than 85% of its purchasing power. This chart compares the dollar’s decline to major assets including gold, stocks, real estate, and Bitcoin, all normalized to 1971 = 100. It shows how value preservation and growth have shifted across different asset classes over time.
Source: FRED (CPIAUCSL, SP500, MSPUS) • OANDA (XAUUSD) • TradingView (INDEX:BTCUSD/BLX)
Visualization by 3xplain

All Priced In - Selling to CommenceFundamentals all baked in with price to sales ratio at previous 2021 post-covid highs will push to profit locking and selling pressure.
NASDAQ:GOOGL price target in the ~$230 range.
RSI weekly divergence and upper log line hit confluence with top fundamental ratios.

Fair Value Gaps: The Market Secret You Shouldn’t IgnoreEver scrolled through a chart and spotted a weird empty space in the candles — like the market just skipped a beat? That’s a Fair Value Gap (FVG). It’s one of those subtle price imbalances smart traders love to hunt for. Understanding how these gaps form and how price reacts around them can seriously level up your chart-reading game.
What Is a Fair Value Gap in Trading?
A Fair Value Gap happens when there’s a sudden surge in buying or selling pressure that causes price to move so fast, it doesn’t fully balance out between buyers and sellers. In simple terms, it’s an imbalance — a zone where the market skipped over potential orders.
When you hear traders talking about FVG in trading, they’re referring to those little pockets of unfilled liquidity left behind during strong moves.
So, what is FVG in trading, and why does it matter? Because price often comes back to those areas later to “rebalance” — filling the gap before continuing in the original direction. That’s the core logic behind Fair Value Gap trading.
Bullish and Bearish FVGs
There are two main types of Fair Value Gaps — bullish and bearish:
Bullish Fair Value Gap (bullish FVG): Forms during a strong upward move, when aggressive buyers push price higher, leaving a void below. Price might later dip back into that zone before continuing upward.
Bearish Fair Value Gap (bearish FVG): Forms in a sell-off, when sellers dominate and the market drops quickly, skipping over potential buy orders. Later, price often retraces upward to “fill” that gap.
Both can act as magnets for liquidity — areas where smart money likes to re-enter the market.
Fair Value Gap Example
Let’s say Bitcoin jumps from $110,000 to $120,000 in a single bullish candle, with almost no trading in between. That sudden move leaves a Fair Value Gap — the zone between the candle’s high and low where little to no trading took place.
If the market later pulls back to that range and finds support before bouncing, you’ve just witnessed a textbook Fair Value Gap example in action.
Using a Fair Value Gap Indicator
You can spot these zones manually by looking for three-candle structures — one candle that “leaves the gap” and two surrounding it that don’t overlap. But if you prefer automation, you can use a Fair Value Gap indicators:
Fair Value Gap Trading Strategies
Fair Value Gap trading isn’t about chasing price — it’s about waiting for the market to come back to you. Within Smart Money Concepts, traders often combine FVGs with CHoCH (Change of Character) to confirm a potential shift in structure before entering.
A common approach is to mark recent FVGs, identify the broader trend, and wait for price to revisit a gap in line with that trend.
In a bullish trend , traders look for bullish FVGs below current price as potential demand zones — ideally after a CHoCH confirms that buyers are stepping back in.
In a bearish trend , they watch for bearish FVGs above current price as potential supply zones, again validated by a CHoCH showing a shift in control.
Still, it’s important to remember — these setups are not guarantees. The market doesn’t owe you a fill. Use FVGs and CHoCH as part of the Smart Money framework, not as standalone signals. Always manage risk and make your own trading decisions based on your personal strategy and comfort level.
Final Thoughts
So, what is a Fair Value Gap really? It’s not magic — just the market showing where it moved too fast. Learning to read Fair Value Gaps gives you insight into liquidity, momentum, and potential reversals. Whether you use a Fair Value Gap indicator or mark them by hand, mastering FVG in trading can give you a serious edge in spotting high-probability zones.
Just keep in mind — no indicator or setup replaces good judgment.
Observe, adapt, and let the charts speak for themselves.

Writing about Canadian National RailwaySome one asked me to write why I like CNI, also I don't like the other idea I wrote about the company, I felt like I could do a lot better. I am in the mood to write tonight and feel like this is a great time for me to explain why I like CNI. First and foremost, I like undervalued companies on a technical and fundamental level CNI is significantly undervalued at the time of this writing. As you can see by the technical analysis we are sitting at an area of support characterized by the trendline, and to reinforce the technical analysis I have measured a move using the Fibonacci retracement tool.
Talking about the fundamentals, I have calculated both the discounted cash flow, and the dividend discount models of intrinsic value. According to my calculations the price of the stock right now at $93 is undervalued based on the future revenues the company will be expected to generate. The dividend discount model also suggests undervaluation based on the expected dividend payments over the next 5 years. I always calculate a minimum of 5 years into the future. According to my calculations it is reasonable to assume the intrinsic value for CNI to be somewhere near the $115 mark. This leaves me a substantial margin of safety to buy shares at these levels.
Some more reasons I like the company goes beyond the actual price of the stock. One reason I like the company is because it is a very capital intensive business model with a wide economic moat. The massive investment for building tracks, bridges and tunnels creates an almost impossible barrier for new competitors to overcome. These high costs mean there are very few major railroads, often leaving each with a monopoly or duopoly in certain regions, which gives them pricing power.
When I was building my portfolio at first, I didn't really care about the environmental impact companies had on our planet, but eventually as I learned more it started to become important to me to invest in companies I think were good for the planet. Railroads are significantly more fuel-efficient than trucking, especially when hauling heavy goods long distances. This efficiency leads to lower greenhouse gas emissions, which benefits society as a whole.
The company is the largest rail network in Canada and the only North American railway connecting the Atlantic, Pacific, and Gulf Coasts, giving it a dominant position on the continent. Finally, Canadian National has consistently increased its dividend for 20 consecutive years and currently yields nearly 2.7%. Its relatively low payout ratio of 48% suggests its track record of payout increases will likely continue. I think CNI is a great company and I have been using the stock as a defensive/safe haven type of position in my portfolio.

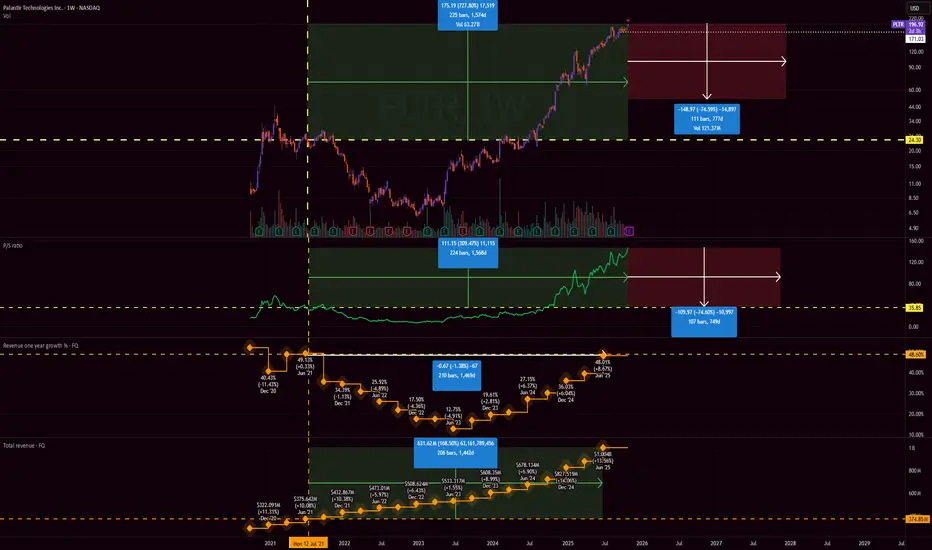
Palantir is at dot-com levels of overvaluationTl;dr, Palantir is grossly overpriced against the general market, as well as against its own financial metrics from 4 years ago, and its valuation metrics put it in peak dot-com bubble territory.
Metrics
Palantir's current price puts it at a market cap of $467.35B. With expected $3.5B in annual revenues in 2025, the price/sales (PS) ratio is at ~147 . PS ratios are the financial metric to watch for growth stocks, since growth companies prioritize revenue growth.
A high PS ratio should mean that the market expects high revenue growth. While Palantir's revenue growth is pretty high, it's not as exceptional as the PS ratio would imply. It seems that the market is not only extrapolating the revenues to continue rising, but it's also extrapolating that the growth itself (or first derivative of revenues) is going to keep increasing for years sequentially. Palantir has to generate far higher annual growth than it currently has to come close to justifying this valuation, I'd expect at least 175% annually.
For reference, Nvidia traded at a PS ratio of 43 in mid 2023, and then generated 125% growth 2 years in a row. The PS ratio stayed relatively stable since then, and never went past 43. Important thing to note here is that Nvidia also has higher net profit margins than Palantir, and profit margins play a role in how PS is interpreted (since earnings is what really matters). Palantir's profit margins have been growing consistently, from 10% -> 16% -> 32% annually, but still not close to Nvidia's 50%. Further profit margin growth would help to justify the overvaluation.
Comparisons
As the chart shows, Palantir's annualized revenue growth last quarter is equivalent to its growth in 2021 at ~50%. Revenues since then increased by 170%. Palantir at the time traded at a PS of 37, which is pretty high for 50% growth, but not too crazy.
If the stock traded at the same PS ratio as in 2021, where its growth was the same, the stock would be trading at ~$53 today at a market cap of $120B.
A PS ratio of >100 implies extreme bubble levels. From what I've found, during the very peak of the dot-com bubble:
Yahoo! traded at PS 100
Amazon traded at ~50
Ask Jeeves traded at ~55
CMGI traded at >300
Internet Capital Group traded at >200
Webvan traded at ~150
With Palantir trading at a PS of 147, it's well within the peak dot-com levels of overvaluation. While the entire tech/AI market is currently at very high valuations, Palantir still towers far above them.
Some examples of other high growth stocks today:
Crowdstrike at PS 30
AppLovin at PS 41
ServiceNow at PS 16
Netflix at PS 11
Even with the stock screener I couldn't find a stock that came close to trading Palantir's PS ratio, except for Microstrategy (which has no revenues as a crypto holding company) and for moonshot pharma R&D stocks which also have little to no sales by design.
The point of this idea is to show how grossly and absurdly overpriced this stock is, but it's not a recommendation to take a short position. The stock is so far decoupled from reality that you should consider it as equivalent to a meme coin. The financials don't matter, and it's simply an asset with a limited supply that is in high demand, so the price keeps going up.
Integra LifeSciences Holdings | IART | Long at $12.39Integra LifeSciences Holdings Corp NASDAQ:IART manufactures and sells surgical instruments, neurosurgical products, and wound care solutions for neurosurgery, neurocritical care, otolaryngology, orthopedics, and general surgery. The stock has fallen over the past few years due to earnings misses / lowered earnings per share guidance, slow revenue growth, and operational challenges / recalls. But the company has been around since 1989 (endured many ups and downs during that time), has over 4,000 employees, a book value near $20 (undervalued), a forward price-to-earnings between 6x-9x (depending on the source), and revenue growth beyond 2025 and into 2028. Debt is slightly high with a debt-to-equity ratio of 1.2x and a quick ratio near 0.8x (company may have difficulty meeting its short-term obligations with its most liquid assets), it is thus a risky play. But the valuation and potential turnaround should get some attention.
From a technical analysis perspective, the stock price has entered and exited my "crash" simple moving average area 3 times now (see green lines). While I think $10 is likely in the near-term, it appears the stock *may* be forming a bottom - especially given the book value is more than 60% from the current price. But, as always, medical device stocks are always a major investment risk, so due diligence is needed.
Thus, at $12.39, NASDAQ:IART is in a buy zone with a note regarding the potential for a dip near $10 before a move up. Targets will be kept low for a swing trade.
Targets:
$15.00 (+21.0%)
$16.50 (+33.2%)

Did weekly lows for GBP/JPY get put in?The exchange rate has declined a little bit less then one percent from the weekly open. In reference to the current weekly high price has declined greater then one percent. Seeing as there is not any major data for the Yen or GBP. This feels like a safe position for me considering all of the implied interest rate cuts forecasted for this week. Using UIP for directional bias and TP, hoping to roll it up if GBP03Y yields climb. SL is ATR(14)x1.5.

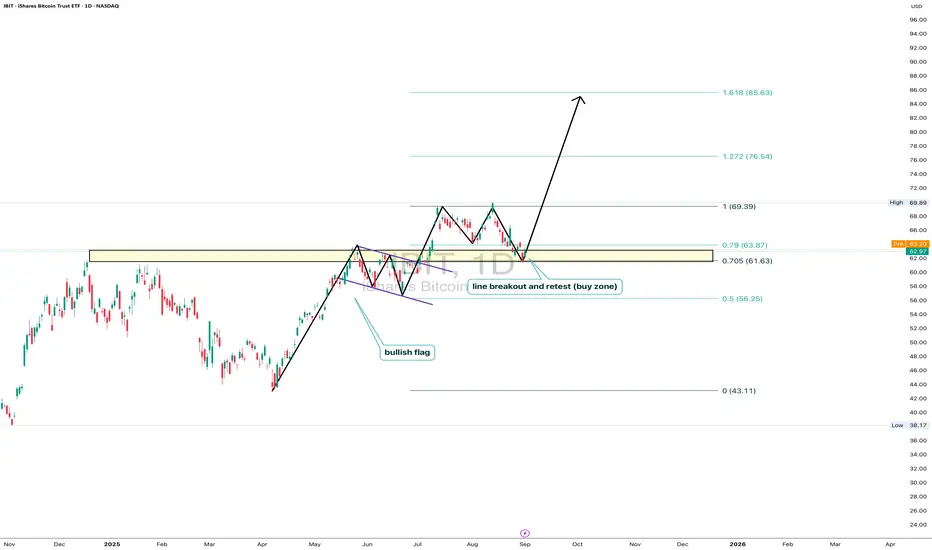
IBIT: ready for liftoffOn the daily chart, iShares Bitcoin Trust (IBIT) trades at $62.97, testing the key 0.705–0.79 Fibo zone ($61.63–63.87). This area marks a breakout and retest line, forming a clear buy zone. The technical structure remains bullish: after breaking out and pulling back, price holds potential to move toward $69.39, with Fibo extensions targeting $76.54 and $85.63. Volumes confirm buyer activity on dips, and the bullish flag pattern supports the continuation of the upward trend.
Fundamentally , the main driver is bitcoin itself, with institutional demand for BTC ETFs staying strong. Large funds continue accumulating positions, while expectations of a softer Fed tone add pressure on the dollar, fueling capital inflows into crypto. This strengthens the bullish case for IBIT.
Tactical plan: watch $61.6–63.8 as the key entry zone. Holding above opens the path toward $69.3, followed by $76.5 and $85.6. The scenario breaks only if price falls below $61.
And let’s be honest: IBIT isn’t just a ticker - it’s the “accelerate bitcoin” button for your portfolio.
Why Bitcoin’s 4-Year Cycle Might Be Its Biggest LimitationFor years, traders have treated Bitcoin’s 4-year halving as sacred — a mechanical driver of boom and bust. But what if the real reason these cycles repeat isn’t the code… but the crowd?
Mechanically, Bitcoin’s issuance schedule is a smooth, predictable decline. The halving simply adjusts the slope of supply — it doesn’t dictate price. Yet, like clockwork, markets rise and fall every four years. Why?
Because we expect them to.
This expectation creates a self-fulfilling feedback loop:
- Pre-halving optimism fuels accumulation and speculative positioning.
- Post-halving euphoria drives parabolic rallies as new participants flood in.
- Overvaluation and leverage eventually unwind, triggering brutal corrections.
The halving became the metronome of market psychology — a narrative so powerful that it shaped behavior more than fundamentals ever did.
🧠 The Institutional Shift
Now, that narrative is being rewritten.
Institutions don’t trade on memes or cycles — they trade on models, liquidity, and risk.
Unlike retail investors, institutions hate volatility. They don’t chase euphoria; they manage exposure.
- ETFs and funds accumulate steadily through structured inflows.
- Option and futures desks hedge risk dynamically, suppressing volatility.
- Algorithmic allocators rebalance based on Sharpe ratios, not halving hype.
This structural participation acts as a volatility dampener — flattening the amplitude of Bitcoin’s historic boom-bust waves.
🌍 From “Halving Cycle” to “Liquidity Cycle”
As Bitcoin matures, the real driver of its price action is shifting away from internal events and toward macro liquidity conditions :
- When global liquidity expands (rate cuts, QE, easing credit), Bitcoin thrives.
- When liquidity contracts (rate hikes, QT, risk-off sentiment), Bitcoin cools.
In this new phase, the halving’s scarcity still matters — but it’s no longer the heartbeat.
Instead, Bitcoin is syncing to the rhythm of global capital flows.
📈 The New Market Identity
We’re watching Bitcoin transition from a reflexive narrative asset to a macro-integrated store of value .
If this continues, the implications are profound:
- Shallower drawdowns and fewer liquidation cascades.
- More consistent accumulation across cycles.
- Higher institutional allocation as volatility compresses.
Ironically, the same psychological loop that once fueled Bitcoin’s meteoric rise may now be what caps its potential.
The halving didn’t make Bitcoin cyclical — investor behavior did .
And as smart money takes over, that feedback loop may finally be breaking.
🚀 What This Might Mean for Future Bull Runs
If institutions continue to dominate Bitcoin’s liquidity, the next bull runs may look less like fireworks and more like steady expansion — smoother, slower, but more sustainable.
Instead of 12-month parabolas followed by multi-year winters, we could see:
- Extended accumulation phases where price grinds higher over longer horizons.
- More efficient corrections that reset leverage without catastrophic selloffs.
- Reduced retail blow-off tops as narrative-based speculation loses power.
That doesn’t mean the explosive upside is gone — it means the path to higher valuations might look more like a compound growth curve than a recurring bubble.
The next phase of Bitcoin’s evolution isn’t about chasing the halving — it’s about understanding liquidity, positioning, and psychology on a global scale.
- The crowd traded Bitcoin like a story.
- Institutions are turning it into a system.

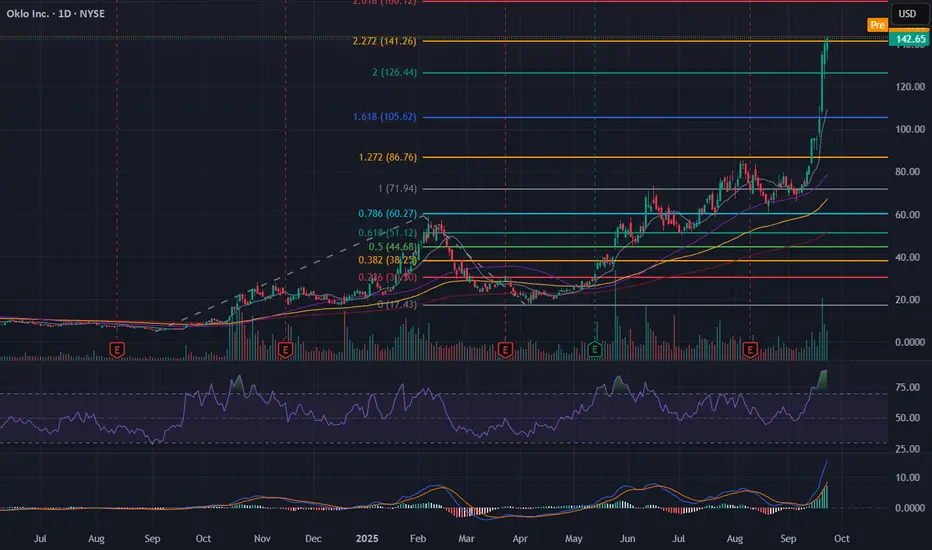
$OKLO - Overvalued?Oklo aims to develop small nuclear power plants and sell electricity under long-term power purchase agreements. The equity is priced ahead of the business: there is no operating revenue before first plant is online.
Business model:
- Revenue is expected to come from selling power under multi-year contracts.
- Key near-term work is design, approvals and site preparation; any slippage extends the cash runway.
Market-implied expectations (at today’s ~$20bn EV):
- On-time delivery of first operating sites by 2027.
- Rapid scale-up thereafter with stable output and healthy GAAP margins under long-dated contracts.
- Limited shareholder dilution.
In short, at today’s valuation the market is paying now for years of smooth execution before the business produces revenue.
Our base-case DCF model (GAAP net income based): equity value ≈ $1.76bn ($11.90/share), compared to a current price of $144/share. The shares screen materially overvalued on fundamentals.
Technicals:
Oklo has reached a key Fib level, where it might start reversing on slowing momentum. Entered a short at $142.
U.K CPI; A catalyst for Sterling appreciation. UIP; 1.08.
SL; 2x ATR (14)
Building on-top of fundamental Sterling appreciation, CPI forecasting to increase even minorly supports the narrative the the BoE might keep rates higher for longer as inflation stickiness appears notable. Paired with the ultra-low CHF. I believe there is some real potential here to capture just shy of a 1.5% change in the GBP/CHF exchange rate.
