Bitcoin Monthly Update + Top Altcoins Choice, Your PickThis is a monthly Bitcoin chart and is really interesting, it supports without a shadow of doubt a strong continuation and bullish bias.
First, the month started red but is now green. This is always a strong signal when the action starts bad but recovers quickly during the month just to end up good. Starts red to end up closing green.
Bitcoin also closed four consecutive months green. This one will be the fifth month. Since the bears already gave everything trying to push prices lower and failed, we know higher prices are guaranteed next.
We also know this because Ethereum just hit its highest price since December 2021, near the top of the last bull market. Now we have Bitcoin, XRP and Ethereum, the top three Cryptos and the biggest projects, moving forward and doing great.
It is only natural. It is the logical sequence, the smaller pairs/projects will do the exact same.
Just as XRP gained in bullish momentum and hit a new all-time high, to follow Bitcoin, Ether did the same. Then we have Solana and Cardano, Dogecoin, Toncoin, Polkadot, Shiba Inu, Avalanche, Notcoin, Chainlink, Bitcoin Cash, Uniswap and the rest.
They are preparing to grow now and are bullish now. Ready to grow and strong.
No more retraces, no more corrections; the 2025 bull market wave & bull run is getting close.
The next immediate target is $137,206. Notice how the $122,630 target on this chart was hit perfectly. So these numbers are good and work long-term.
» After $137,206, Bitcoin is set to hit $155,000.
(Leave a comment with your Top Altcoins Choice, I will do an analysis for you!)
Thank you for reading.
Namaste.
Community ideas

How to Read COT Data: Understanding Big Players’ Order FlowHey whats up traders, today Im going to reveal my COT approach. If you’re serious about finding higher timeframe bias based on what the big players are doing, then COT data is a tool you need to know. It offers unique insights into the positioning of institutional traders—and if read correctly, it can help you align with real market momentum rather than noise.
Before we break it down step-by- step. I want to mention that this is my personal approach. Larry Williams is doing it differently and I have seen some other approaches. This is what works for me, might you find it also usefull.
What Is COT Data?
The Commitment of Traders (COT) report is published every Friday by the CFTC (U.S. Commodity Futures Trading Commission). It shows the open positions of various market participants in the futures markets as of the previous Tuesday.
This data is based on the requirement that large traders must report their positions once they pass a certain threshold. In short, we’re peeking into the order flow of institutions—excluding high-frequency trading and market making noise.
Hope you already recognized small disadvantage to us as retail traders.
Big players report data on Tuesday and it's published on Friday. So we basically have it late and we dont know what has happen in last 3 days. But no worry I will show you my trick how to read between the lines.
COT helps us:
• Understand HTF (Higher Timeframe) bias
• Spot shifts in institutional positioning
• Identify trend continuations or potential reversals
• Avoid getting trapped in retail sentiment traps
It’s not a standalone entry tool, but rather a macro confirmation layer for swing or position trades. Huge advantage by following large players is that they are trading on fundamentals and you dont need to worry about that - you just follow them. But you must follow the right participants, because there is few.
Who Are the Market Participants?
The COT report breaks down traders into several categories. Each one has a different motive and behavior in the market:
1. Commercials
• Think of them as hedgers.
• These are producers, manufacturers, and institutions trying to lock in prices for raw materials or currencies.
• They are usually contrarian at extremes.
When they reach record net long or net short positions, reversals often follow.
2. Non-Commercials (Speculators)
• These are institutional funds, hedge funds, and large speculators.
• Their goal? Profit.
• Often, they follow trends and their positioning reflects the broader market sentiment of the big money.
3. Dealers
• Mostly big banks and institutions facilitating trades.
• They manage risk rather than speculate heavily, so they typically take the opposite side of speculative flows.
4. Leveraged Money
• Hedge funds using high leverage.
• Their positions often reflect short-term speculative behavior.
• Watching their net positioning and changes week-to-week can give clues on momentum exhaustion.
Now you might think which one to follow and Yes you can build your strategy on following any of them fore example
Larry Williams - been trading base on Commercials
Anton Kreil - suggest following Leveraged money
I tried both but for me works best - Non commercials ( Speculators)
Again here you cant say definitely which one is right or wrong. What works for you is right. Thats it.
There are multiple versions of the report, but here are the most commonly used, Im using - ✅ Traders in Financial Futures (TFF)
• Focused on financial markets like forex, bonds, and indexes.
Where to find COT data?
It's free and you can find it on the SEC website there is simple week to week format. As you can see below. Many traders are watching this.
I dont say this is wrong but you dont have complete data - missing big picture.
As you can see here these data below are clearly giving you a picture about an order flow and positioning changedsvn the positions which can confirm trend or help you spot potential reversal you need to watch bigger data sample. Institutions doesnt reverse market in a week, they need to of load positions and I it takes them some time. Which will explain later.
Im collecting the data to the collums. I want see longs, shorts of commercials and from that I calculate. Following
Longs % exposure
Shorts % exposure
Net positions
13 weeks average
Historical Highest positions
Historical Lowest Positions
Relationship between these numbers helps me justify whats going behind the price action, but also spot strong levels. I will show you how to put it together with the context of the charts and then I will show you few order flow patterns examples, it's not difficult but it requires a bit of practice.
Bullish Pattern - Longs growing / Shorts being closed
This is the strongest COT patter and clean sign of buying
This is classing pattern what we have just seen on the EURUSD
Notice how longs has been growing constantly and net positions confirms that.
In may been able to see rapid shorts closing, which and confirmed bullish trend and we can look just for the bullish setups.
Now lets look to the USDJPY chart it will be tricky because it's all red and looks tricky but focus to the numbers and price action, how longs are growing while shorts being closed. Very weak JPY.
Bearish consolidation Shorts being build
Massive shorts being added int he consolidation phase longs doenst move at all. Further big drop coming. This is now happening on the AUDUSD. Look at this tight price consolidation and let's read what is happening. just look at the COT its clean longs around 23K constantly while they are building massive shorts. Whats gonna happens next is clear.
Profit taking move
This ofter occurs when we can see sharp move above the highs but without real longs being added, rather they being closed. As on our example below on the gold. We can see massive profit taking on longs while price was moving up. But they were not been adding shorts. What doest it tell us. They do not want to trade full reversal - not building short position, but market is overheated and they taking profits to buy later for lower or price can go to the consolidation where they will be building short, but definitely its late for us to go long.
Here is another example on USDCHF
Notice longs positions in the moment where there was 46K long and then next week change -12K net. It's a huge change which has started Sell off. But look in to Shorts , there is no heavy shorting, price simply go down based on huge longs profit taking. This is why its important to look in to bigger picture because if you look only in to week to week data. You will still see bigger longs than shorts and it will give you bullish opinion. Hope it's clear. And by the way now we can see 2 weeks with more then +3.4K longs. Its getting bullish IMO.
Now lets look to the another example on the USDCAD
Now we will use one of my past analysis where based on the data I predicted further move. And here I want to mention one thing. Even though we can see COT being bearish. It doesnt mean that price cant go up in short term (can be be 2- 3 weeks) There for you still need to use price action and dont just blindly short, but short run above the highs, because this is where big players add shorts. Not on the lows.
P rice moving up shorts being added - Reversal coming
This is showing positions building for the sell. In this case you can see both growing longs and shorts remember. Big players are hedgers, they are taking longs to move price up so they build shorts. Once they got their positions they close longs and sell of starts.
Lets look to my TV analysis where I have seen shorts grown recently while GBP was moving up close the Monthly Order block , but notice the shorts colum how the shorts were growing recently and also longs dropped from 110K to 100K.
Clena signs of the reversal but again I waited for a pullback above the weekly highs. Click to open a chart bellow
This was a prediction from few week ago. Now let's look how the data looks right now. On the GBPUSD chart below we can see reveal in the data. Long significantly dropped by 50% and shorts increased by 50%. This is a clean reversal pattern in the COT. Look at net positions it clearly flipped to the bearish and big drop is coming.
Few more tips
Remember they know we are watching this data and what we see is what they want us to see, so they are often trying to hide their positions as long as possible. Thats why intra-week reversal are happening on Wednesday after they report their positions.
They cannot hide the data forever, follow the data week by week to keep in track whats happening. It will increase your winning ratio.
Every 3 months there is a new futures contract. The must close the positions and reopen them in to the new contract, They are using it for reversals.
Also some if there is some US holidays on the day when report should be released to the public its delayed to the next week. And thats when they do biggest positions changes secretly.
COT data isn’t a magic crystal ball—but it’s a powerful tool if you know how to combine it with technical analysis. You need to use your mechanical system. It perfectly fits with my CLS strategy and It's suitable for swing traders.
Think outside the box. Even when you see bearish COT - dont be stupid to sell low. It's not NOD order flow for intraday scalping, you have time. But if you something is clearly bearish every run above weekly and daily highs is high probability Sell in the smart money trend.
Dont hesitate to ask any questions and follow. I share COT weekly updates.
“Adapt what is useful. Reject whats useless and add whats is specifically yours.”
David Perk aka Dave FX Hunter

Candle patterns that help you always WinHello everyone, if you are struggling to identify price zones, entry points, or simply want to predict the trend of any currency pair, then this article is for you.
I will divide it into several parts, and today we will cover some common patterns — so grab a pen and paper to take notes!
First pattern: ASCENDING TRIANGLE
The ascending triangle is considered a bullish continuation pattern. In order to locate it, we will observe more than one ascending peak. To draw this pattern, a horizontal line (the resistance line) must be placed above the resistance points, and an ascending line (the uptrend line) must be drawn along the support points.
Second pattern: FLAG
The flag pattern is used to identify the possible continuation of a previous trend from a point where the price has drifted against that same trend. If the trend resumes, the price rise could be rapid, making the timing of a trade advantageous when noting the flag pattern.
If you think you have seen a flag to trade, the most important thing is the fast and steep price trend. If the price slowly rises and falls below the flag, you'd better not trade at that time.
3. CUP AND HANDLE
The cup and handle pattern on the price chart resembles a cup with a handle, where the cup is u-shaped and the handle has a slight downward slope.
The cup forms after an upward move and looks like a bowl or rounded bottom. As the cup is completed, a narrow price range develops on the right side and the handle is formed. A subsequent breakout of the trading range that forms the handle indicates a continuation of the previous upward move.
4. DOUBLE BOTTOM
The trajectory of the asset price within the formation of the model resembles the letter "W". The last two price lows, located at approximately the same level, is an area of strong support, in which twice performs an upward price reversal.
When the market price breaks the resistance level of the pattern, the formation of the pattern is complete. The sell signal appears and a change in the trend direction is expected.
5. INVERSE HEAD AND SHOULDERS
This pattern is identified when the price action of a security meets the following characteristics: the price falls to a low and then rises; the price falls below the previous low and then rises again; finally, the price falls again, but not as much as the second low. Once the final low is reached, the price heads upward toward resistance near the top of the previous apexes.
6. ROUNDING BOTTOM
The rounding bottom pattern looks similar to the cup and handle pattern, but does not experience the temporary downward trend of the "handle" portion.
The initial downward slope of a rounding bottom indicates oversupply, which forces the stock price down.
The move to an uptrend occurs when buyers enter the market at a low price, which increases demand for the stock. Once the rounded bottom is completed, the stock breaks out and will continue in its new uptrend.
7. TRIPLE BOTTOM
The Triple Bottom pattern is similar in appearance to the Inverse Head and Shoulders pattern, in that it is represented by a series of three highs and lows.
The difference is that the three highs of the Triple Bottom will have approximately the same height, whereas in the Inverse Head and Shoulders pattern, the second low is lower than the first and third lows.
The appearance of the Triple Bottom indicates the existence of a downtrend, which is currently in the process of reversing into an uptrend.
And here are some classic bullish patterns. In the next parts, I will cover bearish patterns, how to read candlesticks, and technical indicators.
If you find this interesting and useful, please leave me a like and a comment to keep me motivated!
Now, are you ready to trade? Remember and practice these patterns — you’ll soon become a true professional.
Good luck!
Kevinn_Nguyen.
GOLD 1H CHART ROUTE MAP UPDATE & TRADING PLAN FOR THE WEEKHey Everyone,
Please see our updated 1h chart levels and targets for the coming week.
We are seeing price play between two weighted levels with a gap above at 3403 and a gap below at 3377. We will need to see ema5 cross and lock on either weighted level to determine the next range.
We will see levels tested side by side until one of the weighted levels break and lock to confirm direction for the next range.
We will keep the above in mind when taking buys from dips. Our updated levels and weighted levels will allow us to track the movement down and then catch bounces up.
We will continue to buy dips using our support levels taking 20 to 40 pips. As stated before each of our level structures give 20 to 40 pip bounces, which is enough for a nice entry and exit. If you back test the levels we shared every week for the past 24 months, you can see how effectively they were used to trade with or against short/mid term swings and trends.
The swing range give bigger bounces then our weighted levels that's the difference between weighted levels and swing ranges.
BULLISH TARGET
3403
EMA5 CROSS AND LOCK ABOVE 3403 WILL OPEN THE FOLLOWING BULLISH TARGETS
3422
EMA5 CROSS AND LOCK ABOVE 3422 WILL OPEN THE FOLLOWING BULLISH TARGET
3439
BEARISH TARGETS
3377
EMA5 CROSS AND LOCK BELOW 3377 WILL OPEN THE FOLLOWING BEARISH TARGET
3354
EMA5 CROSS AND LOCK BELOW 3354 WILL OPEN THE FOLLOWING BEARISH TARGET
3329
EMA5 CROSS AND LOCK BELOW 3329 WILL OPEN THE SWING RANGE
3304
3281
As always, we will keep you all updated with regular updates throughout the week and how we manage the active ideas and setups. Thank you all for your likes, comments and follows, we really appreciate it!
Mr Gold
GoldViewFX

The 50/50 Account Management Scam- How it WorksFrom Cold Calling to Telegram
I’ve been in the markets for so long I feel like a dinosaur, and I’ve probably seen every scam out there.
The truth is, none of them are really new — they’re just adapted to the new social paradigm.
What was done in the 2000s through cold calling is now done through Telegram, Instagram, X, and other social platforms.
I didn’t really want to write this article, in case it gave someone ideas.
But since anyone who wants to be a scammer already knows how it works, maybe this article can warn those who still have no idea how the so-called account management scam operates — especially its most common form: the coin flip scam (50/50 scam, Opposite trades scam, Split-direction scam, Two-group margin call trick, as is also known)
Step-by-Step: How the Coin Flip Scam Works
1. Gathering the victims
The scammer starts by fishing for victims through Telegram channels/groups, Instagram profiles, Facebook groups, or even X posts.
They present fabulous profits, post ads with guaranteed return offers, and flood the feed with so-called “proofs” — screenshots of winning trades, client testimonials, and account statements. Most of these are either fabricated or selectively chosen to show only the winning side.
Once someone shows interest, the scammer’s first move is to earn their trust.
They’ll tell you the broker doesn’t matter, that you can choose it, and that they have no access to your money — which is, technically, true.
Then comes the closer:
“You don’t have to pay me upfront. I only get paid if I make you money, so it’s in my best interest not to lose. You see? We’re on the same side.”
This combination of flashy results and “risk-free” terms makes you feel safe enough to hand them trading access.
________________________________________
2. Splitting into two groups
The accounts are divided into two equal batches:
• Group A → All-in BUY
• Group B → All-in SELL
With high leverage (e.g., 1:200), a 50-pip move means either doubling the account or wiping it out completely.
Note: I won’t go too deep into the details here, because the exact margin call level depends on the broker. But trust me, it’s easy for a scammer to plan the money split based on the different brokers’ rules. What we’re talking about here is just the general principle.
________________________________________
3. Guaranteed winners and losers
The market moves.
One group hits margin call and loses, while the other doubles or triples its capital (depending on broker's leverage, even more on 1:500).
The scammer now has perfect marketing material: “Look how I doubled my client’s account!”
________________________________________
4. Milking the winners
Clients who made a profit are celebrated and told something like:
“I only worked with low capital this time just to show you I can do it. I have big clients and serious strategies — now that you’ve seen the proof, deposit more so we can make real money.”
The scammer frames the initial gain as a “demo run” to gain the client’s confidence, pushing them to commit much larger sums next.
________________________________________
5. Recycling the losers
The wiped-out clients are told:
“It was an unusual market move. Deposit another $1,000 and we’ll recover it tomorrow.”
Some quit, but others fall for it again.
________________________________________
6. Repeat the process
The cycle continues. There’s always a “happy” group and real account statements to attract fresh victims, while the losers are quietly discarded or convinced to reinvest.
________________________________________
Why the scam works
• The proof are authentic – Screenshots and MT4/MT5 statements for the winners are real.
• Survivorship bias – Prospects only see the successes, never the failures.
• Hope psychology – Losers believe “next time” will be different (and it can be if they end up in the "winner group" next time
________________________________________
Final word
If someone promises to double your account quickly and safely — walk away.
Real trading is about risk management and long-term consistency, not betting your capital on a 50/50 gamble.
Don’t be the next screenshot in a scammer’s sales pitch. 🚀
P.S.
Stop believing they “made you money on purpose” at the beginning and then “lost it on purpose” after you deposited more.
If they truly had the skill to do that, they wouldn’t need to be scammers in the first place.
The reality is simple — once you put in more money, you just happened to land on the losing side of their scam.

XRPUSDTHello Traders! 👋
What are your thoughts on RIPPLE ?
On the XRP chart, we can see that after breaking the descending trendline and reaching a resistance level, the price has entered a corrective phase.
We expect this correction to continue down toward the support zone, which coincides with the ascending trendline. This area also represents a pullback to the previously broken bearish trendline.
Once the pullback is complete, we anticipate a bullish continuation toward higher targets.
Don’t forget to like and share your thoughts in the comments! ❤️

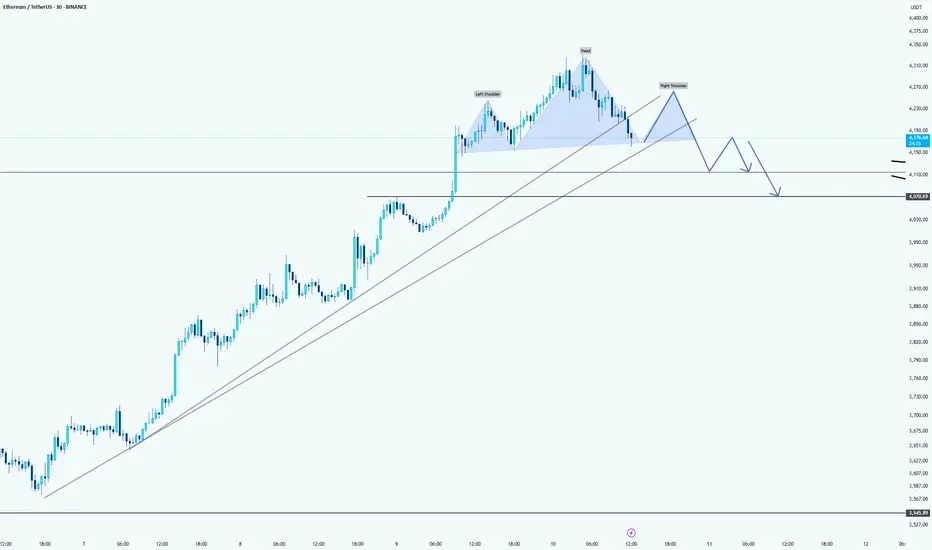
Ethereum: just a little bit correction hereHello guys!
Chart Pattern: Head and Shoulders
The chart shows a Head and Shoulders pattern forming on the Ethereum price action. The trendline drawn across the neckline of the pattern is a crucial support level to monitor.
Potential Breakdown:
If Ethereum fails to hold above the neckline (around $4,130), we might see a pullback and potentially a breakdown from the pattern. This suggests a bearish outlook for ETH in the short term.
Target:
A possible target for this bearish move could be around th e $4,050 - $4,100 range , where the price could find support from the upward trendline (in light gray). The price may retrace towards these levels before deciding whether it will continue higher or confirm further downside.
Uptrend Support:
Ethereum remains in an overall uptrend, as indicated by the sloping upward trendline beneath the price action. If the price pulls back to this trendline and holds, there could still be bullish potential.
XRPUSDT - Time to be bearish!!Did you know that the XRP chart has turned bearish and is looking pretty grim?
A lot of indicators are pointing in that direction right now.
It recently formed a triangle pattern, broke out, rallied, and hit a new ATH — which coincided with the fifth and final wave of the Elliott Wave impulse.
Now it has shifted into an ABC corrective structure, and wave B seems to have completed, setting the stage for the main corrective move with wave C, which is expected to deliver around a 30% pullback from this point.
Another red flag for me is that XRP barely managed to break into a new ATH, only to quickly reverse and is now retesting the previous ATH, which lines up with the 1.00 Fibonacci level. Based on this, I strongly expect a major correction in XRP from here.
Sure, a lot of die-hard XRP believers won’t like this take — but let them ride it down. You can always buy back cheaper, my friend.
take a look to this post
As I told you earlier in a previous post, I recommended buying it at that time(3 months ago), which was the perfect entry. It has now risen by 50%, so I’m telling you to sell if you still hold it.
Best regards:
Ceciliones🎯

GOLD WEEKLY CHART MID/LONG TERM ROUTE MAPHey Everyone,
Weekly Chart Update = Gap Completed, Levels Playing Out Perfectly
Just a quick follow up on the ongoing weekly structure, the precision in level respect continues to be impressive, with price action unfolding exactly as we’ve been mapping.
After the previous bounce from 3281, price moved cleanly back up and completed the gap at 3387 last week, exactly as projected in last weeks post. This time, we now have a candle body close above 3387, which changes the dynamic and leaves 3482 open as a long term upside target. An EMA5 lock from here would further confirm the breakout potential.
Updated Structural Notes:
🔹 3281 Support Holds Again
Textbook reaction. Once again, 3281 provided the perfect launch point, reinforcing its strength as a key weekly pivot.
🔹 Gap at 3387 Completed
Price didn’t just revisit 3387, it closed above it on the weekly candle body. This shifts the bias toward potential breakout continuation rather than another immediate rejection.
🔹 3482 Now on the Radar
With 3387 cleared on a closing basis, the next major upside objective becomes 3482, aligning with the broader channel structure and unfilled weekly target. EMA5 confirmation on the long side could accelerate this move.
Updated Levels to Watch:
📉 Support – 3281
Key long-term pivot and buy zone. As long as this holds, dips remain constructive.
📈 Resistance Turned Support – 3387
Now potentially acting as a base. Watching retests here for hold confirmation.
📈 Upside Target – 3482
Primary long-term resistance now in focus if 3387 support holds and momentum sustains.
Plan:
The breakout above 3387 opens a new chapter for this range. We now watch for confirmation that 3387 has flipped to support. Holding here keeps 3482 firmly in play, while any decisive break back below could send us rotating toward 3281 again. Structure still leads, but bias shifts bullish with this weekly close.
Thanks as always for your continued support.
Mr Gold
GoldViewFX

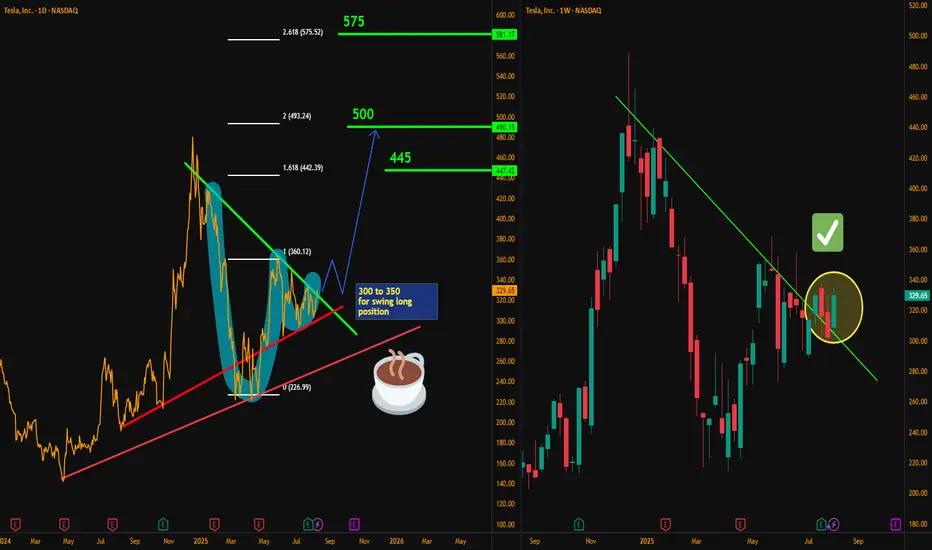
Tesla Roadmap: From $300 Zone to $575Hello traders, here’s my latest analysis on Tesla (TSLA) based on the weekly and daily timeframes. On the weekly chart, I have drawn a downtrend line starting from December 2024, and the recent price action shows a breakout above this line on a weekly close. This breakout is a promising sign that an uptrend may be developing in the medium term.
On the daily chart, we can see a cup & handle pattern forming, which is a bullish continuation structure. However, the daily downtrend drawn from the December 2024 highs remains unbroken, so I will need to see a weekly close above the $332 resistance level to confirm a swing long setup.
My preferred positioning zone for longs is between $300 and $350, using a multi-entry approach to average into the trade. My upside targets are $366, $445, $500, and finally $575. These levels align with inverse Fibonacci projections, with “safety 1” at $360 and “0” at $227, pointing toward the 161, 200, and 261 extensions as key objectives.
For stop-loss placement, patient traders who are willing to hold through volatility may consider a weekly close below $265 as their invalidation point. For faster or more short-term oriented traders, a weekly close below $300 could be used as a tighter stop level. Although I believe it is unlikely for price to drop this far, even if it does, I expect strong buying interest and a potential rebound from the $265 support zone.
Risk management remains crucial for this setup. I recommend not risking more than 10% of your capital, scaling in over multiple entries, and always confirming with your own strategy before committing to the trade. Position sizing and discipline will be key to managing volatility and protecting capital.
NASDAQ:TSLA
GOLD DAILY CHART ROUTE MAPHey Everyone,
Daily Chart Update
Another Clean Rejection: Structure Still Dominates
Following up on the recent price action last week, the 3372 support level continued to provide support aligned perfectly with the channel half-line, giving us the bounce that continued all the way up to 3409, just short of the 3433 resistance, which once again remains open for a potential test.
We remain in the same structured range, with price still rotating between 3272 and 3433, a 170+ pip zone that continues to deliver high-probability trade setups.
Here’s where we are now:
🔹 Range Still Active
Price is respecting the 3272–3433 boundaries with precision. Until we get a decisive break and hold outside this range, range bound strategies remain in play.
🔹 No Breakout = Clean Rejection
The failure to sustain above 3433 confirms resistance is still valid. We're watching EMA5 for potential breakout confirmation, until then, the bias stays neutral within the range.
🔹 Channel Half-line Bounce
That rejection into 3272 also matched the channel half line, and the bounce there further cements this area as critical support. The latest rally to 3397 reinforces the strength of this pivot.
Updated Key Levels
📉 Support – 3272
Still the major pivot. Buy zones remain valid here unless we see a confirmed breakdown.
📈 Resistance – 3433
Now clearly tested and rejected more than once. Any clean break and hold above could change the dynamic, but until then, it’s solid resistance with 3397 as support.
Thanks as always for your support.
Mr Gold
GoldViewFX

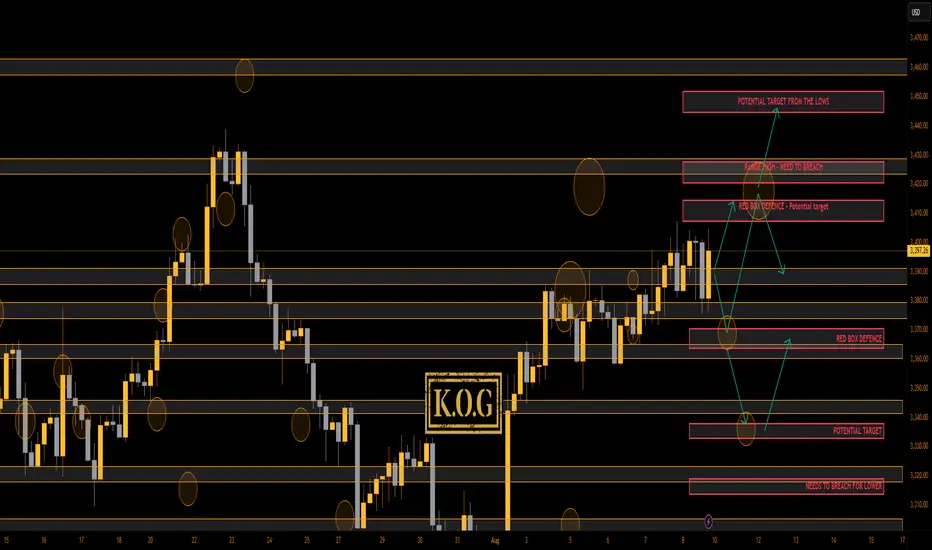
THE KOG REPORT THE KOG REPORT:
In last week’s KOG Report we shared the NFP chart and the KOG Report chart for the wider community. We said we would be looking for price to support below at the red box and then push upside into the higher levels and the red box targets. We also suggested the shorting region and the target level for that trade which as you can see worked well playing level to level, point to point. We also completed all of our target levels without the breach and even though it was choppy, we completed numerous Excalibur targets in Camelot.
A decent week not only on Gold but also the other pairs we trade an analyse.
So, what can we expect in the week ahead?
I have indications of higher pricing, however, how low can the take it before they then attempt higher? For that reason, let’s stick with the 4H as this the most effective for our strategy and analysis and lets look at the key levels!
We have the level above 3408-11 which is a reasonable target for this move, but there is red box defence there which will need to be attempted and broken to go higher. If we resist at that level with extension level 3430-5, there is a chance we can correct the move all the way back down into the 3350-40 levels before we again get an opportunity to capture that long trade!
We have no news tomorrow so again, more of a chop and ranging price action is on the cards, with the support level being 3375-70 for the Asian session and resistance being the 3408-11 level. My Red box indi’s are stretched, my daily liquidity indicator is stretched, so I would say please play caution on the markets as they are extremely fragile at the moment.
KOG’s Bias for the week:
Bullish above 3365 with targets above 3408, 3410, 3415 and above that 3420
Bearish below 3365 with targets below 3359, 3355, 3350 and below that 3345
RED BOX TARGETS: (You can see how effective these are so please make use of these together with the analysis and bias we share. It all goes together, without PRICE ACTION knowledge you only have hope)
Break above 3406 for 3407, 3410, 3420, 3429, 3430 and 3435 in extension of the move
Break below 3395 for 3393, 3385, 3380 and 3370 in extension of the move
Please do support us by hitting the like button, leaving a comment, and giving us a follow. We’ve been doing this for a long time now providing traders with in-depth free analysis on Gold, so your likes and comments are very much appreciated.
As always, trade safe.
KOG
GOLD 4H CHART ROUTE MAP UPDATE & TRADING PLAN FOR THE WEEKHey Everyone,
Please see our updated 4h chart levels and targets for the coming week.
We are seeing price play between two weighted levels with a gap above at 3424 and a gap below at 3371. We will need to see ema5 cross and lock on either weighted level to determine the next range.
We will see levels tested side by side until one of the weighted levels break and lock to confirm direction for the next range.
We will keep the above in mind when taking buys from dips. Our updated levels and weighted levels will allow us to track the movement down and then catch bounces up.
We will continue to buy dips using our support levels taking 20 to 40 pips. As stated before each of our level structures give 20 to 40 pip bounces, which is enough for a nice entry and exit. If you back test the levels we shared every week for the past 24 months, you can see how effectively they were used to trade with or against short/mid term swings and trends.
The swing range give bigger bounces then our weighted levels that's the difference between weighted levels and swing ranges.
BULLISH TARGET
3424
EMA5 CROSS AND LOCK ABOVE 3424 WILL OPEN THE FOLLOWING BULLISH TARGETS
3499
EMA5 CROSS AND LOCK ABOVE 3499 WILL OPEN THE FOLLOWING BULLISH TARGET
3561
BEARISH TARGETS
3371
EMA5 CROSS AND LOCK BELOW 3371 WILL OPEN THE FOLLOWING BEARISH TARGET
3293
EMA5 CROSS AND LOCK BELOW 3293 WILL OPEN THE SWING RANGE
3236
3171
EMA5 CROSS AND LOCK BELOW 3171 WILL OPEN THE SECONDARY SWING RANGE
3089
3001
As always, we will keep you all updated with regular updates throughout the week and how we manage the active ideas and setups. Thank you all for your likes, comments and follows, we really appreciate it!
Mr Gold
GoldViewFX

Gold (xauusd): still bullishHello guys!
Price is moving inside an ascending channel.
Recently bounced from mid-channel support (“last kiss”) and heading toward channel resistance.
Potential upside target: $3,435 zone.
As long as the price stays above mid-line support, bullish momentum remains intact.

Lingrid | GOLD Weekly Price Outlook: Uptrend AccelerationOANDA:XAUUSD continues attracting significant buying interest as bulls successfully penetrated key resistance levels during the week. The market demonstrates resilience with bulls consistently stepping in during any price declines, suggesting an ongoing upward trajectory ahead.
The 4H timeframe shows gold trading within a defined channel, with price action completing an A-B-C corrective movement before breaking through the downward-sloping resistance trendline. The breach above the $3,370 level signals a potential shift in momentum, with the upward trendline now providing dynamic support. The resistance zone around $3,450-3,460 remains the next critical target.
The longer-term perspective highlights an ascending triangle pattern with multiple tests of the resistance band near $3,450. Gold price has risen approximately 40% from where they stood one year ago, reflecting extraordinary momentum. Each test of resistance has been met with renewed buying pressure, indicating strong underlying demand.
On the long-run price action suggest price could average $3,650 by Q4 2025, with potential for $4,000 by mid-2026. Central banks purchased over 400 metric tons in the first half of 2025, providing fundamental support beneath current technical developments.
The breakout above established resistance, combined with the ascending triangle formation and persistent institutional demand, suggests gold remains positioned for continued strength. We should monitor the $3,370 level as new support, with upside targets extending toward $3,500 and beyond.

GOLD (XAUUSD): Support & Resistance Analysis For Next Week
Here is my latest support & resistance analysis for Gold
Support 1: 3380 - 3390 area
Support 2: 3327 - 3358 area
Support 3: 3246 - 3275 area
Resistance 1: 3431 - 3450 area
With a high probability, the market will continue rising to Resistance 1.
❤️Please, support my work with like, thank you!❤️
I am part of Trade Nation's Influencer program and receive a monthly fee for using their TradingView charts in my analysis.

AUDUSD: Gold Breakout & DXY Resistance Could Fuel Bulls!!Hey Traders,
In tomorrow’s session, we’re eyeing a buying opportunity on AUDUSD around the 0.65100 zone. The pair remains in an uptrend and is currently in a correction phase, approaching a key support level at 0.65100.
We’re also keeping a bullish bias on Gold, which is attempting to break and hold above 3,400. Given the positive correlation between Gold and AUDUSD, this could lend additional upside momentum to the pair.
Meanwhile, the DXY is approaching the 98.300 resistance. A rejection from this level could serve as a strong catalyst for AUDUSD bulls.
Trade safe, Joe.


ETH - Eyes on a New All-Time High?ETHUSDT has been on fire lately, following a textbook bullish structure of Impulse → Fakeout → Impulse.
After breaking above the previous range in July, ETH confirmed strength with a sharp impulse move, only to shake out weak hands via a fakeout retest before pushing higher again. 📈
Currently, ETH is in the midst of another impulsive leg, with the next major target sitting at the ATH around $4,876.
📊 Key Notes:
- Fakeouts have served as liquidity grabs before strong rallies 🏹
- Current momentum favors the bulls 🐂
- As long as price holds above the last breakout zone (~$4,050–$4,150), the path of least resistance remains up.
🎯 Next Stop: ATH and beyond if bullish pressure sustains.
📚 Always follow your trading plan regarding entry, risk management, and trade management.
Good luck!
All Strategies Are Good; If Managed Properly!
~Richard Nasr

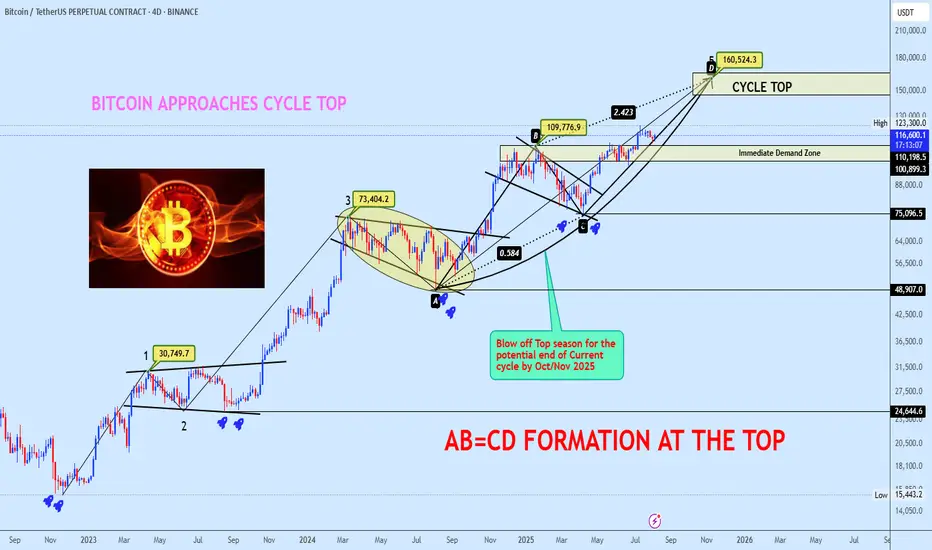
Bitcoin Approaches Cycle Top with AB=CD Completion in SightBTCUSDT continues its bullish macro structure, now advancing towards the projected cycle top zone at $160,524, completing a textbook AB=CD harmonic formation. The BC leg retraced precisely 0.584 of AB, aligning with a 2.423 CD extension, confirming a strong harmonic symmetry.
Price is currently trading around $116,569 after breaking through key resistance levels, with the Immediate Demand Zone resting at $110,198. This zone will act as the first major defense level if a short-term correction occurs.
Market structure suggests a potential blow-off top formation into October/November 2025, marking the probable end of the current cycle. Do check out our Bitcoin lifecycle thread for clarity on the reason for picking cycle top.
POTENTIAL BITCOIN LIFECYCLE
Deciphering Bitcoin's Cyclical Trends & Phases
Momentum remains firmly bullish, with the upward curve indicating buyers remain in control until exhaustion patterns emerge near the cycle projection zone.
Plan: Hold long positions into strength, scale out as BTC approaches the $160K cycle top zone, and prepare for a potential macro reversal as the cycle matures. Monitor lower timeframes for divergence signals as we approach the final leg.
If this structure aligns with your outlook, feel free to share your thoughts in the comments.
You’re also welcome to drop your preferred altcoins for a quick technical review.
OG more than 4 years of accumulation!OG / USDT
Price is playing in long term accumulation between 2$ as support and 14$/16$ as resistance
Every time price hit resistance zone it rejected hard but once again we see another try to breakout with big volume
Breakout here and we will see fireworks
Keep an eye on it

Mistakes Cost Real Money, In trading world In the crypto market, a mistake is not just a note on paper, it’s money leaving your pocket.
Sometimes you need to lose money to feel the real lesson.
If you learn from it, that loss can make you a better trader.
Hello✌️
Spend 2 minutes ⏰ reading this educational material.
🎯 Analytical Insight on Bitcoin:
BINANCE:BTCUSDT is showing strong volume near solid daily support and a key trendline. A 5% rally toward $124k is anticipated 🚀📈
Now , let's dive into the educational section,
💸 Mistakes You Must Make
Some mistakes are part of the process.
When you hit a stop loss or see a big loss, you understand risk much better.
These mistakes show you why you must always have a plan.
Lessons from losing real money stay in your mind much longer than lessons from books or videos.
🔍 Risk Management and Fundamental Researc h
Spot trading gives you more time to fix mistakes than futures, but losing money here can still teach you a lot.
When you lose some of your capital, you see why stop loss and take profit are important.
Researching the team, roadmap, and trading volume can save you from bad projects.
Managing your capital makes sure one bad trade doesn’t destroy your account.
🪞 How Market Emotions Affect You
Your emotions often reflect the overall mood of the market.
When everyone is greedy, you may feel unjustifiably excited.
When everyone is fearful, you might miss great opportunities.
Learning to separate your mind from crowd emotions is one of the hardest yet most crucial skills.
🧠 Demo Account vs Real Account
In a demo account, you are only playing with numbers.
In a real account, you are dealing with your own emotions, fear, and greed.
When real money is involved, even a small price move can make your heart race.
This is why, after learning and practicing for months, you should start real trading with very small money.
Only then will you know what risk feels like in real life.
🕰 Why Patience Matters
Many losses happen because of rushing, not because of a bad strategy.
Sometimes waiting a few more minutes can give you a clear view of the market.
The market always gives another chance, but lost money is hard to get back.
🎯 Why You Need a Trading Journal
Writing down your entry, exit, and feelings for every trade helps you see your mistakes and strengths.
A trading journal is like a second memory that stops you from making the same mistake again.
📊 Useful Tools in TradingView
One of TradingView’s biggest advantages for traders is its set of tools that can save you from costly mistakes.
For example, with the Price Alert tool, you can get notified before the price reaches critical levels, helping you avoid emotional decisions.
Indicators like the Relative Strength Index (RSI) or Moving Average Convergence Divergence (MACD) help you detect weaknesses in your strategy before execution.
Drawing support and resistance lines repeatedly trains you to know where price might reverse in a crisis.
Fibonacci Retracement is an excellent way to spot potential reversal levels, especially during unexpected corrections.
Volume Profile shows where the highest buying and selling activity has occurred, helping you avoid weak entry zones.
⚖️ Balance Between Learning and Doing
Reading books or watching videos is not enough.
Trading without knowledge is also dangerous.
You must grow your knowledge and experience at the same time.
Summary
In crypto trading, mistakes are normal, but repeating them is your choice.
If you learn from a loss, it is worth it.
Start small, use your tools, and let experience make you stronger.
✨ Need a little love!
We pour love into every post your support keeps us inspired! 💛 Don’t be shy, we’d love to hear from you on comments. Big thanks , Mad Whale 🐋
📜Please make sure to do your own research before investing, and review the disclaimer provided at the end of each post.

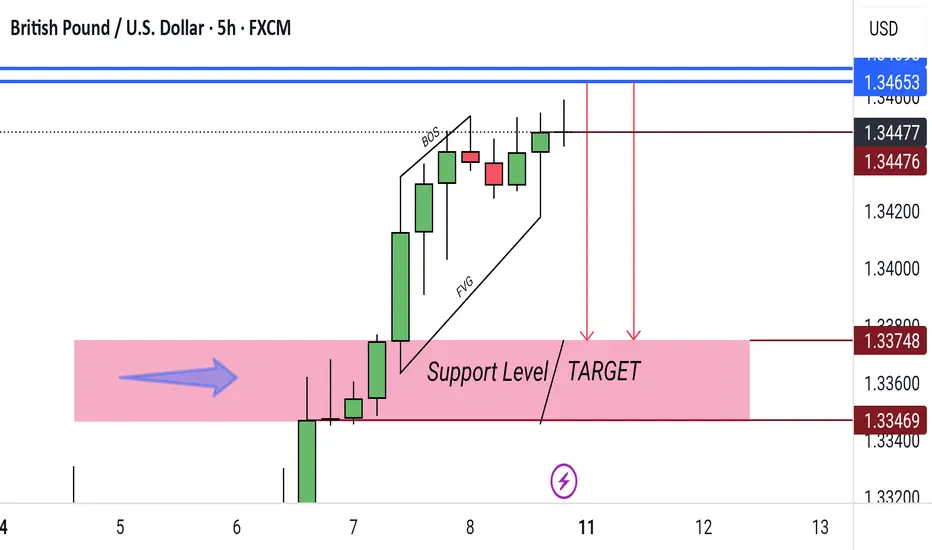
GBP/USD 5H – Bearish Reversal Towards Support ZoneGBP/USD 5H – Price is testing resistance near 1.3465 after a bullish move. A drop towards the 1.3375–1.3346 support zone (target) is anticipated.
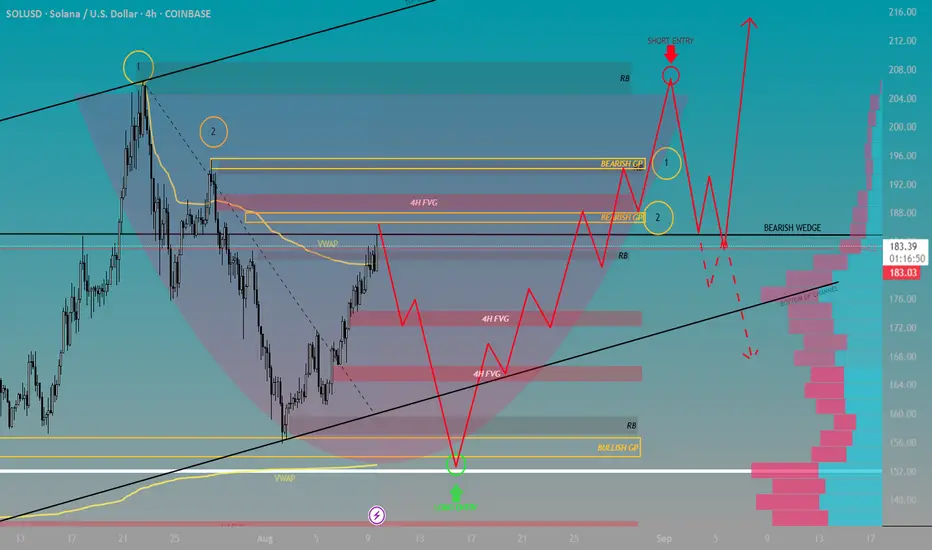
Solana Presents Multiple Opportunities on the HorizonContext 1:
Support: $125.50
Resistance: $185.00
Psychological Levels: $150.00 and $190.00
Context 2:
Technical Structure 1: We are in a bearish wedge that has formed the beginning of a bearish channel that has tested support 3 times and tested resistance 4 times.
FVG’s:
FVG Confluence 1: One bearish 4H FVG located bove price. 3 bullish 4H FVG located below price.
Golden Pocket: Sits right below 4H FVG and aligns with the $190.00 Psychological level. Strong confluence.
Context 3:
Volume Insight: Volume Indicator shows a spike in volume from psych level $150.00 and $155.00. Aligning with the POC and a Rejection Block located right above the 0.65 fibbonacci level.
Bullish Scenario: With multiple confluence at the $150.00 psych level, price sweeps the previous low as it bounces off the lower anchored VWAP. This will lead to a completion of a Cup and Handle formation producing enough momentum for a breakout of the Bearish Wedge.
Bearish Scenario: Above the $200.00 psych level remains a Rejection Block. Sweeping this area may lead to enough liquidation to push us back within the Bearish Wedge and allow for a breakout towards the POC.