USD/JPY Shows Sharp Decline – Wave 3 of Bearish Impulse in PlayAfter hitting January 2025 highs, USD/JPY reverses sharply, signaling potential further downside while a corrective wave rally may provide resistance near 154–155.
USD/JPY is pulling back sharply after reaching the January 2025 high resistance within the 5th wave of its previous bullish cycle. This reversal is not unexpected, and the current strong downward extension appears to be wave 3 of a five-wave bearish impulse, suggesting there could still be room for further weakness.
Traders should, however, be cautious of a potential wave 4 corrective rally, which could push the price back toward the recently opened gap and the former swing lows and highs in the 154–155 area, a zone likely to act as resistance in the coming days.
Overall, the structure indicates a continuation of the bearish trend after the corrective phase, so monitoring for retracements and key resistance levels will be essential for positioning.
Community ideas

GBP/AUD BEST PLACE TO BUY FROM|LONG
Hello, Friends!
GBP/AUD pair is trading in a local downtrend which we know by looking at the previous 1W candle which is red. On the 4H timeframe the pair is going down too. The pair is oversold because the price is close to the lower band of the BB indicator. So we are looking to buy the pair with the lower BB line acting as support. The next target is 1.970 area.
Disclosure: I am part of Trade Nation's Influencer program and receive a monthly fee for using their TradingView charts in my analysis.
✅LIKE AND COMMENT MY IDEAS✅

USDJPY H4 | Bearish ContinuationThe price has rejected off our sell entry level at 154.04, which is a pullback resistance that is slightly above the 23.6% Fibonacci retracement.
Our stop loss is set at 155.20, which is a pullback resistance that is slightly above the 38.2% Fibonacci retracement.
Our take profit is set at 151.66, which is a swing low support.
High Risk Investment Warning
Stratos Markets Limited fxcm.com Stratos Europe Ltd fxcm.com
CFDs are complex instruments and come with a high risk of losing money rapidly due to leverage. 69% of retail investor accounts lose money when trading CFDs with this provider. You should consider whether you understand how CFDs work and whether you can afford to take the high risk of losing your money.
Stratos Global LLC fxcm.com Losses can exceed deposits.
Please be advised that the information presented on TradingView is provided to FXCM (‘Company’, ‘we’) by a third-party provider (‘TFA Global Pte Ltd’). Please be reminded that you are solely responsible for the trading decisions on your account. Any information and/or content is intended entirely for research, educational and informational purposes only and does not constitute investment or consultation advice or investment strategy. The information is not tailored to the investment needs of any specific person and therefore does not involve a consideration of any of the investment objectives, financial situation or needs of any viewer that may receive it. Past performance is not a reliable indicator of future results. Actual results may differ materially from those anticipated in forward-looking or past performance statements. We assume no liability as to the accuracy or completeness of any of the information and/or content provided herein and the Company cannot be held responsible for any omission, mistake nor for any loss or damage including without limitation to any loss of profit which may arise from reliance on any information supplied by TFA Global Pte Ltd.
Stratos Trading Pty. Limited fxcm.com
Trading FX/CFDs carries significant risks. FXCM AU (AFSL 309763), please read the Financial Services Guide, Product Disclosure Statement, Target Market Determination and Terms of Business at fxcm.com

SPX500 H1 – Supply Zone Rejection | Bearish Sell Setupon the SPX500 H1 timeframe, price has respected the previous Supply zone and is currently showing signs of stalling or rejection.
The RSI is around 59, indicating overbought conditions and building bearish pressure. If the market shows bearish momentum from this level and the structure weakens, the sell setup active.
Confirmation for the sell includes rejection from the Supply zone, RSI shifting from overbought toward downside, and bearish candles or momentum confirmation. The first target is 6890.0 (H1 Order Block) and the final target is 6840.0 (major downside liquidity)
Disclaimer:
This analysis is for educational purposes only. It is not financial advice. Trading involves risk, so always do your own research and manage risk properly before taking any trade.

Natural Gas - Back to a Key AreaNatural Gas is now retesting the gap, and this is happening right on top of a strong weekly support. That combination matters.
When price comes back to fill a gap and sits on higher-timeframe support, it usually turns into a decision point rather than a random bounce.
As long as this weekly support holds, the plan is clear:
👉 we’ll be looking for longs, patiently, with confirmation.
If buyers defend this zone, upside continuation becomes the higher-probability scenario.
If not, then we step aside and reassess. Simple.
Let the level do the work. 👀📈
⚠️ Disclaimer: This is not financial advice. Always do your own research and manage risk properly.
📚 Stick to your trading plan regarding entries, risk, and management.
Good luck! 🍀
All Strategies Are Good; If Managed Properly!
~Richard Nasr

AUDNZD: Bullish TrendAUDUSD is positioned in ascending channel of support and resistance, moving on a momentum upward rise. in regards to the structure, we can spot the price heading down gradually to the higher support, as we anticipate retracement around this zone.
Possible scenario:
A confirmed reversal above the support, activates a long move eyeing 1.1660 as target.
Thanks for reading.

BULL headed to sub $5?Descending triangle break down. My cost basis is like, $8 higher? HAHA. Anytime I buy shares now, I do so with profits from OTHER trades/wins. If I make $800+ of profits, I can buy 100 shares of BULL to lower cost basis.
COMPANY is generating revenue, but the platform is awful, marketing is terrible and they need a new CEO.
ME.

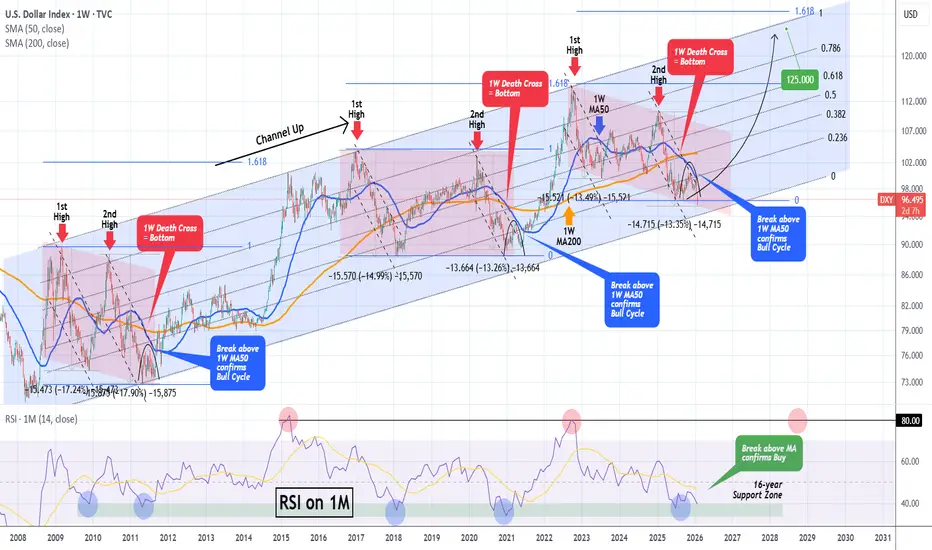
DXY has bottomed and is starting a massive 2-year rallyThe U.S. Dollar index (DXY) has been trading within a Channel Up since the March 2008 bottom during the U.S. Housing Crisis. This is not the first time we use this pattern to identify key macro trend shifts, in fact we revisited it 2 months ago, calling for 'a final pull-back before a massive rally'.
Well the time for this rally is here as yesterday it completed a -13.35% decline from the January 2025 High a year ago.
That decline was technically the Bearish Leg of this pattern's correction phase (red Channel). This is part of its incredible symmetry, with similar correction phases throughout this time period followed by bullish phases, that eventually lead to price rallies to the 1.618 Fibonacci extension.
All conditions for the new Bull Cycle (Bullish Leg) have been fulfilled. Along with the price being at the bottom of the Channel Up, with the -13.35% decline being a benchmark correction historically, we are also past a 1W Death Cross, which has always been a bottom signal on this multi-year Channel Up.
This has always happened at the end of the Bear Cycles (red correction phase) with the Arc pattern making a multi-week Double Bottom before the decisive rebound the breaks above the 1W MA50 (blue trend-line). That break-out is the confirmation of the Bull Cycle start (Bullish Leg).
With the 1M RSI having already touched its 16-year Support Zone, which has provided the most optimal Buy Signals throughout this pattern, we expect the Dollar Index to start rising aggressively in the long-term, targeting the 120.000 - 128.000 Zone on its way to the 1.618 Fib ext, which has been where the previous Higher Highs (Cycle Tops) were priced. 125.000 is a fair Target within a 2-year time-frame.
Notice also that a solid peak indicator (Sell signal) is when the 1M RSI hits 80.00, indicating that the market is massively overbought (overheated trend).
---
** Please LIKE 👍, FOLLOW ✅, SHARE 🙌 and COMMENT ✍ if you enjoy this idea! Also share your ideas and charts in the comments section below! This is best way to keep it relevant, support us, keep the content here free and allow the idea to reach as many people as possible. **
---
💸💸💸💸💸💸
👇 👇 👇 👇 👇 👇
IMPORTANYT LEVELS IF YOU ARE CONSIDERING HINDUSTAN COPPERMarked few important levels in the chart, use these levels with your anlysis it will definately help.

GBP/JPY: Liquidity Hunt Before the Leg Up? [FVG + HTF Analysis]Watching GBP/JPY closely as we approach a critical decision point. While the immediate trend has been showing bullish intent, we are currently trading into a Supply Ceiling without a significant liquidity sweep.
Knowledgeable trading isn't about chasing the current price; it's about waiting for the market to offer a discount. I am looking for a dip into the 210.250 region to fill the imbalance (FVG) and collect sell-side liquidity before targeting the major swing highs.
Strategy: ICT / Price Action Focus: Risk Management over FOMO.
The Technical Breakdown
The Entry (210.261): Waiting for a retracement into the Fair Value Gap. This aligns with a 'Discount' price relative to the recent impulse move.
The Stop Loss (209.600): Placed safely below the major 210.00 psychological level. If price closes below this, the bullish thesis is invalidated.
TP 1 (211.759): The first target is the recent high. I’ll be taking 50% off the table here to secure the bag.
TP 2 (214.158): The ultimate target for the 'runner' aiming for the higher timeframe liquidity.
Risk Management
Risk: 0.5%
Reward/Risk: 1:5.9

XAUT (Gold) TRADE SELL SETUP Short from $5440XAUT (Gold) TRADE
SELL SETUP
Short from $5440
Currently $5440
Targeting $5370 or Down
(Trading plan IF XAUT
go up to $5500 will add more shorts)
Follow the notes for updates
In the event of an early exit,
this analysis will be updated.
Its not a Financial advice

Possible Breakout Possible breakouts in NVDA
Checks in favor
Above 200 MA
Strong Sector
Tightening
HH/HL

Copper 8H timeframe-Bullish potential
Looks like Copper is in the final stage of the wave 4 blue correction triangle pattern ABCDE and will be moving higher with wave 5 shortly.
Confirmation: 6.06
Invalidation: 5.73
Target: 6.64


Gold risk entryRisk entry:
700 ~ 1500 pips opportunity
until end of this weekend
From 5560 ->
TP1: 5490
TP2: 5430
TP3: 5410

THE MAIN BACKBONE $ETH It held everything from the $880 bottom in 2022 to the $1520 bottom in 2023.
Fakeout (Bear Trap): In mid-2025, price dipped below this line (the middle blue arc). While everyone screamed "ETH is over," it was just a liquidity flush. Price is now back ABOVE this main trendline.
The trend was not violated; it was stress-tested. The direction is still UP.
INVERSE HEAD & SHOULDERS
Look at the blue arcs drawn at the bottom of the chart. This is a textbook, gigantic Inverse Head & Shoulders pattern.
Technical Target, When this pattern plays out, it typically travels the depth of the head upwards. This takes us directly back to the old All-Time Highs (ATH).
THE PIVOT POINT: THE $2800 FORTRESS 🏰
Pay attention to the green dotted line (2,817 level).
SR Flip (Support/Resistance Flip): This was the ceiling that couldn't be broken in 2024. Now, it is the floor the price is sitting on.
Status: ETH is currently at $2,951, holding above this critical support. As long as $2,800 is defended, the structure is BULLISH.
THE SILENT STORM
While the market is busy talking about Solana, SUI, or AI coins, Ethereum is quietly building the largest accumulation structure in history in the background.
Psychology: Investors are "tired" of ETH. This is a bottom signal.
It is above the rising trendline and forming a massive IH&S.
First stop is $4,100 (Upper green line). Once that breaks, price discovery begins.
"When elephants walk, the earth shakes." ETH currently looks like a sluggish elephant preparing to move, but once it starts running, it won't stop to pick up passengers.
With a stop-loss below $2,800, this zone (Right Shoulder) offers a perfect Risk/Reward ratio.
ALso check
ETHBTC
8 years breakout EVE here

TLT Price Action in the Months AheadA simple technical perspective of the TLT chart and how it may perform over the next 79 or so days. Lots of big news on the horizon soon, including the appointing of a new Fed Chair. Who will it be? The prediction markets are ablaze with idea but we may find out for sure as soon as next week!

Nasdaq100Nasdaq is coming back from the trendline to sell back to
the 25,778s. It could go and make a third touch on the main trendline to make the anticipated
3rd touch on the lower trendline.
PEPPERSTONE:NAS100

GER40 / LONG / 29.01.26Entry reasons:
4-hour liquidity sweep within the 4-hourly imbalance
Inversion 15-min imbalance
30% retracement of the bearish impulse

Buy XauusdGold is making a pull back, looking for a double bottom at 5100, then a rise to 5900. gold is on a strong bullish trend, trade with caution, profit takers can come in at anytime.

GBPCAD H1 | Bearish Continuation Momentum: Bearish
Price is currently below the ichimoku cloud.
Sell entry: 1.86679
- Pullback resistance
Stop Loss: 1.87149
- Swing high resistance
Take Profit: 1.86121
- 78.6% Fib projection
High Risk Investment Warning
Stratos Markets Limited (fxcm.com/uk), Stratos Europe Ltd (fxcm.com/eu):
CFDs are complex instruments and come with a high risk of losing money rapidly due to leverage. 69% of retail investor accounts lose money when trading CFDs with this provider. You should consider whether you understand how CFDs work and whether you can afford to take the high risk of losing your money.
Stratos Global LLC (fxcm.com/en): Losses can exceed deposits.
Please be advised that the information presented on TradingView is provided to FXCM (‘Company’, ‘we’) by a third-party provider (‘TFA Global Pte Ltd’). Please be reminded that you are solely responsible for the trading decisions on your account. Any information and/or content is intended entirely for research, educational and informational purposes only and does not constitute investment or consultation advice or investment strategy. The information is not tailored to the investment needs of any specific person and therefore does not involve a consideration of any of the investment objectives, financial situation or needs of any viewer that may receive it. Past performance is not a reliable indicator of future results. Actual results may differ materially from those anticipated in forward-looking or past performance statements. We assume no liability as to the accuracy or completeness of any of the information and/or content provided herein and the Company cannot be held responsible for any omission, mistake nor for any loss or damage including without limitation to any loss of profit which may arise from reliance on any information supplied by TFA Global Pte Ltd.
Stratos Trading Pty. Limited (fxcm.com/au):
Trading FX/CFDs carries significant risks. FXCM AU (AFSL 309763), please read the Financial Services Guide, Product Disclosure Statement, Target Market Determination and Terms of Business at fxcm.com/au

XAUUSD Long
Market entry 5319.96
SL 5127.29
TP 5706.23
Risk and trade management should be applied. More info in my Tradingview profile.

CRWV - Risk is clearly defined, making this a structured setup!CRWV - CURRENT PRICE : 79.32
CRWV is currently trading within a descending channel, indicating a medium-term corrective move after a prior uptrend. Importantly, price is now basing near the lower boundary of the channel, a zone where buyers previously showed interest.
Rather than breaking down aggressively, price action is stabilizing, suggesting selling pressure is starting to fade.
📈 Momentum Is Improving (Key Clue)
While price remains subdued, momentum indicators are telling a different story:
~ RSI (14):
RSI is recovering from lower levels and moving higher while price is still near the channel bottom. This signals improving momentum and early bullish divergence characteristics.
~ MACD:
MACD histogram is contracting, and the lines are starting to curl upward. This typically reflects weakening bearish momentum and the potential for a trend shift.
👉 When momentum improves while price holds support, it often precedes a technical rebound.
📌 This is a technical rebound setup — confirmation comes with continued momentum improvement and price holding support.
ENTRY PRICE : 77.00 - 79.32
FIRST TARGET : 96.00
SECOND TARGET : 110.00
SUPPORT : 63.80 (the low of BULLISH HARAMI pattern - 17 and 18 DECEMBER 2025 candle)
