Community ideas
EURUSD | FRGNT DAILY FORECAST | Q1 | W6 | D10 | Y26📅 Q1 | W6 | D10 | Y26
📊 EURUSD | FRGNT DAILY FORECAST |
🔍 Analysis Approach
I’m applying a developed version of Smart Money Concepts, with a structured focus on:
• Identifying Key Points of Interest (POIs) on Higher Time Frames (HTFs) 🕰️
• Using those POIs to define a clear and controlled trading range 📐
• Refining those zones on Lower Time Frames (LTFs) 🔎
• Waiting for a Break of Structure (BoS) as confirmation ✅
This process keeps me precise, disciplined, and aligned with market narrative, rather than reacting emotionally or chasing price.
💡 My Motto
“Capital management, discipline, and consistency in your trading edge.”
A positive risk-to-reward ratio, combined with a high-probability execution model, is the backbone of any sustainable trading plan 📈🔐
⚠️ On Losses
Losses are part of the mathematical reality of trading 🎲
They don’t define you — they are necessary, expected, and managed.
We acknowledge them, learn, and move forward 📊➡️
🙏 I appreciate you taking the time to review my Daily Forecast.
Further context and supporting material can be found in the Links section.
Stay sharp 🧠
Stay consistent 🎯
Protect your capital 🔐
— FRGNT 🚀📈
FX:EURUSD
BTCUSD- SELL strategy weekly chart Short-term we maybe oversold a bit, and this may still show $ 78-85 possibility. From medium-term perspective, weekly we are oversold, but break from triangle and possible S/H/S top suggest $ 40-45k objectives. Why does it not move higher currently, suggests sellers are dominating, and liquidating. The chances lower are there I feel.
Strategy SELL @ $ 72-75k and take profit near $ 48-50k.
61.8% Fib resistance ahead?NZD/JPY is rising towards a pullback resistance at the 61.8% Fibonacci retracement, which could reverse the move and trigger our take profit.
Entry: 94.56
Why we like it:
There is a pullback resistance level that aligns with the 61.85 Fibonacci retracement.
Stop loss: 94.97
Why we like it:
There is a swing high resistance level.
Take profit: 93.73
Why we like it:
There is an overlap support level that aligns with the 61.8% Fibonacci retracement.
Enjoying your TradingView experience? Review us!
Please be advised that the information presented on TradingView is provided to Vantage (‘Vantage Global Limited’, ‘we’) by a third-party provider (‘Everest Fortune Group’). Please be reminded that you are solely responsible for the trading decisions on your account. There is a very high degree of risk involved in trading. Any information and/or content is intended entirely for research, educational and informational purposes only and does not constitute investment or consultation advice or investment strategy. The information is not tailored to the investment needs of any specific person and therefore does not involve a consideration of any of the investment objectives, financial situation or needs of any viewer that may receive it. Kindly also note that past performance is not a reliable indicator of future results. Actual results may differ materially from those anticipated in forward-looking or past performance statements. We assume no liability as to the accuracy or completeness of any of the information and/or content provided herein and the Company cannot be held responsible for any omission, mistake nor for any loss or damage including without limitation to any loss of profit which may arise from reliance on any information supplied by Everest Fortune Group.
AUD/USD Volume Profile Rejection Level + FVG Confluence (0.6923)Price on AUD/USD M30 shows a strong rejection of lower prices followed by a sharp reversal, signaling aggressive buyers. Volume Profile reveals a heavy volume cluster near the rejection low, marking where buyers stepped in. The planned long entry is at 0.6923 — the start of that volume cluster. This level is strengthened by nearby Fair Value Gap confluence, making it a high-probability pullback zone.
USDJPY What Next? BUY!
My dear friends,
USDJPY looks like it will make a good move, and here are the details:
The market is trading on 154.75 pivot level.
Bias - Bullish
Technical Indicators: Supper Trend generates a clear long signal while Pivot Point HL is currently determining the overall Bullish trend of the market.
Goal - 155.59
About Used Indicators:
Pivot points are a great way to identify areas of support and resistance, but they work best when combined with other kinds of technical analysis
Disclosure: I am part of Trade Nation's Influencer program and receive a monthly fee for using their TradingView charts in my analysis.
———————————
WISH YOU ALL LUCK
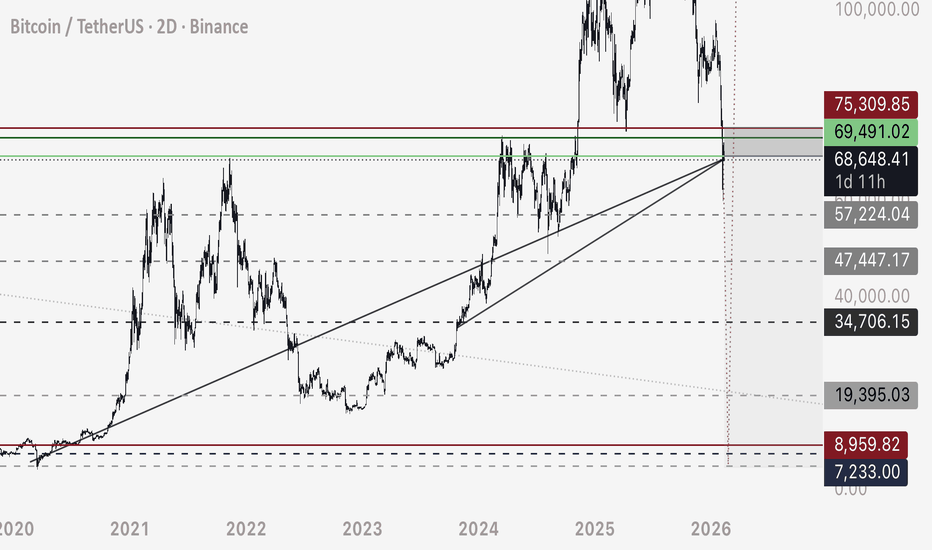
BTC - Flash Crash Short PlanFor those who have just read my recent deep dive into WHY 8,000 will be hit - it’s still a good time to short Bitcoin at the current price.
Here are the details for the trade.
Entry Low - 68,600
Entry High - 71,000
Stop Loss - 73,000
(Enter trade between Low and High entry and manage leverage accordingly - potentially DCA if we draw higher towards top entry - likely we won’t)
Target 1 - 57,300
Target 2 - 47,500
Target 3 - 34,800 (50% Close)
Target 4 - 19,400
Target 5 - 10,000 (100% Close here)
MOST LIKELY ABSOLUTE BOTTOMS RANKED:
1. 7,300
2. 9,000
3. 4,600
BUY / LONG in those regions only (5,000 to 9,000)
God speed. Should happen anytime now.
- DD
Oracle Positioned to POP!!!We believe Oracle is well positioned for a bounce from current levels. Since the breakout in March 2020, the stock has traded within a clearly defined ascending channel, consistently respecting both support and resistance.
Following a test of the channel’s upper boundary in September, Oracle experienced a sharp pullback as investor concerns grew around its exposure to OpenAI. In our view, this sell-off has been overdone. At a P/E of ~26, Oracle is now trading at a meaningful discount to peers, making the current valuation increasingly attractive.
Technically, the stock is sitting at the lower bound of the ascending channel, coinciding with the Value Area High (VAH) of the VRVP. This represents a strong confluence of support.
If this level holds, we would look to initiate a position, targeting a move back toward the mid-to-upper range of the channel.
If you enjoyed and were helped our idea, please boost it. If you're interested in any future idea we may have feel free to follow us!!!
Bitcoin (BTC): Expecting Smaller Recovery Towards $80KIn the short term, we are bullish up until the recent broken zone near $80K. Basically, after the long trend holders (both 100 and 200) EMAs were broken, there were the first small signs of potential sell-side dominance to take over the markets.
Now that price formed a confirmational breakdown (the break of local lows), sellers secured the sell-side dominance, which means most likely from here on in long term we are going to keep tanking down.
But as the recent breakdown was rather very sharp, we are expecting to see a smaller recovery to the previous local lows zone, from where we would be looking to take a bigger sell position.
Swallow Academy
GE Aerospace: Bullish Structure, Breakout Ahead? Hello and respect to all
TradingView followers 🌍📊
Hope your trades are green and your risk is always under control 💚
🔍 Symbol Overview
In this analysis, we’re taking a look at GE Aerospace (GE) — a major player in the aerospace sector that has been showing a very clean and disciplined technical structure in recent months.
📈 Overall Market Structure
On both the 4H and Daily timeframes, price action clearly confirms a bullish trend:
Consistent formation of Higher Highs and Higher Lows 🟢
Strong respect for the main ascending trendline / moving structure (yellow line) 📐
Pullbacks remain corrective rather than impulsive
➡️ This structure indicates that buyers are still in full control of the market.
🚀 Primary Scenario (Bullish – Higher Probability)
Price is currently trading near a key resistance / previous high.
If we get:
A clean breakout above the highlighted resistance zone
Followed by strong acceptance and consolidation above it on the 4H timeframe
Then:
Fresh liquidity is likely to enter 💰
A new bullish leg can start
This creates a high-quality long opportunity for mid- to long-term positions 📈🔥
🎯 Targets can be managed step-by-step in line with continued Higher High formation.
⚠️ Alternative Scenario (Fake Breakout – Lower Probability)
Despite the bullish bias, a false breakout scenario must always be considered ⚠️
If:
Price fails to hold above resistance
Moves back toward the marked Support Zone
And breaks this support decisively on the Daily timeframe
📉 Then:
The bullish mid-term structure would be compromised
Price could transition into a mid-term bearish or deeper corrective phase
🔻 This scenario currently has lower probability compared to the bullish continuation, but it remains a critical risk factor.
🧠 Final Thoughts
Market bias: Bullish ✅
Preferred strategy: Wait for resistance breakout and long continuation
Risk management: Closely monitor Daily support levels
The market is never about certainty —
it’s about having scenarios and managing risk 🎯
📊 Poll
Which scenario do you think is more likely? 👇
🟢 Breakout and bullish continuation
🔴 Fake breakout and deeper correction
#️⃣ Tags
#GE #GEAerospace #TechnicalAnalysis #Uptrend #MarketStructure
#Breakout #SupportResistance #SwingTrading #TradingView
Excellent Profits on re-Buy ordersAs discussed throughout my yesterday's session commentary: 'Technical analysis: Gold has entered the #5,002.80 - #5,027.80 Profit Taking zone, which is the first one on this new Buying wave and as discussed last week, it would be optimal for Short-term Buyers to have booked Profits until #5,027.80 and re-engage only after it eventually rejects the Price-action where they can re-Buy Lower or Buy above it. After if you took the lower Buy's below the zones I mentioned (Medium-term Support cycle), the Profit is already too good to be ignored. With the Daily chart invalidated local High's and the #8-Month Low's still preserved and haven’t been rejected at on of the previous candles, current Buying sequence (this Week) resembles more and more the last strong rebound of November #24 - November #27 sequence, Selling rebound pulled back to test the Lower Low's extension #3 consecutive times before more serious recovery / so I can't ignore this possibility before we eventually hit the #5,100.80 benchmark. Gold is on strong Bullish configuration as I maintain my re-Buy strategy all along, not Trading Gaps anymore, turning to normal Trading. I expect #6,000.80 benchmark test ahead on Medium-term.'
My position: I have done excellent re-Buy orders throughout yesterday's session especially Buying #5,027.80 rejection to the upside which delivered #5,057.80 extension where I closed my set of Buying orders in Profit. This morning I have Bought #5,006.80, and closed my order on #5,027.80 extension. Also followed with #5,022.80 - #5,027.80 / #100 Lot re-Buys. Bottom line my practical suggestion is to continue Trading with re-Buy zones and close the orders at will. #5,042.80, #5,027.80, #5,012.80, #5,002.80 key entry points.
USDCAD – Sell Trade UpdateUSDCAD – Sell Trade Update 📉
Following up on the earlier USDCAD short. Price is now approaching the projected lows, and downside momentum is starting to slow.
This area is a good place to protect gains, as I don’t expect a strong break to new lows based on the current fundamentals.
Trade Management Update:
• Price is nearing downside targets 🎯
• Momentum is slowing near the lows ⚠️
• Trailing stops now makes sense 🛑
• Consider taking partial profits on a potential 10R trade 💰
Outlook:
Further downside may be limited — this looks more like a completion zone than a breakdown.
Call to Action:
Lock something in, trail stops, and let the rest run wisely 👀📊
Stop!Loss|Market View: EURUSD🙌 Stop!Loss team welcomes you❗️
In this post, we're going to talk about the near-term outlook for the EURUSD currency pair☝️
Potential trade setup:
🔔Entry level: 1.18795
💰TP: 1.17785
⛔️SL: 1.19652
"Market View" - a brief analysis of trading instruments, covering the most important aspects of the FOREX market.
👇 In the comments 👇 you can type the trading instrument you'd like to analyze, and we'll talk about it in our next posts.
💬 Description: The euro's aggressive approach to key resistance near 1.19 creates a potential reversal. However, the lack of price consolidation near 1.19 is crucial. If we see accumulation, a downward reversal is unlikely in the near term. If buyers take the initiative, we should expect a rise to 1.2, from where the next potential downward reversal is expected.
Thanks for your support 🚀
Profits for all ✅
$MSFT testing Major Support 200 EMA - Pass or Fail??NASDAQ:MSFT : my bet is long-term upside as long as it holds the 200 EMA (purple) and the major support at 413.
Support: 413
Major resistance: 553
If 413 fails: next levels 389 → 345
200 EMA: it’s the market’s “long-term average price.” When price is above it, the trend is usually healthy; when price is below it, rallies often get sold until it reclaims it.
Daily market structure - AnalysisWe had a very strong, parabolic move to the upside. However, the price hit a major high and rejected hard.
Key Observation: We have now broken two significant higher lows.
Analysis: This sharp break of market structure suggests the aggressive buying is over for now.
Wait for: I am looking for a lower high or a retest of the broken levels before deciding on my next move.
Bitcoin - Starting the final -30% drop!🛟Bitcoin ( CRYPTO:BTCUSD ) is dropping another -30%:
🔎Analysis summary:
The underlying trend on Bitcoin remains clearly bullish. But following the unusual curve channel, Bitcoin perfectly rejected the upper resistance curve. Quite likely therefore that Bitcoin will now create another bullish break and retest and first drop -30%.
📝Levels to watch:
$55,000
SwingTraderPhil
SwingTrading.Simplified. | Investing.Simplified. | #LONGTERMVISION
Macro Tailwinds Align — SLV Upside BrewingSLV Trading Intelligence (Swing Setup)
Core Idea:
Selling pressure looks exhausted → capital may rotate into hard assets → bounce probability rising.
Structural line in the sand
Losing this level invalidates the setup
🎯 Upside Targets
$83 area → primary liquidity target
$100 zone → stretch target if metals trend
Silver typically moves inverse to the USD.
This is one of the strongest macro catalysts metals get.
2️⃣ Mean-Reversion Probability
A 13% projected move suggests:
👉 The prior selloff likely overshot fair value.
Markets often snap back after emotional commodity moves.
3️⃣ Technical Structure Still Healthy
This matters — many “bounce” trades fail because the trend is broken.
👉 Best entries usually happen on weak red days, not green spikes.
Ideal scenario:
Avoid chasing strength.
Risk Control (Extremely Important)
This is a medium-risk swing, not a safe trade.
Respect the level:
👉 Daily close below ~$70 → exit bias immediately
If the USD suddenly rallies:
👉 Silver can drop FAST.
Metals are macro-driven — not just technical.
A hawkish tone = pressure on metals.
Always watch macro headlines with commodities.
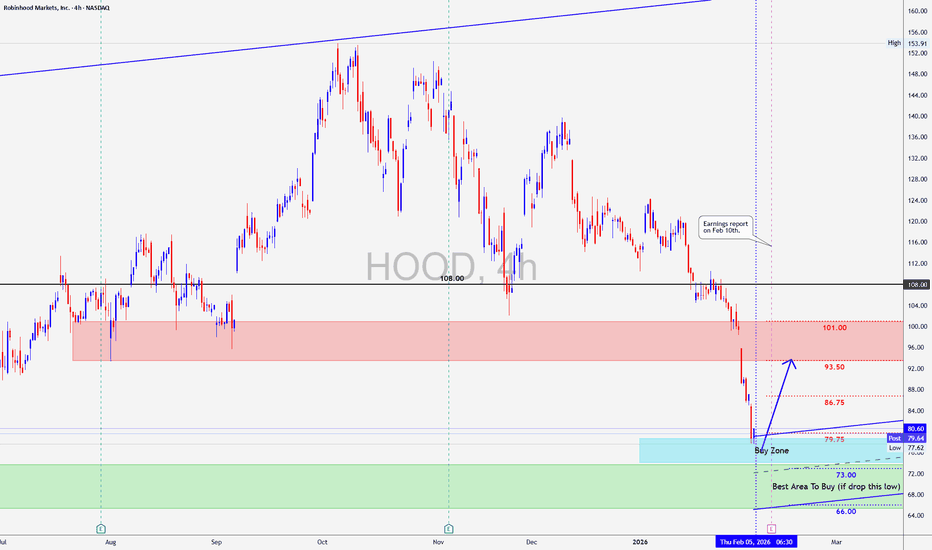
HOOD: Looking Good For a SwingAnother one setting up for a good trade before earnings.
HOOD has good volatility when it makes its moves making it a good candidate for a swing.
Hood is expected to move up before earnings .
Hood is in buy zone, but still has around 10 4hrs candles of Bearish TIME but with the fractal bottom at around $67.00 that makes it a bit riskier but risk/reward is very good.imo
Play it Right..........Play it Safe..........Know The Rules Of The Game.
Boost.........Follow..........Comment


