GBPUSD bullish breakout supported at 1.3656The GBPUSD remains in a bullish trend, with recent price action showing signs of a breakout within the broader uptrend.
Support Zone: 1.3656 – a key level from previous consolidation. Price is currently testing or approaching this level.
A bullish rebound from 1.3656 would confirm ongoing upside momentum, with potential targets at:
1.3900 – initial resistance
1.3950 – psychological and structural level
1.4050 – extended resistance on the longer-term chart
Bearish Scenario:
A confirmed break and daily close below 1.3656 would weaken the bullish outlook and suggest deeper downside risk toward:
1.3590 – minor support
1.3540 – stronger support and potential demand zone
Outlook:
Bullish bias remains intact while the GBPUSD holds above 1.3656. A sustained break below this level could shift momentum to the downside in the short term.
This communication is for informational purposes only and should not be viewed as any form of recommendation as to a particular course of action or as investment advice. It is not intended as an offer or solicitation for the purchase or sale of any financial instrument or as an official confirmation of any transaction. Opinions, estimates and assumptions expressed herein are made as of the date of this communication and are subject to change without notice. This communication has been prepared based upon information, including market prices, data and other information, believed to be reliable; however, Trade Nation does not warrant its completeness or accuracy. All market prices and market data contained in or attached to this communication are indicative and subject to change without notice.
Community ideas

The Next Movement of Gold And Why it PausedThe Next Movement of Gold And Why it Paused
Sometimes the market is beautiful. When the price reacts as the different market patterns tell you everything becomes easy and you enjoy the path the price follows.
A few weeks ago I mentioned that Gold created a cup and handle ideal for buying for the long term. The breakout happened at the $2,200 area and I warned that as a first profit taking zone we would go to $3,900 but the potential continued to $7,200 and in a longer term to $13,500.
We were entering a Gold bullish super cycle . Now every cycle has its sub cycles which are moments where the price stops or even goes down. And this is what we saw yesterday.
The price after a very aggressive run found a Double Top pattern in the short term. If this pattern breaks to the upside the party continues but by breaking to the downside $6 trillion were erased in minutes. The market is very leveraged and very speculative right now so a scare like this will bring a sideways phase of profit taking and investor repositioning.
The drop reached the perfect level. The first area with high VRVP meaning a large amount of volume accumulated at those prices. It was also the last area where the price had a base camp before attacking the next peak forming a small triangle typical of bullish continuation.
Now that we are located.
1 - In the long term Gold is in a super cycle but this does not mean we will not see corrections.
2 - In the short term a double top marked the zone of maximums to respect.
3 - The area with VRVP plus previous volume which is the previous base camp has served to take bullish positions and attack again.
What do we do now?
There are two scenarios in the short term.
Bullish scenario in the short term
Bearish scenario in the short term
Both scenarios have the same risk reward but the price must do different things.
The first scenario is already active. In case of a break to the downside we will enter the second scenario which would allow us to recover from the possible Stop Loss from the first scenario.
However going short on Gold must be for the VERY short term . Close the position quickly if the price turns bullish because it could keep flying.
👇 WANT MORE?
🚀 Hit the rocket, read my profile and follow so we can find each other again.

Is Bitcoin’s 4-Year Cycle Broken? The other side of the rhythmLately, one question keeps circulating across crypto Twitter, YouTube, and TradingView comments:
"Is Bitcoin’s 4-year cycle still valid — or has it been broken by institutional adoption?*"
Most discussions focus on tops:
* Halvings in 2012, 2016, 2020, 2024
* Historical all-time highs typically forming **one year after each halving**
* Which naturally leads to expectations, excitement, and disappointment around peaks
But very few people look at the "other side of the cycle". Looking at the cycle from the bottom up.
On this chart, the light purple horizontal level s mark the years when Bitcoin printed a lower low compared to the previous year: 2014 - 2018 - 2022 and potentially… 2026?
I saw it like a clean "4-year rhythm" — not of tops, but of " structural resets ".
Bitcoin has dropped below the previous year’s low before. It has done so multiple times.
But historically, those moments did not lead to a downward spiral.
They marked: compression, exhaustion and the rebuilding of a new base. In other words: "a rhythm, not a collapse."
---
Tops get the attention. Bases carry the structure.
If the classic halving cycle is still valid:
* Halving: 2024
* Peak year: 2025
* Correction / reset phase: 2026
* Next halving: 2028
* Next peak (statistically): 2029
That doesn’t mean anything must happen . It simply means the "math of the rhythm hasn’t been disproven yet".
And yes — a lot can change before then: technology, regulation, macro conditions, even the relevance of crypto itself.
But if the 4-year cycle is still alive, it’s worth asking: Why do we obsess over peaks
and barely study the years where Bitcoin rebuilds its foundation?
---
So, is the 4-year cycle broken? Maybe. Or maybe we’re just standing inside one of its quieter, less glamorous phases.
Either way, there are about 11 months left before the market gives us a clearer answer.
Until then — watching the rhythm might be more useful than predicting the destination.

4H XAUUSDShort-term analysis (30 minutes):
We benefited from an excellent buy trade.
After the news, gold dropped by around $600.
The current analysis is based on the 4-hour timeframe.
We expect to see a rebound in gold from the golden zone.
Our latest resistance:
If it is broken with a full 4-hour candle close, we could move toward the targets 6090 – 6330.
Caution is required when selling for now — the trend remains bullish

01/27/2026 MSTR/MSTU LongHello traders,
I’m neutral on Bitcoin for now, but I’m bullish on MSTR/MSTU. The hammer candle on the 4-hour timeframe suggests upside potential from here. After consolidating within a tight range for several days, MSTR appears ready for a breakout. My conservative Take Profit (TP) is the R1 trendline, though we may see further extension depending on Bitcoin’s performance. Stop Loss (SL) is set just below the previous wick.
Conservative TP : $180-$183
SL : $155
May the trend be with you.
GL all!
AP

$META TO THE MOON!!! This is a weekly of NASDAQ:META , which reported earnings post-session yesterday. To say the market responded favorably is an understatement. Zuck is swinging for the fences with AI, and the capital markets like what he is doing. If most people's jobs eventually get replaced by AI, why not at least invest in the future of this disruptive societal and technological shift? If you can't beat 'em, join 'em!
Check out how price seems to be rotating toward buy-side liquidity (upwards) in the large channel (dark green horizontal lines) now that it has recently closed above the weekly 50-period EMA (purple line just below price). My theory of price movement is base upon liquidity price can travel to to punish those on the other side of the trade, and there is a LOT of buy side liquidity for price to be attracted to. Check out the large bear bar from the week of October 27, which tested the EMA; price may very well take its liquidity this week!
I anticipate a continuing bullish rotation in the channel, with logical market objectives including $800 (round psychological number), the R1 PP at 810.96, and if it closes strong after testing that, a rotation to the upper bound of the channel close to $900.
I would enter at the market today at open, if you were not already in this name before earnings. Use a size you do not mind losing with!
I would place a stop loss at 598, which is just below the large bull bar from last week. Incidentally, I just noticed that formed a 2 bar bullish engulfing pattern with the smaller bear bar from the week before that...Further confluences include the imminent bullish MACD crossover (highlighted in the bottom pane with a green circle).
Disclaimer: DO NOT TAKE THIS TRADE! DO NOT FOLLOW MY ADVICE!
Best,
MrJosephTrades

TLT Price Action in the Months AheadA simple technical perspective of the TLT chart and how it may perform over the next 79 or so days. Lots of big news on the horizon soon, including the appointing of a new Fed Chair. Who will it be? The prediction markets are ablaze with idea but we may find out for sure as soon as next week!

GBP/AUD BEST PLACE TO BUY FROM|LONG
Hello, Friends!
GBP/AUD pair is trading in a local downtrend which we know by looking at the previous 1W candle which is red. On the 4H timeframe the pair is going down too. The pair is oversold because the price is close to the lower band of the BB indicator. So we are looking to buy the pair with the lower BB line acting as support. The next target is 1.970 area.
Disclosure: I am part of Trade Nation's Influencer program and receive a monthly fee for using their TradingView charts in my analysis.
✅LIKE AND COMMENT MY IDEAS✅

The “Real US Inflation” Is Falling Sharply!The Fed’s preferred US inflation gauge, PCE inflation, was updated last week, confirming a renewed disinflation trend following the two most recent favorable CPI inflation releases. Both PCE and CPI therefore confirm that the US price regime is once again moving toward the Fed’s well-known 2% target. Reaching this target is absolutely essential for the Fed to resume cuts to the federal funds rate and thereby provide support to the economy and equity markets.
Here are several key fundamental observations regarding US inflation:
• US inflation has resumed its path toward 2% after several months of stagnation around 3%
• Real-time “true” US inflation (according to Truflation) is now falling sharply after dropping below 2%, and this decline in the “true” inflation rate could begin to appear in official data by the end of Q1 2026
• A return to the 2% target is imperative before considering any modification of the Fed’s inflation target (for example, a 1.5%–2.5% range instead of a strict 2%)
• A return to the 2% target is also essential to consider activating the Fed put if conditions require it
In any case, the next Fed Chair should benefit from a far more favorable price environment than Jerome Powell.
Truflation clearly reinforces this diagnosis. After a period of stagnation around 2.5–2.7% during the summer and autumn, real-time PCE inflation has dropped sharply since year-end, quickly falling below 2% and now reaching approximately 1.5%. This dynamic is particularly important, as it suggests not only a return to target but also a potential temporary undershoot.
This rapid decline is typical of advanced disinflation phases, when lagging components such as housing and certain services finally reflect past economic and monetary tightening. In other words, the observed disinflation is no longer marginal or fragile — it is becoming self-sustaining.
If this trend is confirmed, official PCE figures published by the BEA should gradually converge toward these levels over the coming months, reinforcing the credibility of more significant monetary easing in 2026. In such a scenario, the Fed would regain substantial policy flexibility, both to support the economy and to stabilize financial markets in the event of stress.
In summary, the current collapse in “true US inflation” represents a major macroeconomic signal: the fight against inflation is close to being won, and the monetary regime of the next decade could open on far more favorable foundations.
DISCLAIMER:
This content is intended for individuals who are familiar with financial markets and instruments and is for information purposes only. The presented idea (including market commentary, market data and observations) is not a work product of any research department of Swissquote or its affiliates. This material is intended to highlight market action and does not constitute investment, legal or tax advice. If you are a retail investor or lack experience in trading complex financial products, it is advisable to seek professional advice from licensed advisor before making any financial decisions.
This content is not intended to manipulate the market or encourage any specific financial behavior.
Swissquote makes no representation or warranty as to the quality, completeness, accuracy, comprehensiveness or non-infringement of such content. The views expressed are those of the consultant and are provided for educational purposes only. Any information provided relating to a product or market should not be construed as recommending an investment strategy or transaction. Past performance is not a guarantee of future results.
Swissquote and its employees and representatives shall in no event be held liable for any damages or losses arising directly or indirectly from decisions made on the basis of this content.
The use of any third-party brands or trademarks is for information only and does not imply endorsement by Swissquote, or that the trademark owner has authorised Swissquote to promote its products or services.
Swissquote is the marketing brand for the activities of Swissquote Bank Ltd (Switzerland) regulated by FINMA, Swissquote Capital Markets Limited regulated by CySEC (Cyprus), Swissquote Bank Europe SA (Luxembourg) regulated by the CSSF, Swissquote Ltd (UK) regulated by the FCA, Swissquote Financial Services (Malta) Ltd regulated by the Malta Financial Services Authority, Swissquote MEA Ltd. (UAE) regulated by the Dubai Financial Services Authority, Swissquote Pte Ltd (Singapore) regulated by the Monetary Authority of Singapore, Swissquote Asia Limited (Hong Kong) licensed by the Hong Kong Securities and Futures Commission (SFC) and Swissquote South Africa (Pty) Ltd supervised by the FSCA.
Products and services of Swissquote are only intended for those permitted to receive them under local law.
All investments carry a degree of risk. The risk of loss in trading or holding financial instruments can be substantial. The value of financial instruments, including but not limited to stocks, bonds, cryptocurrencies, and other assets, can fluctuate both upwards and downwards. There is a significant risk of financial loss when buying, selling, holding, staking, or investing in these instruments. SQBE makes no recommendations regarding any specific investment, transaction, or the use of any particular investment strategy.
CFDs are complex instruments and come with a high risk of losing money rapidly due to leverage. The vast majority of retail client accounts suffer capital losses when trading in CFDs. You should consider whether you understand how CFDs work and whether you can afford to take the high risk of losing your money.
Digital Assets are unregulated in most countries and consumer protection rules may not apply. As highly volatile speculative investments, Digital Assets are not suitable for investors without a high-risk tolerance. Make sure you understand each Digital Asset before you trade.
Cryptocurrencies are not considered legal tender in some jurisdictions and are subject to regulatory uncertainties.
The use of Internet-based systems can involve high risks, including, but not limited to, fraud, cyber-attacks, network and communication failures, as well as identity theft and phishing attacks related to crypto-assets.

Silver Is Digesting the Breakout — Continuation Depends Hello traders, Silver is currently trading near $114.60, following a strong impulsive advance that previously pushed price into all-time high territory. That expansion leg was sharp and initiative-driven, confirming that the broader bullish structure remains intact. Since then, price has transitioned into a controlled pullback and rotation phase, which is a typical response after vertical price discovery.
From a structural standpoint, the recent retracement remains corrective rather than impulsive. Price has pulled back toward the former breakout region around $112.60–$113.00, an area that now acts as a key technical reference. This zone represents short-term balance, where the market is reassessing participation rather than distributing aggressively.
Below current price, the highlighted demand zone around $104.80–$106.50 continues to serve as the major structural support. As long as silver holds above this area, downside moves should be viewed as part of a broader consolidation process, not a trend reversal. Buyers have previously defended this zone with conviction, and it remains the line that separates healthy digestion from structural failure.
On the upside, sustained acceptance above $116.00–$117.00 would signal that the consolidation phase has completed, opening the door for another expansion leg toward the $122.00–$124.00 region, where price may again pause due to profit-taking and liquidity interaction. These levels should be treated as reaction zones, not guaranteed targets.
Invalidation is clear and objective. A decisive breakdown below the $104.80–$106.50 demand zone would disrupt the current bullish structure and shift focus toward a deeper corrective phase.
For now, silver is not breaking down. it is digesting gains.

NZDCHF: Confirmed Bullish CHoCH 🇳🇿🇨🇭
NZDCHF completed a correctional movement and started
a new bullish wave on a 4H time frame.
A confirmed change of character indicates a highly probable growth.
Goal - 0.4676
❤️Please, support my work with like, thank you!❤️
I am part of Trade Nation's Influencer program and receive a monthly fee for using their TradingView charts in my analysis.

A SELLA sell at 5180-85, sl at 5196 and allow it to run ,
I wanted to post it 7 a.m. UTC but I thought and think it best to wait for 8 a.m. UTC,
so sell at 5180-85 with sl at 5196 if it retraces up there.

Bitcoin Loves Bulls Right Now… Until This HappensYello Paradisers! Enjoy the video!
And Paradisers! Keep in mind to trade only with a proper professional trading strategy. Wait for confirmations. Play with tactics. This is the only way you can be long-term profitable.
Remember, don’t trade without confirmations. Wait for them before creating a trade. Be disciplined, patient, and emotionally controlled. Only trade the highest probability setups with the greatest risk to reward ratio. This will ensure that you become a long-term profitable professional trader.
Don't be a gambler. Don't try to get rich quick. Make sure that your trading is professionally based on proper strategies and trade tactics.

#XCUUSD COPPER - Price Is In A Clear UptrendCopper is in a clear uptrend (bullish structure).
Price broke above old resistance (green zone = support now) also a previous ATHs, pulled back into it, and is holding higher lows inside an ascending channel.
That support area is a buy-the-dip (long) zone, with upside targets toward ~7.00 if the trend continues. Which is a round number and a strong psychological level that has been acting like a magnet for the price.

XAUUSD: Continues Uptrend After Breakout, $5,170 in FocusHello everyone, here is my breakdown of the current XAUUSD setup.
Market Analysis
XAUUSD is trading within a strong and well-established bullish trend, supported by a clearly defined upward channel that has guided price higher over an extended period. Throughout this move, Gold has consistently respected the channel structure, printing higher highs and higher lows, which confirms sustained buyer dominance and healthy trend conditions rather than an exhausted rally. In the middle of the trend, price paused and formed a consolidation range, signaling temporary balance and accumulation before continuation. This range acted as a base, after which XAUUSD broke out decisively to the upside, triggering a powerful bullish impulse. Following the breakout, price accelerated higher and began respecting a rising triangle support line, showing that pullbacks remain shallow and corrective in nature.
Currently, Gold broke above the marked Support Zone, confirming a clean structure flip where former resistance turned into support. This breakout was followed by acceptance above the level, indicating strong buyer commitment rather than a false move. Price is now trading above the support zone and continues to trend higher toward the upper boundary of the structure. Above the current price, a clearly defined Resistance Zone around the 5,160–5,170 area stands as the next major technical obstacle. This zone represents a higher-timeframe supply area where profit-taking or temporary selling pressure may emerge. However, so far, there are no strong signs of impulsive rejection, and price action suggests continuation strength rather than distribution.
My Scenario & Strategy
My primary scenario remains bullish as long as XAUUSD holds above the Support Zone around 5,050–5,070 and continues to respect the rising structure. A controlled pullback into support, followed by bullish continuation signals, would offer a favorable continuation setup. I expect buyers to maintain control and attempt a push toward the Resistance Zone near 5,170 (TP1). A clean breakout and acceptance above this resistance would confirm trend continuation and open the door for further upside expansion within the broader bullish channel.
However, if price reaches resistance and shows clear rejection, a short-term corrective pullback toward the support zone or the rising triangle support line would be a healthy and expected move within the trend. Only a decisive breakdown and acceptance below the support zone would weaken the bullish structure and signal a deeper corrective phase. For now, structure, momentum, and price action continue to favor buyers.
That’s the setup I’m tracking. Thank you for your attention, and always manage your risk.

IRENDear Traders
many friends requested this stock
here my deep analysis and clean one. for IREN
its bullish on weekkly monthly
lets see if this can play out
comment and like

Gold Prices Consolidate at High Levels: $5470-$5600Gold Prices Consolidate at High Levels: $5470-$5600
Following the Fed's decision early this morning, spot gold experienced significant volatility, exhibiting a typical "buy the rumor, sell the news" pattern.
**Sharp Surge:** Influenced by the Fed's pause in interest rate cuts (maintaining rates at 3.50%-3.75%) and its dovish stance, gold prices strongly broke through the key psychological level of $5500 in early Asian trading, reaching a historical high of $5598.75 per ounce.
This rollercoaster ride stemmed primarily from two technical reasons:
First, the price had risen dramatically in a short period, placing gold in a severely overbought zone, necessitating a correction;
Second, short-term bulls chose to take profits after the key positive news was priced in, leading to the price pullback.
**Core Structure:** Despite the significant intraday volatility, the overall bullish trend remains intact.
**Key Support Levels:** The $5250-$5300 range is a significant area of previous trading volume.
**Key Support Levels:** Four key factors converged:
1. While the January decision "paused rate cuts," it explicitly ruled out a rate hike, and Chairman Powell released dovish signals, emphasizing that action would be taken if inflation falls or the labor market weakens.
The market interpreted this as the accommodative stance remaining unchanged, with rate cuts merely postponed. This lowered real interest rate expectations, directly benefiting gold.
2. Global central banks' net gold purchases reached 1,120 tons in 2025, with January 2026 purchases setting a new record.
This is not merely a tactical deployment, but a long-term strategic reflection of global reserve asset diversification and weakening confidence in the US dollar, providing a solid floor for gold prices.
3. Weakening market confidence in fiat currencies (especially the US dollar) and concerns about uncertainty surrounding US fiscal policy jointly fueled the "sell US" trade.
The US dollar index fell to a four-year low, making dollar-denominated gold cheaper for holders of other currencies, further stimulating demand.
4. The current geopolitical situations in the Middle East and Russia-Ukraine relations remain unresolved. Model calculations show that geopolitical risk premiums now account for 47% of the total risk premium for gold, significantly prolonging the duration of safe-haven capital inflows into gold.
Short-term Trading: The current market volatility is extremely high, presenting both opportunities and risks.
Pay attention to: $5480-$5470 (current support) and $5250-$5300 (key support). If gold prices pull back to these levels and stabilize, it could present a good short-term trading opportunity.
Strict stop-loss orders must be set to protect against sharp fluctuations caused by unforeseen events.
Intraday Trading Strategy:
BUY: $5490-$5500
SL: $5480-$5470
tp: $5550-$5600
Friendly Reminder: Be cautious when shorting.
Thank you for your attention. Welcome to discuss in my channel. I will use my expertise to guide your trading.

GER40 / LONG / 29.01.26Entry reasons:
daily liquidity sweep within the daily imbalance
Inversion 1-hour imbalance
30% retracement of the bearish impulse

IREN | WeeklyNASDAQ:IREN — Quantum Model Projection
Technical Update | Weekly Bullish Alt. Scenario 📈
IREN has surged ~90% since mid-December, confirming the Q-Structure λₛ support confluence as a valid launch zone. This advance is projected as the opening phase of Intermediate Wave (5) within Primary Wave ⓷ uptrend, potentially unfolding as an extended advance, with a Fibonacci extension target ➤ $431🎯, possibly into early July.
A corrective pullback toward Sup Q-Structure λₛ is expected to develop over the next few weeks.
🔖 This outlook is derived from insights within my Quantum Models framework. Within this methodology, Q-Targets represent high-probability scenarios generated by the confluence of equivalence lines. These Quantum Structures also serve as structural anchors, shaping the model's internal geometry and guiding the evolution of alternative paths as price action unfolds.
#CryptoStocks #CryptoMining #QuantumModels

Gold Price Pullback Signals Short-Term Bearish MoveGold was in a strong uptrend but now its getting weak. Price has broken below support showing a short term drop is likely. The next strong support area is around 4800-4700. For now the bias is bearish so selling on pullbacks near 5300-5350 can be better while buys are safer only if price shows a clear reversal from the support zone.
Long term gold is still strong due to global uncertainty, but short term this move looks like a correction, so use tight risk management.
Trade Plan - Sell Setup
Sell Zone: 5300 – 5350
Sell Trigger: Bearish rejection or strong close below 5340-5345 with continuation
Targets: 5000 → 4915 → 4800-4780
Invalidation: H4 close above 5410-5420
Trade Plan - Buy Setup
Only consider buys if price reaches the 4800 demand zone and forms a strong bullish reaction
Buy Zone: 5800 – 4750
Buy Trigger: Strong bullish close above 4820-4830 with continuation
Targets: 5000 → 5130 → 5300
Invalidation: H4 close below 4700
Bias: Short-term bearish correction long-term trend still bullish so sells are pullback trades not a trend change. Patience near resistance is key.
Note
Please risk management in trading is a Key so use your money accordingly. If you like the idea then please like and boost. Thank you and Good Luck!

BTC Bulls: ItS jUsT a CoRrEcTiOnHello traders,
Last couple of months, I kept asking myself the same question:
Why is the USD weakening,
why are Gold & Silver kept printing ATHs,
Yet BTC keeps sinking?
Even as of yesterday when metals were pulling back, BTC crashes even more 10%!
I don't understand how people can still call this a bull market?
At some point…your investments blindfold you.
Dead Cat Bounce
I warned that the move into the 0.382 Fibonacci retracement was just a dead cat bounce.
Price reacted almost exactly at that level with a clear rejection and has now lost every short-term support that bulls were leaning on.
What now?
When price can’t sustain support levels, it doesn’t mean “buy the dip”. You will only try to catch falling knives, you don't want that, do you?
Liquidity is still below.
📉 Next major target: 75K
That’s where volume and HTF structure sit. And that is not a financial advise.
Good Luck!

Bitcoin: Analyzing the Complex Correction Towards a Final FlushBitcoin appears to be entering a complex corrective phase where the internal structure suggests significant remaining downside potential. Here is my detailed market reading:
🔍 Technical Context: A "5-3-5" Corrective Structure My analysis is based on the following breakdown:
Phase A (Bearish Impulse): An initial 5-wave sequence (decomposed here into a complex WXYXZ cycle), marking the end of euphoria and a shift in structure.
Phase B (Corrective Bounce): A 3-wave relief move (WXY), testing key resistances without invalidating the underlying bearish trend.
Phase C (Final Wave): We are potentially starting a new 5-wave bearish sequence (aiming for another WXYXZ structure). This phase aims to purge the market and hunt for liquidity in much lower zones.
🎯 Targets and Zones of Interest Target levels are mapped using Fibonacci extensions and historical support zones. The market must confirm a break of the recent local lows to validate this final capitulation scenario. Note: As long as identified resistance zones are not reclaimed on a weekly close, the bias remains strictly Bearish.
💡 Trading Philosophy
Patience is your best ally: Do not force entries.
Discipline is your shield: Respect your stop-losses and your initial plan. The market gives nothing for free; it rewards those who wait for the perfect signal.

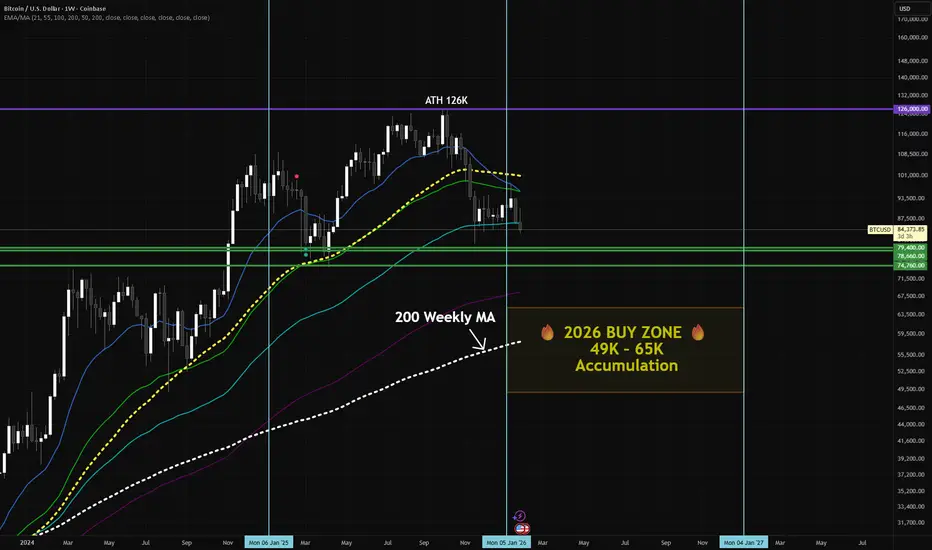
BTC Weekly Update – January 2026Current positions highlighted on the chart: 74K–79K , which are holding as near-term support.
I also have longer-term DCA positions not shown here.
Key 2026 accumulation zone: 49K–65K, near the weekly 200 MA, which has historically acted as long-term support.
BTC has recently pulled back from the 2025 peak (~126K) and is consolidating in the mid 80K range. Holding these support levels will be important before potential moves lower toward structural long-term support zones.
For educational purposes only – not financial advice.