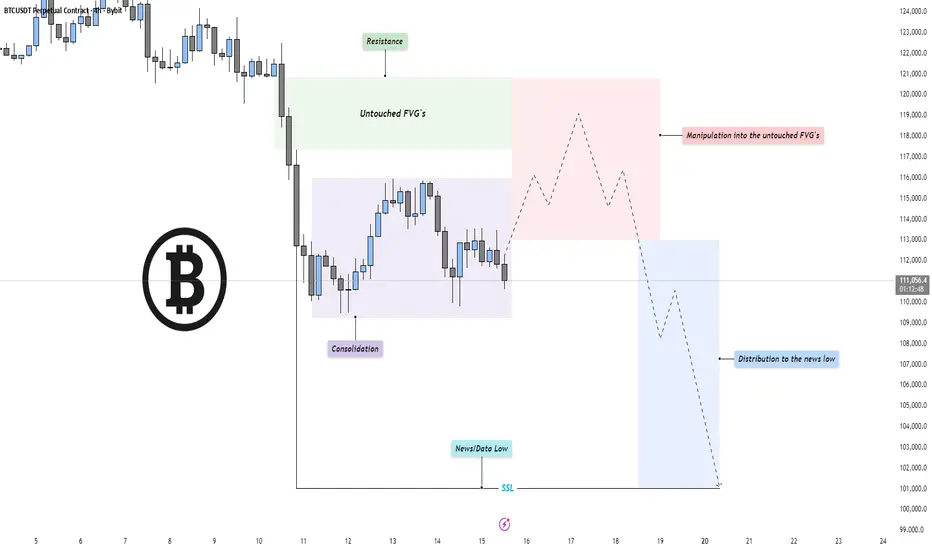
BTC - Perfect Power of 3 setup!Market Context
Bitcoin has entered a phase of compression after an extended bearish leg, with price currently consolidating near recent lows. The previous selloff created a clean structure of inefficiencies and untouched fair value gaps (FVGs) above, now acting as potential magnet zones for short-term retracements. The broader context remains bearish until those imbalances are efficiently mitigated.
Fair Value Gaps & Manipulation Zones
A clear pocket of untouched FVGs sits above the current range, aligning with resistance from prior breakdown points. Price could engineer a manipulation move into this zone, enticing late buyers before resuming the macro bearish direction. Such a move would serve as a liquidity grab and offer premium pricing for distribution before continuation lower.
Liquidity Dynamics
The market structure shows resting sell-side liquidity (SSL) below the recent “news/data low,” marked as a potential target for a deeper sweep. Once manipulation into the upper inefficiencies completes, the market could shift momentum to the downside, distributing into that liquidity and seeking new lows for rebalancing.
Final Thoughts
The current structure points toward a classic bearish continuation setup: consolidation, manipulation into premium inefficiencies, and a drive toward sell-side liquidity. Unless price breaks decisively above the untouched FVG chain, the expectation remains for a redistribution phase leading into the news low or beyond.
If this breakdown helped frame your bias, a like goes a long way — do you think price runs the FVG first, or dives straight into the liquidity below?
Community ideas
When Everyone’s Buying, I’m Watching for the TopAs we’ve grown used to by now, Gold sets a new ATH almost every day — and by the time we, in Europe, wake up, it’s already 300–400 pips higher.
Yet despite the strong bullish momentum, speculative trading remains extremely difficult. Sudden drops of hundreds of pips can easily hit your stop loss if your entry timing isn’t perfect.
From my perspective — even though I don’t have an open position — the idea remains the same: a correction is inevitable.
Since Friday’s low, the price has rallied around 3,000 pips — a fabulous move, but like any late-stage rally, it’s becoming excessive and irrational (even more than it already was).
Of course, it can always go higher, but the more it exaggerates, the faster it tends to normalize.
As I mentioned before, my approach remains focused on identifying potential tops — and while that’s the riskiest thing a trader can do, it has worked quite well during the sharp downward spikes of the last two weeks.
Technically, the move from Friday’s low is forming a rising wedge, with resistance around 4270, which is where I’ll be looking to sell.
The target zone is roughly 1,000 pips lower.
One encouraging factor — even more so than before — is the noticeable narrowing of the spread between futures and spot, now at just 0.2–0.25%, compared to the usual ~1% (and sometimes higher) during strong bullish phases.

Bitcoin - This 2017 trendline predicts a huge crash below 60k!This long-term trendline 2017 - 2021 - 2025 worked perfectly on Bitcoin this year, because we saw 4 major rejections every time the price touched the trendline! Many people said that I must do analysis on the LOG scale only and that this trendline is not valid. Well, the opposite is truth - both linear and LOG trendlines are valid. What does it mean, and is this the end for Bitcoin and altcoins? From the technical point of views - yes, this is over. Bitcoin must climb back above 121k to invalidate this scenario, and I don't see it happening anytime soon.
Uptober turned into a Deathtober for crypto. There was a good reason why all altcoins crashed by 60% to 95% in 1h, and clearly it was a big coordinated manipulation by market makers. If you want to know more about the manipulation (which is extremely interesting, you muse see), please look at my previous post:
If the whales can drop all altcoins by 60% to 95% in a single hour, without any reasonable news, then you can be sure that Bitcoin can drop slightly by 50% to around 60k in 2026! And stop saying that the market dropped because of the tarrifs, that's the biggest nonsense. And this is a very light pullback. I recommend selling all altcoins and taking profits while the prices are still extremely high. I think 2026 will be a red year for the crypto market.
Write a comment with your altcoin + hit the like button, and I will make an analysis for you in response. Trading is not hard if you have a good coach! This is not a trade setup, as there is no stop-loss or profit target. I share my trades privately. Thank you, and I wish you successful trades!

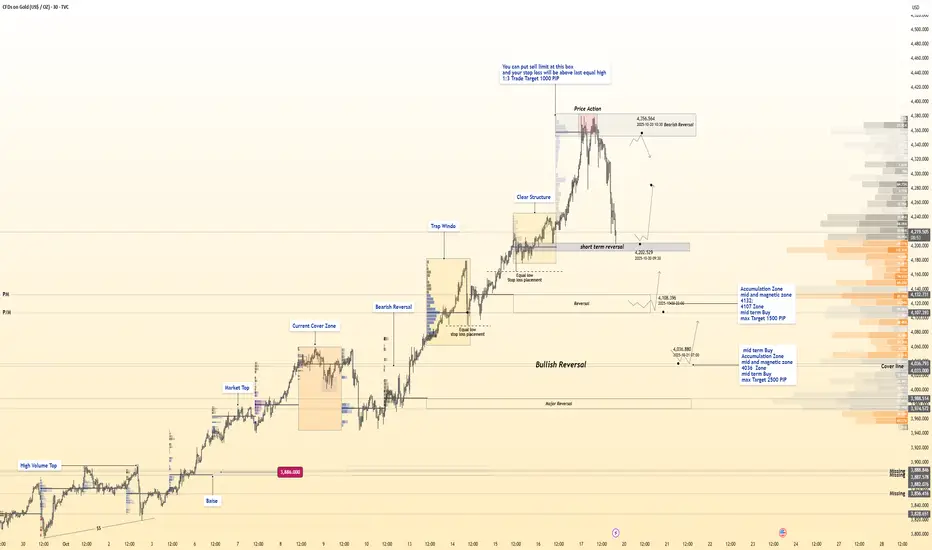
The Ultimate GOLD Reversal Map📊 Hanzo Protocol Note
Every marked level reflects precision between liquidity, delta reaction, and volume logic —
Only structure and flow decide — not bias.
Mid-Term SELL Zone — 4360
Setup: Limit Sell Recommended
Stop Loss: Above recent equal highs
Target: +1000 Pips (1:3 RR)
Reasons:
Liquidity pool above previous equal highs
Institutional distribution volume at upper range
HVN (High Volume Node) cluster acting as resistance wall
Delta shift showing heavy sell absorption
Imbalance re-test aligned with order block
4H premium pricing zone within range top
Price deviation above value area high
Stop hunt confirmation wick
Momentum divergence vs delta
Hidden distribution footprint visible on volume profile
Short-Term BUY Zone — 4202
Setup: Reactive Buy Opportunity
Target: 500–1000 Pips
Reasons:
Ultra-volume spike with no price continuation
Delta flip confirming buyer absorption
Trap formation below session low
Volume exhaustion beneath POC
Smart Money re-entry point after sell-side clear
Strong 30M reversal wick with liquidity gap
Reaction from prior fixed HVN
Internal structure shift with micro CHoCH
Buyer cluster confirmed under equilibrium
Perfect liquidity grab setup before new leg
Mid-Term BUY Zone — 4132 – 4107
Setup: Accumulation & Magnetic Demand Area
Target: Up to 1500 Pips
Reasons:
Multi-session HVN alignment
Strong accumulation footprint on delta flow
Reactive rejection at discounted price zone
Liquidity engineered below equilibrium
Large volume imbalance correction
Compression channel breakout origin
Major liquidity gap filled
High-probability reversal range from fixed profile
Delta divergence showing quiet buyer absorption
Institutional order flow detected at low volume shelf
Long-Term BUY Zone — 4036
Setup: Deep Accumulation Zone
Target: Up to 2500 Pips
Reasons:
Major 4H structural base confirmed
Deep liquidity flush below quarterly low
Volume absorption + delta compression zone
Institutional reloading pattern visible
Smart Money demand block within discount 0.79 level
Magnet zone aligning with historical POC
Strong rejection from fixed range low
Major delta shift to positive
Buyer footprint expansion in lower volume node
Final liquidity grab before long-term accumulation move
EURUSD 30-Min — Volume Bearish Reversal Triggered 🩸 Key Technical / Direction (Bearish Reversal Scenario)
Bearish Reversal Zone:
Price Range: 1.17100
Reasons for Entry:
🩸Volume Cluster Resistance (2+ sessions confirmed)
🩸Unretested POC Above Current Session
🩸Delta Imbalance Showing Seller Control
🩸10:30 Fixed Range Sweep Above POC (Liquidity Cleared)
🩸17:00 Candle Failed to Reclaim Above POC
🩸Cluster Volume Expansion (Shift to Supply)
🩸Liquidity Pool Above Previous High
👽Bias Summary:
Distribution confirmed at volume peak.
Cluster rejection aligns with delta flow — reversal logic active.

Bitcoin at Heavy Supports – Time to Go Long?As I expected in my previous idea , Bitcoin ( BINANCE:BTCUSDT ) completed both its bullish and bearish moves and hit its Long and Short targets .
Bitcoin can still see some upside as long as it holds this Heavy Support zone($111,980-$105,820) . However, given the recent momentum and the wick down to around $102K a few days ago, any further rally depends on breaking the Resistance zone($118,750-$115,730) and touching around $117,220 , which is the high of that significant bearish candle .
Currently, Bitcoin is sitting in a Heavy Support zone($111,980-$105,820) near the 200_SMA(Daily) and a Cumulative Long Liquidation($108,415-$107,156) . It's basically hovering between key weekly support lines, so this is a pretty strong supports .
In terms of Elliott Wave theory , it looks like Bitcoin is still completing its wave 4 . This wave 4 might have formed a Double Three Correction(WXY) , and now we can expect a potential upward move .
I expect that in the next few hours, Bitcoin may start a short-term bullish move up to around $115,000 or to the Cumulative Short Liquidation Leverage($114,973-$113,435) .
Note: Overall, it's better to look for Long positions right now, considering Bitcoin's position. But if it breaks the 200_SMA(Daily) and the Heavy Support zone($111,980-$105,820), we could see a broader crypto market drop.
Note: Around the $108,000 level, we have huge buy orders stacked up, which might act as a significant support zone.
Please respect each other's ideas and express them politely if you agree or disagree.
Bitcoin Analysis (BTCUSDT), 4-hour time frame.
Be sure to follow the updated ideas.
Do not forget to put a Stop loss for your positions (For every position you want to open).
Please follow your strategy and updates; this is just my Idea, and I will gladly see your ideas in this post.
Please do not forget the ✅' like '✅ button 🙏😊 & Share it with your friends; thanks, and Trade safe.

XAU/USD | First LONG, then SHORT! (READ THE CAPTION)By analyzing the Gold (XAUUSD) chart on the 15-minute timeframe, we can see that gold hit all targets between $4,300 and $4,350 and even rallied to $4,380.99, marking a new all-time high (ATH)!
After that, gold started to correct below $4,300, briefly dipping to $4,258 before bouncing back above $4,285. I expect that if the price moves into the $4,300–$4,317 zone, we may see a negative reaction or rejection from this area.
If that scenario plays out, gold could drop toward $4,250 as its first key target.
Keep a close eye on these levels — and if you have questions about gold’s trend, feel free to leave a comment using the link below!
Please support me with your likes and comments to motivate me to share more analysis with you and share your opinion about the possible trend of this chart with me !
Best Regards , Arman Shaban

The best thing you can do as a crypto traderLike many who trade crypto, I’ve got a bitter taste in my mouth after Friday night’s chash.
But with years in the market, I know it’ll pass.
Still, I wanted to give one honest piece of advice to anyone new to this space:
The best thing you can do is stay away from social media.
Everything you see there is fake.
The Lambos.
The “next 100x.”
The guys screaming into the mic about how to become a millionaire, how this coin will make you rich, or how “Trump will print millionaires again.”
You’ll hear about one whale wallet buying — next hour/day, another one selling — and you’ll ask yourself: why?
You’ll see the same people saying for over two years that the mythical altcoin season is just around the corner.
The same people who call for a “100x” no matter what the market does.
The same people who promise that XRP will hit $10,000 on November 21, and when that date passes, it magically becomes “by Christmas, by Summer, by Horses Easter (Romanian expression :) )”
And when one person says something ridiculous and it gets views, a hundred others copy it.
Then a thousand more come and make it even louder, more dramatic, more viral — because attention is currency, not accuracy.
Social media isn’t a place for trading.
It’s a place for noise.
For emotional manipulation.
For dopamine hits disguised as “alpha.”
If you want to survive in this market, learn to think independently.
The moment you stop looking for answers in influencers’ voices (of course, there are exceptions, but...), you’ll start hearing your own.
And that’s when you actually begin to grow as a trader.
P.S. And by the way — instead of scrolling on TikTok or whatever, pick up a real trading book.
At least there, you’ll find something concrete — not another fairytale about how to become a millionaire with the next meme coin.

Gold - The most obvious top!🪙Gold ( TVC:GOLD ) will reverse soon:
🔎Analysis summary:
After we witnessed a major breakout back in 2024, Gold has been rallying about +120% ever since. However, Gold is now approaching a monster resistance trendline of the long term rising channel. It is really just a matter of time until Gold will create its official top.
📝Levels to watch:
$4,500
SwingTraderPhil
SwingTrading.Simplified. | Investing.Simplified. | #LONGTERMVISION

Gold – Madness in MotionGold rose this week — so far (and I really want to stress so far ) — by around 10%. That’s massive by any standard.
On Monday, I tried to catch a dip and missed it. Since Tuesday, I’ve been on the sell side — completely wrong on direction , yet somehow still managed to finish positive overall.
Yesterday my stop got hit, but after what happened overnight, it turned out to be just a scratch. With this kind of volatility, a recovery of 250pips can happen in ten minutes.
Looking at the chart — it’s bullish, no question. Should it be bought? Hmmmm...
Looking at the volatility… for me, it’s become untradeable.
Can it keep going higher? Of course.
How high? Nobody knows.
At this point, any prediction is just throwing numbers in the air.
Trading corrections, as I’ve tried to do, is a guessing game. I’ve had some luck so far, but after yesterday's stop loss, I’m stepping aside.
My take: stay out. Let others make money if they can.
A 1,000-pip rise and an equal reversal — all while I was asleep (and trust me, I sleep very little) — is too crazy. Stops can be wiped for bulls just as easily as for bears.
At some point, it will settle down and define its levels.
Until then — it’s not for me anymore.
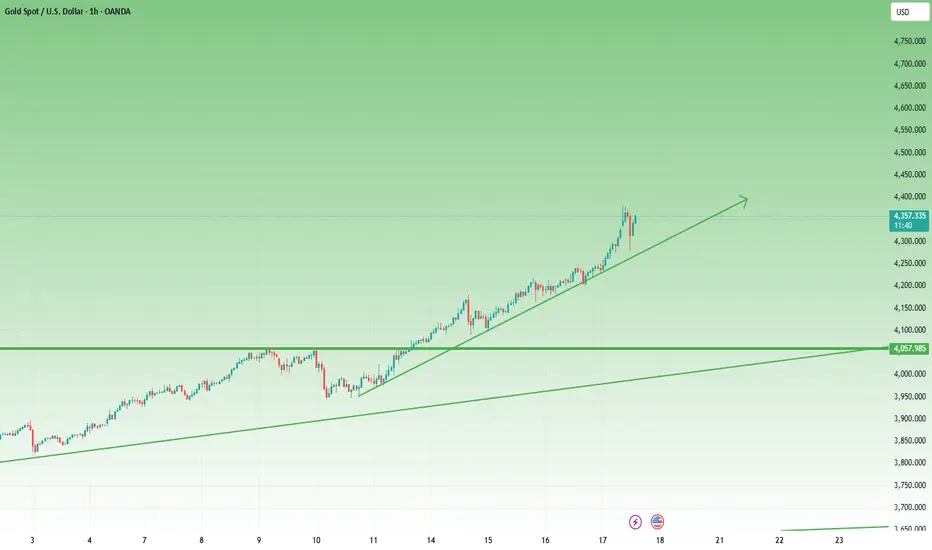
GOLD → Positive backdrop. Consolidation before growth?FX:XAUUSD is consolidating after a shake-down in the Asian and Pacific sessions. The price hit a new low of 4278, but bulls are aggressively buying up two liquidations (manipulation?). The metal is preparing for its ninth consecutive week in positive territory, with an 8% increase over the week.
Key drivers: Fed members confirmed their readiness to cut rates in October and pointed to risks for the labor market. The situation with the trade war between China and the US is still tense.
However, negotiations between the presidents of three countries on the conflict in Eastern Europe have raised hopes for de-escalation, which has temporarily reduced demand for defensive assets. The shutdown continues, which supports the price of gold.
The correction in gold is a temporary pause, and any decline will be used for purchases.
Technically, the focus is on the global trading range of 4280-4380, with consolidation within 4350-4330. A breakout of the accumulation zone could trigger a move in the direction of the breakout
Resistance levels: 4350, 4380
Support levels: 4320, 4300, 4280
Technically, before rising, the price may test the liquidity zone located below the specified support zones. However, it is also worth watching the 4350 trigger—a breakout of resistance and a close above this level could trigger continued growth within the current bullish trend.
Best regards, R. Linda!

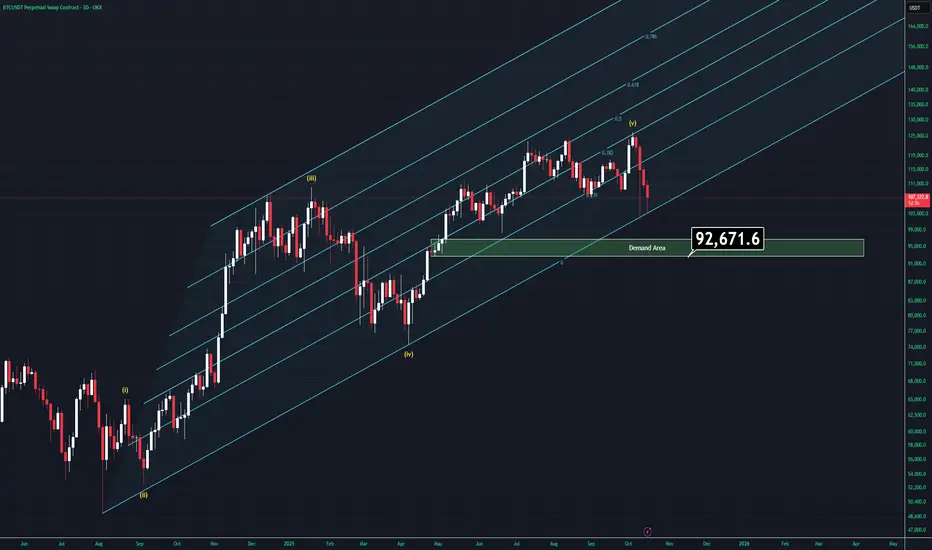
Moment of Fate - BTC Analysis (3D)There are many reasons to go up but also going down is starting to look way more charming than ever right now.
Let's examine what we have;
-FED is about to cut rates for a second time but we'll most likely to see another rate cut in december which is bullish af.
-All companies are keeping buying Bitcoin more and more which is kinda good but might be a problem for decentrlation of Bitcoin.
-US is more likely to bring more regulations about stablecoins which will effect positivly Bitcoin.
On the other hand;
-China and US are still faceing a trade war even if they state othervise.
-ETF's are not buying Bitcoin as much as they did last year.
-US and Venezuela might have a conflit very soon.
-Israel-Hamas and Russo-Ukraine wars hasn't actually over yet.
-Gold is going on god mode.
-DXY is trying to recover in weekly timeframe but is less likely due to rate cuts.
-Elliot wave theory tells us that we might actually be in the A-B-C correction cycle.
-Volume is decreasing, which is bad and supports the Elliot waves.
- Trendline support is about to be lost (Tried to break it twice in a week).
-There is a CME gap left around $92K
Well, all we have to do is, combining the factors.
If BTC breaks below the supportive trendline we will most likely drop through demand zone which is highlited in the chart. If US and China makes peace (less likely), Bitcoin actually has real reasons to try a new all time high.
The main point is simple: Wait for one of two things to happen:
Either the trendline will be broken and we'll see below the $100K, which will give us new opportuinites.
Or, Bitcoin recovers $118400 and the entire bearish senario would be invalidated and Bitcoin goes like crayz again.
Thank you for reading.
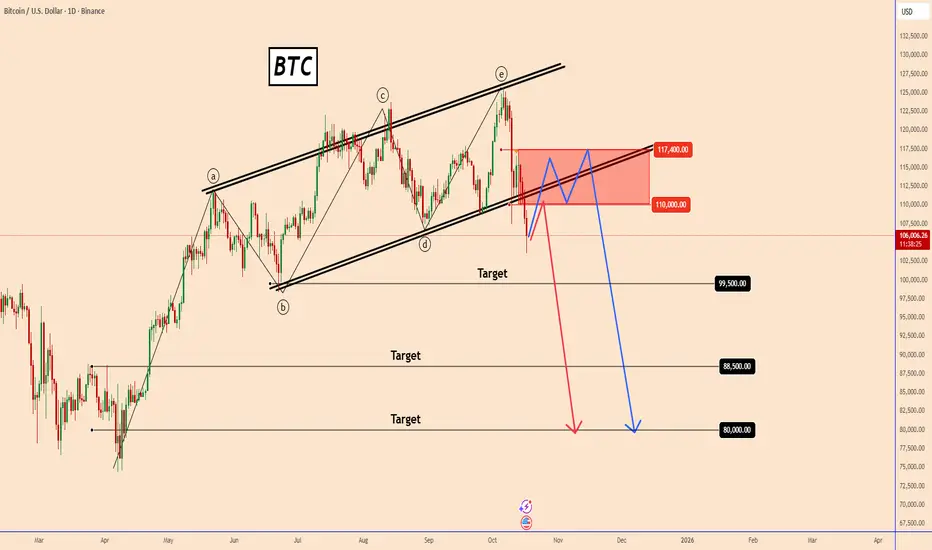
Bitcoin (BTC) Analysis – Daily ChartBitcoin (BTC) Analysis – Daily Chart
Bitcoin has broken below the ascending channel that has held for several months. This breakdown indicates a possible shift in momentum from bullish to bearish.
At the moment, the price is trading around $105,900, with resistance seen near $110,000 and $117,400. As long as BTC stays below these levels, the bias remains bearish.
If the price continues to fall, the next potential downside targets are around $99,500, $88,500, and $80,000.
However, if Bitcoin manages to recover and close back above $110,000, it could re-enter the previous range and attempt to retest the upper resistance area near $117,400.
The dynamics of change have been very high recently, so anything is possible.
You may find more details in the chart!
Thank you and Good Luck!
❤️PS: Please support with a like or comment if you find this analysis useful for your trading day❤️
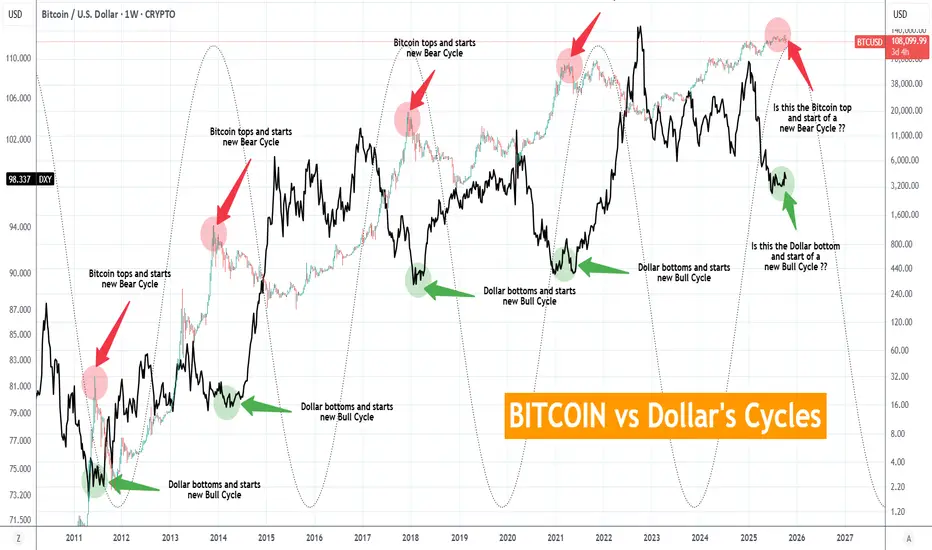
BITCOIN vs Dollar's Cycles. Has the new BTC Bear Cycle started?This is as simple as it can get. And obviously, it is not the first time we give you this chart. This is a cross-asset comparison between Bitcoin (BTCUSD) and the U.S. Dollar Index (DXY) illustrated by the black trend-line. It represents the Cycles of the two assets, typically negatively correlated across the span of 15 years.
As you can see, when the USD bottoms and starts a new Bull Cycle, BTC tops and starts a new Bear Cycle. Similarly vice versa with USD's Bull Cycle tops against BTC's Bear Cycle bottoms.
So the million dollar question is whether the USD has bottomed again. Based on the 4-year Cycle Model and as the Sine Waves illustrate on this chart, it may have. It is no surprise that while the DXY has formed Higher Lows since July 07, BTC has topped and turned sideways on ranged trading with a new Low made on last Friday's crash.
It is not necessary for the USD to break upwards aggressively in order for BTC to start dropping aggressively into its new Bear Cycle. As Jan - March 2018, Jan - March 2013 and May - August 2011 have shown, the USD may range sideways, as long as it is a clear sign of bottom formation, while Bitcoin is already into its Bear Cycle.
So the conclusion is that as long as the USD keeps trading sideways without making a new Low, it is quite like for Bitcoin to be entering its new Bear Cycle. Sound planning, calculated profit taking and gradual (to say the least) de-risking may be required.
So do you think Bitcoin's new Bear Cycle has started? Feel free to let us know in the comments section below!
-------------------------------------------------------------------------------
** Please LIKE 👍, FOLLOW ✅, SHARE 🙌 and COMMENT ✍ if you enjoy this idea! Also share your ideas and charts in the comments section below! This is best way to keep it relevant, support us, keep the content here free and allow the idea to reach as many people as possible. **
-------------------------------------------------------------------------------
💸💸💸💸💸💸
👇 👇 👇 👇 👇 👇
GOLD: STOP TRADING GOLD TODAYGOLD: STOP TRADING GOLD TODAY
Yesterday gold hit a new record high of 4380.
The price went up for no reason in an exponential way.
I have no idea what is going on because these crazy moves are not related to normal market conditions. It is impossible to be a normal market and go up like this moreover, at a time that we don't have any news.
If you made profits, then well done:)
I think everyone should at least stop trading gold today. We could also face some aggressive sell-off that could come out of nowhere.
⚠️Gold could also rise further but I don't believe to this market anymore.
⚠️Yesterday we had movements also on the currency pairs and that are going on also today for no reasons. I can't explain and I couldn't find any news related to the movements.
The only thing that can be read is that the FED will lower interest rates and it will not lower them. Just nonsense. All major economies lowered interest rates and nothing happened. Why this pointless focus only on the US dollar? Just manipulation to hide the real truth behind these transactions.
You may find more details in the chart!
Thank you and Good Luck!
❤️PS: Please support with a like or comment if you find this analysis useful for your trading day❤️

XAUUSD - Surging Hour by Hour👋Hello everyone, great to see you again in today’s OANDA:XAUUSD session.
As forecast, XAUUSD has continued its strong uptrend, hitting the 4,100 target and then 4,200 USD. The quick move through these two psychological levels in a short time underscores the bulls’ strong momentum.
Ongoing economic risk concerns—from a prolonged U.S. government shutdown, renewed U.S.–China trade tensions, and rising geopolitical stress—continue to fuel demand for gold as a safe-haven asset.
From an analytical standpoint, the path of least resistance remains to the upside, with no immediate signs that this trend is being challenged. At the time of writing, price is trading around 4,230 USD, up more than 250 pips since the session began. Bullish structures and orderly pullbacks keep repeating; as long as the marked supports on the chart hold, I believe the next move still offers solid opportunities for buyers.
What about you—how do you see XAUUSD? 💬Share your thoughts in the comments.
Good luck!

EURUSD – Bullish Breakout in Progress👋Hello everyone, what do you think about FX:EURUSD ?
Today, this pair continues to show strong signs of recovery after a prolonged downtrend. The price action has successfully broken above the descending trendline, which had acted as resistance for several weeks. This breakout, combined with the double bottom pattern forming around the 1.155 support zone, signals a potential shift in market structure from bearish to bullish.
As long as EURUSD stays above the broken trendline, the path of least resistance remains to the upside. We can look for bullish confirmation near the support area for potential entry opportunities targeting:
TP1: 1.175
TP2: 1.181
TP3: 1.186
💬 What’s your view — will EURUSD sustain this breakout or fall back into the range? Share your thoughts in the comments.
Good luck!

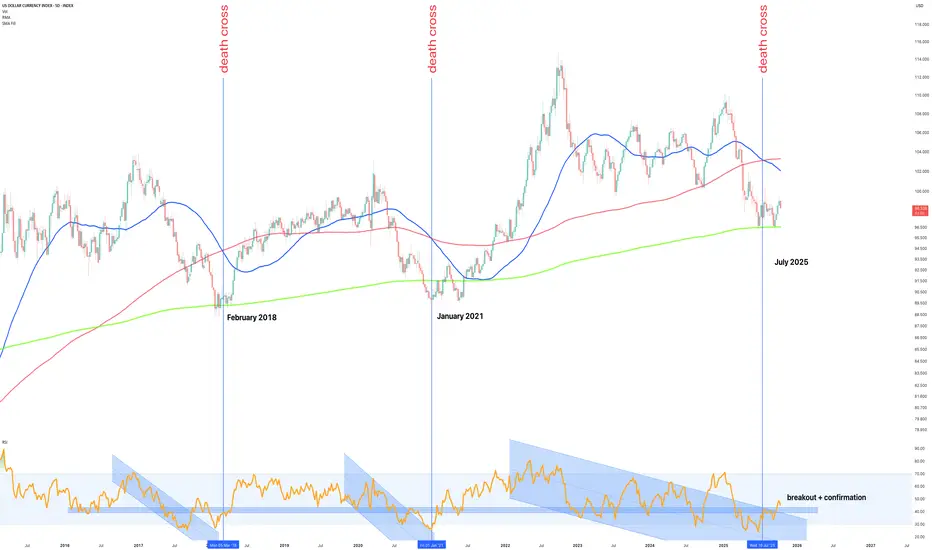
The Dollar Death Cross that marks the beginning – October 2025The term death cross often sends shivers through markets, but in the case of the US Dollar Index (DXY), it’s proven to be quite the opposite.
History tells us that every major death cross on the 5-day chart where the short-term 50 day simple moving average (SMA) crosses below the 200 day long term simple moving average (SMA), has in fact marked the end of a dollar downtrend, not the start of one. This is especially true after a test of the annual Rolling Moving Average (green line), as has just confirmed.
Look left:
February 2018, Death cross printed at the macro low. The dollar rallied for nearly two years.
January 2021, Death cross printed again, just before the dollar began its next sustained advance.
July 2025, Another death cross appears, once again coinciding with price touching the RMA, the same long-term structural support that has historically defined the beginning of each dollar bull cycle.
We can keep looking left if those last three dates do not satisfy, the story does not change, there is no “this time is different” while the DXY is in a macro uptrend.
Now, in October 2025, the RSI confirms a breakout from its multi-year descending channel, adding technical weight to what the moving averages are already signalling: the bear phase is likely over, and the next dollar bull market is quietly beginning. The 50 line is marked out, once it climbs above the rest is history.
What’s Next
Each of the prior bullish reversals began the same way:
1. Death cross, triggering capitulation sentiment.
2. Support test of the annual rolling moving average
3. RSI breakout and confirmation of trend reversal
That structure is now repeating almost perfectly.
If momentum follows prior cycles, the next 6–18 months could see the DXY recover toward the 105–110 zone, with potential for extension beyond 115 over the full bull phase.
A break and hold above 104 would confirm trend strength, while a close below the annual average around 96 would invalidate the structure and delay the signal.
This setup isn’t about calling tops or bottoms, it’s about recognising that death crosses on this timeframe have repeatedly marked strong uptrends for the dollar, not endings as the gold folks would have us believe.
Conclusions
The data is clear: every major death cross in recent DXY history has aligned with the start of a new bullish cycle. The 5-day structure, RSI breakout, and confirmation from the rolling annual average all point toward a macro reversal is underway.
The irony of the name death cross is not lost here, for the dollar, it often signals the exact opposite. If history rhymes once again, October 2025 will be remembered as the quiet beginning of the next US Dollar bull market.
Ww
==============================
Disclaimer
This post is for educational and informational purposes only and represents personal market analysis, not financial advice.
Currency markets are inherently volatile and influenced by complex macroeconomic factors. Always perform your own research, manage risk responsibly, and rely on confirmation, not emotion, when making trading or investment decisions.
Patience, data, and confirmation, the real currency of trading.
#XAUUSD: Small Time-Frame Big Trade! Comment Your Views! Price is at the 'premium buying level' at this point we could expect it to continue the bullish momentum towards 4300$ or $4350. Please use accurate risk management while trading gold.
Good luck

Gold can Fail its Rally and Fall Towards 4125Hello traders, I want share with you my opinion about Gold. The market for Gold has been through a highly complex and volatile phase after breaking down from its prior upward channel. This led to a significant fall into the support zone, followed by a strong recovery that has since pushed the price of XAU above a major ascending trend line. Currently, the asset is undergoing a corrective pull-back towards this broken trend line, setting the stage for what I believe is a critical test. In my mind, the price action is setting up a potential 'bull trap'. I expect that the price will first make a correction to the trend line, find support, and then attempt another rally. I think this rally will be exhaustive and will fail upon reaching the 4280 mark. A confirmed rejection from that peak would signal a major reversal. The subsequent decline should have enough momentum to break the major ascending trend line. Therefore, I have placed my TP for this reversal scenario at 4125. Please share this idea with your friends and click Boost 🚀
Disclaimer: As part of ThinkMarkets’ Influencer Program, I am sponsored to share and publish their charts in my analysis.

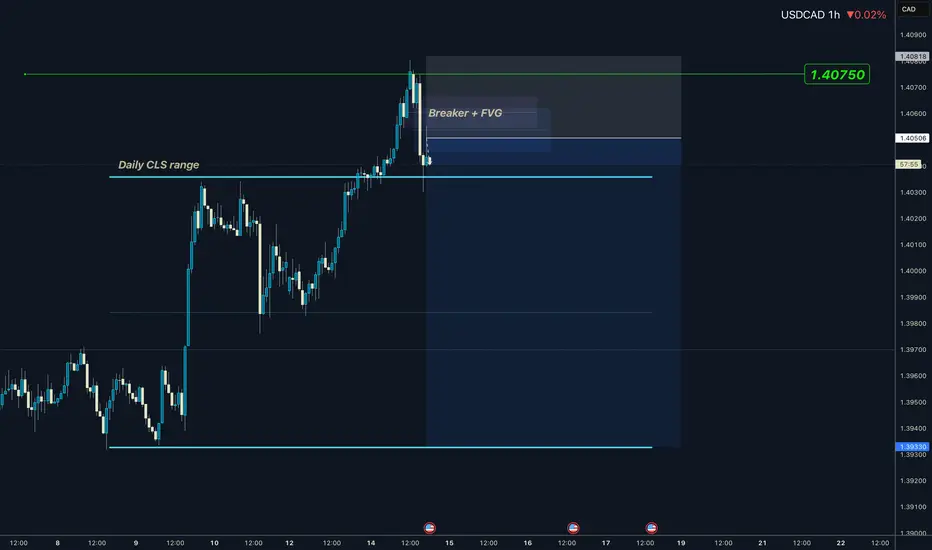
USDCAD I Daily CLS Range I Model 1 I Stop Hunt Hi friends, new range created. As always we are looking for the manipulation in to the key level around the range. Don't forget confirmation switch from manipulation phase to the distribution phase to make the setup valid. Stay patient and enter only after change in order flow. If price reaches 50% of the range take partial or full close.
📌 HTF - Higher Timeframe view
🧩 Complete proces and Strategy explained 👇 Click Below
🎯 Why your market approach also should be mechanical ?
NO Fixed Mechanical Trading Logic - You are guessing random patterns
NO Defined trading plan - Every trade different logic
NO Same logic in each trade - Not possible to backtest
NO Backtests on at least 300 trades - Not knowing Statistics
➡️ No Statistics ➡️ No Edge ➡️ Mindset ProblemS
🧠 Core of mindset problems
If you don't know your statistics on large enough data sample. You don't know your probabilities of win rate once the losing streak happen and it happens to every strategy. You will start doubting, hesitating to take next trade because you don't know statistics of your losses. In the end you will be doubting strategy and then jump to different one. You will be in the endless loop for years, looking for new better strategy. 👊 Your ultimate goal as a trader is not to be a generalist who knows 10 000 patterns. But rather create one system with narrowed criteria of each element of the trade to remove subjective and emotional decisions as much as possible and stick to this system no matter what. Practice it 10 000 times become a MASTER.
✨ Trading Mastery is reflection of your life
Have a longterm plan, No Alcohol & Drugs, Ignore others, Focus on your journey , Backtest regularly, Review your weeks, Journal mistakes, Exercise, Sleep well, Read books, Walks in nature (no phone) , Meditate, Reduce social media time, Spend time with family, Live Life.
Trading is hard, but not impossible. I believe in you 💪
David Perk aka Dave Fx Hunter
EURUSDHello Traders! 👋
What are your thoughts on EURUSD?
EUR/USD is currently trading below a key resistance zone and has already pulled back to the broken ascending trendline.
The price action suggests weakening bullish momentum, indicating a possible continuation to the downside.
After some short-term consolidation in this zone, the pair is expected to resume its decline toward the highlighted support area.
As long as the price remains below the resistance zone, the short-term outlook stays bearish.
However, a daily close above the resistance would invalidate this bearish scenario.
Don’t forget to like and share your thoughts in the comments! ❤️

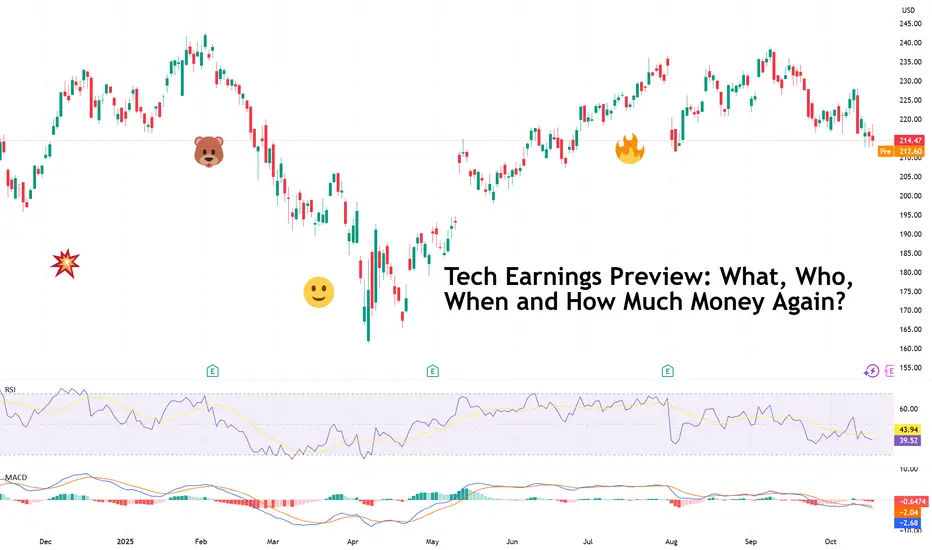
Tech Earnings Preview: What, Who, When and How Much Money Again?“ I don’t know, probably at least around $600 gazillion dollars ,” Zuck, probably if you asked him how much Meta NASDAQ:META will spend over the fiscal year.
It’s earnings season , which means Wall Street’s most expensive hobby — guessing how much the tech giants will make while pretending it’s about “long-term fundamentals” — is back in full swing.
💥 Welcome to Earnings Season
Happy third-quarter earnings, everyone. The candles are lit, the spreadsheets are out, and $1.6 trillion vanished from US stock valuations last Friday. Perfect timing.
Markets are reeling from tariff shocks and macro jitters, but traders have already shifted their gaze to the next big thing: Big Tech .
As is tradition, the Magnificent Seven — those trillion-dollar titans who make up roughly one-third of the S&P 500’s SP:SPX weight — are once again the main characters in this quarterly drama.
You’ve got AI. You’ve got spending. And you’ve got spending on AI.
🔔 Here We Go Again
This quarter, the storyline hasn’t changed much — it’s still “show me the money” season for artificial intelligence. Investors have spent the better part of two years rewarding CEOs for throwing the AI acronym in all their earnings calls. Is this time different?
• Amazon NASDAQ:AMZN reports the week of October 21, with everyone eyeing AWS — the quiet moneymaker funding Jeff Bezos’ rocket ambitions and your Prime Day discounts.
• Apple NASDAQ:AAPL , Microsoft NASDAQ:MSFT , and Meta NASDAQ:META follow around October 29. Investors will be laser-focused on who’s turning AI hype into product and revenue.
• And let’s not forget Alphabet NASDAQ:GOOGL , which already set the tone with a capex number that could fund a small country — $85 billion in 2025 alone , largely for AI infrastructure.
The question now: how much longer can these companies throw billions at Jensen Huang GPUs before shareholders start asking for a receipt?
🏗️ The AI Arms Race: Spending as a Strategy
The Magnificent Seven are still in an all-out hardware and data-center build-out. Meta’s Mark Zuckerberg is burning through cash to create the metaverse (yes, that still exists), but this time, powered by AI.
Nearly every megacap tech firm is building power plants to feed OpenAI. And Nvidia NASDAQ:NVDA — the company selling shovels in the AI gold rush — is counting every dollar.
Together, these firms are expected to spend hundreds of billions in the second half of 2025 just on computing power. Investors will be parsing every line of guidance for capex updates — because right now, spending is the strategy.
But the logic is sound (for now): If AI really does drive the next wave of productivity and profit, then whoever builds the infrastructure owns the future.
📊 The Numbers Game: What Wall Street Expects
Across the S&P 500 SP:SPX , earnings are projected to grow 8.8% year-over-year this quarter, on revenue growth of 6.4%, according to Seaport Research Partners. That may sound modest, but it’s for a reason: two-thirds of companies usually beat estimates.
Keep them achievable, and markets will celebrate. Pin them too high, and markets will be disappointed.
What’s more, earnings aren’t expected to stall anytime soon. FactSet data shows analysts projecting:
• 6.4% average annual sales growth for the S&P 500 through 2027
• 14% average annual earnings growth over the same period
That’s what rate cuts are supposed to do — a little liquidity trick, some risk-on mood, and suddenly even industrials and Buffett’s picks start looking interesting again.
Still, there’s one elephant in the room: valuation. The S&P 500 trades at 23 times forward earnings, which is, to use the technical term, “a lot.” At that level, even a small earnings miss could send stocks tumbling.
🧮 Winners, Losers, and the Market’s Short Memory
Some IPOs may have stolen headlines this year — looking at you, Figma NYSE:FIG and Circle NYSE:CRCL — but earnings season is where the real judgment happens.
A good report can add hundreds of billions in market cap overnight. But a bad one can do the same in the opposite direction .
Meta is under pressure to prove its huge spending on Superintelligence Labs is actually worth it. Apple’s got to show iPhone sales didn’t flatline in China. And Microsoft? Well, all it has to do is keep being Microsoft.
Amazon remains the dark horse. Its cloud business is stabilizing, retail’s humming along, and AI integration is just starting to take off. Traders are betting AWS will deliver, as it usually does.
🧘♂️ What Traders Should Watch
To navigate this volatility buffet, focus on:
• Forward guidance — Companies might beat earnings but guide lower, which can trigger pullbacks.
• Capex updates — Follow where the AI billions are flowing.
• Market reactions, not just results — The “sell the news” trade is real.
Sometimes the earnings game isn’t just about who made money — it’s about who surprised the market.
💡 Final Thought: Hype or Habit?
Big Tech’s gravitational pull on the markets isn’t fading anytime soon. Whether you’re bullish on AI or skeptical of its trillion-dollar promises, one thing’s certain — every move these companies make will ripple through every portfolio, index, and ETF on the planet.
As Q3 earnings hit full throttle, keep one eye on the charts and the other on the headlines . Because if there’s one thing Wall Street loves more than good earnings, it’s the story that comes after.
Off to you : How are you preparing to navigate the earnings season and the tech updates? Share your thoughts in the comments!