Bitcoin - Head and Shoulders to 115k - then dump below 105k!Bitcoin is currently corming a bullish reversal head and shoulders pattern! The price is curently near the right shoulder providing us with a great buying opportunity. What is the profit target? This is a very special situation, because we have an unfilled FVG (Fair Value GAP) right above the HaS neckline. I belieave the price could breakout this HaS pattern, but will get stopped by the GAP or by the major swing high above the GAP. A lot of traders have their stop loss orders above this major swing high, so this is where the whales can take liquidity and send it down.
After that, we may see a huge dump because it's September and it's statistically the worst performing month for Bitcoin and also for the stock market. This is my short term update on the price of Bitcoin, and my plan for September. I hope you like it!
Write a comment with your altcoin + hit the like button, and I will make an analysis for you in response. Trading is not hard if you have a good coach! This is not a trade setup, as there is no stop-loss or profit target. I share my trades privately. Thank you, and I wish you successful trades!
Community ideas

Lingrid | GOLD Weekly Market Outlook: Fed Cut Bets Drive Rally ?OANDA:XAUUSD surged Friday after disappointing payroll data showing just 22K jobs added versus 75K expected, solidifying Fed rate cut expectations at 87.8% probability for September's meeting. The precious metal has already hit record highs above $3,500, gaining over 30% year-to-date as weakening labor conditions fuel aggressive easing bets.
The 4-hour chart reveals gold touched above the $3,600 resistance zone with bullish momentum intact. If the market pulls back then there's 38.2% fibo retracement level to consider. Overall gain of 4.75% in one week suggests minor consolidation might occur before targeting the upper resistance around $3,650. The ascending channel remains unbroken, supporting continued upward movement.
The broader perspective shows gold emerging from a prolonged consolidation phase, with the recent breakout confirming a major $3,500 level. Gold initially demonstrated its first impulse leg, then moved sideways for four months, and is now in the process of forming its second impulse leg, which will end at around $3,660.
Some economists now debate whether the Fed might deliver a jumbo 50-basis-point cut given consecutive weak employment reports, which could propel gold toward the $3,660-3,700 correction zone upper boundary. Key support lies at $3500-3530, while sustained weakness could test the major trendline near $3,450.
If this idea resonates with you or you have your own opinion, traders, hit the comments. I’m excited to read your thoughts!

XAUUSDHello Traders! 👋
What are your thoughts on GOLD?
Following the release of the U.S. Non-Farm Payrolls (NFP) data on Friday, gold surged to the 3600 level before entering a corrective phase from that resistance.
We expect this pullback to extend further, potentially reaching lower support zones in the short term.
If gold finds support and reacts positively, a new bullish wave may begin.
A confirmed breakout above the 3600 level would open the door for a move toward the next key resistance around 3700.
As long as gold holds above the key support area, this bullish scenario remains valid.
Don’t forget to like and share your thoughts in the comments! ❤️

Gold (XAU/USD) –> Two Scenarios Hello guys!
Gold has been moving strongly inside an ascending channel on the 1H chart, showing consistent bullish momentum. Price is currently testing a key resistance area around $3,585 – $3,590. From here, one of two scenarios is most likely to play out:
Scenario 1: A short-term pullback toward $3,563 support, followed by a bounce that could fuel another leg higher. target will be near $3,630 – $3,650.
Scenario 2: A short-term pullback toward $3,580 support, pushing price toward the upper channel resistance near $3,630 – $3,650.
Both scenarios remain bullish as long as gold trades above $3,560. Only a clean break below this level would weaken the structure.
Overall, gold is set for further upside; the path depends on whether we see a retest first or an immediate breakout.
Disclaimer: As part of ThinkMarkets’ Influencer Program, I am sponsored to share and publish their charts in my analysis.

GBP/AUD - Triangle Breakout (08.09.2025)The GBP/AUD Pair on the M30 timeframe presents a Potential Selling Opportunity due to a recent Formation of a Triangle Breakout Pattern. This suggests a shift in momentum towards the downside in the coming hours.
Possible Short Trade:
Entry: Consider Entering A Short Position around Trendline Of The Pattern.
Target Levels:
1st Support – 2.0493
2nd Support – 2.0457
🎁 Please hit the like button and
🎁 Leave a comment to support for My Post !
Your likes and comments are incredibly motivating and will encourage me to share more analysis with you.
Best Regards, KABHI_TA_TRADING
Thank you.
Disclosure: I am part of Trade Nation's Influencer program and receive a monthly fee for using their TradingView charts in my analysis.

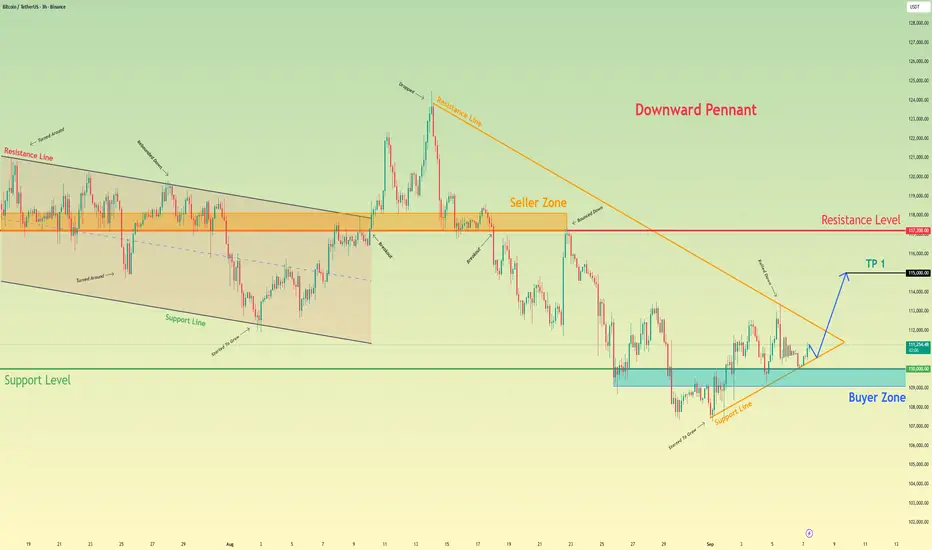
Bitcoin will exit from pennant and continue to growHello traders, I want share with you my opinion about Bitcoin. The market for Bitcoin has been undergoing a lengthy corrective phase, with the price action methodically descending since its last major peak. This bearish price action has been contained within a large downward pennant, a classic reversal pattern that suggests the preceding downtrend is losing momentum as volatility contracts. The price for BTC has been squeezed between the descending resistance line and an ascending support line. Currently, the asset is at a critical inflection point, as it is directly testing this ascending support line after a recent rejection from the upper boundary of the pattern. The primary working hypothesis is a long scenario, predicated on a bullish resolution from this dynamic support. The expectation is that buyers will defend this ascending support line, initiating a powerful rebound that is strong enough to cause a breakout above the pennant's main resistance line. This would signal a reversal of the recent downtrend. Therefore, the TP is logically placed at 115000 points, a prudent intermediate target aiming for a key area of prior price consolidation. Please share this idea with your friends and click Boost 🚀
Hellena | EUR/USD (4H): LONG to the resistance area 1.17800.Colleagues, I thought I'd update the forecast a bit.
The target remains almost the same, but the wave layout has changed slightly.
I believe that at the moment the development of wave “5” of the higher order and wave “3” of the lower wave is underway.
Therefore, I still consider the area of 1.15765 as a support area and the area of 1.17800 as a target area.
Manage your capital correctly and competently! Only enter trades based on reliable patterns!

GOLD → Strong bullish trend. What are the targets?FX:XAUUSD continues to rally on positive fundamentals that emerged at the end of last week. The market is pricing in an almost 100% cut in interest rates, which is weakening the dollar and supporting the metal...
Gold is holding close to its record high of $3,600 after extremely weak US employment data for August. This has reinforced expectations of a 25 bp Fed rate cut this month.
This week, attention is focused on the release of US inflation data (CPI and PPI). Inflation data in the US will confirm or adjust expectations for Fed policy easing. If inflation remains high, this could delay aggressive rate cuts and cause a correction in gold. For now, the bullish trend continues.
Resistance levels: 3615, 3634, 3650
Support levels: 3600, 3578
Technically, a strong bullish trend. Growth may continue after price consolidation above 3614-3615 or after a slight correction to support at 3600 relative to the current local rally.
Best regards, R. Linda!

THE KOG REPORTTHE KOG REPORT:
In last week’s KOG report we said we would be watching the open for a support level to form below and price to attempt the red box, which worked well. It’s that red box we said needed to be watched for the break, which if happened would see us attempt higher price starting with 3468 and above that 3485-90. Again, we broke, hit our targets on the chart and the red box targets early week.
We then released the NFP Report which gave the key level and the bias for the move. As you can see on that report, we managed to get almost a pip prefect move from the key level upside, nearly into the target level where we suggested the opportunity to short may come from this week
So, what can we expect in the week ahead?
For this week we have Cpi and PPi midweek so there is potential for this to either range up here, or, like we suggested in the NFP Report, a tap above and a move downside. What we would ideally like to see here is support attacked, defended, a move upside in to the 3606-10 region with extension into the 3620 level and a rejection from above. So, in this scenario, due to the stretch, we’re happy to test these levels with sensible risk but due to that stretch and the mean being way below, if we break above that 3620 level, we’re happy to let it go to where it wants before looking for a reversal.
We’re going to keep it simple, lets see how we open and then we’ll have a better idea of what to expect for the rest of the week.
As usual, we’ll update traders through the week with our plans and trades.
As always, trade safe.
KOG

Gold still in bullish move Gold (XAUUSD) is trading around 3581, holding above the support trendline and new support area. Price recently reached the all-time high zone at 3611 and remains bullish while above 3531 support, with potential for further upside.

Ethereum climbing, but RSI throwing shade stay sharpGuys, I’ve also put together an Ethereum analysis for you.
Ethereum is an amazing coin that’s not up for debate. But it’s already climbed quite a bit. I haven’t bought in at this point, but if it drops to the 3,538.0 – 3,357.0 range, I’d definitely be looking to buy.🔥
Right now, we’re in an uptrend, but on the 1‑day chart I spotted a divergence on the RSI indicator. It looks like this divergence might be playing out. If the price falls below the 4,000 level, that would confirm the divergence is in effect.
Guys, I would like to thank everyone who supports my analyses with their likes. Your likes boost my motivation, and that's why I share these analyses.
COFFEE At Crossroads: Up or down?COFFEE has seen a strong impulse to the upside. But guess what? Now price is being coiling into a tight triangle. In this case, there are two scenarios possible, and taking into account that the market conditions are bullish, I am more inclined to say that the price will break to the upside of the triangle formation.
Do you agree? Drop a comment below. Engaging with the TradingView community is always helpful to improve and grow as traders.
Not financial advice, just sharing my thoughts on the charts. Trade safely 😊

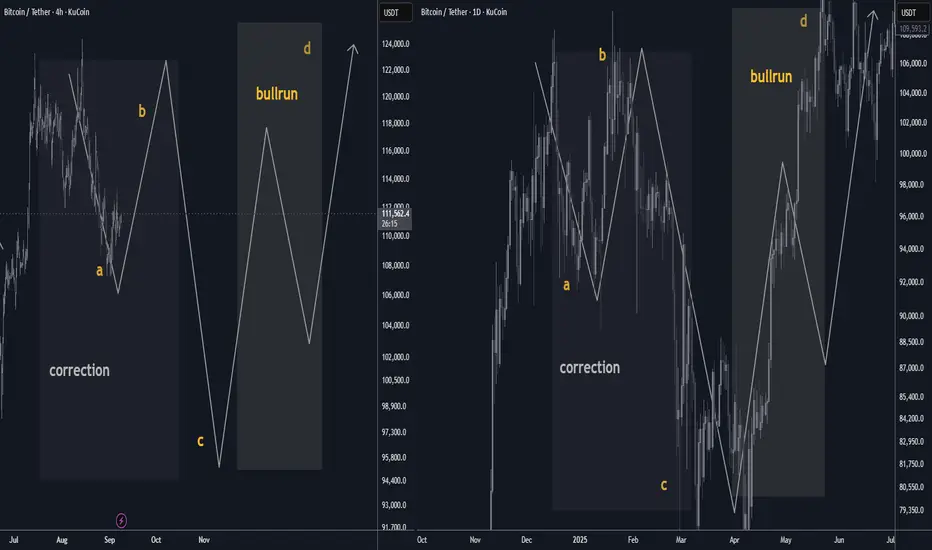
Bitcoin September 2025 Outlook: a/b/c price fractal structureBTC enters September post-ATH with a seasonal headwind. Base case: a ~10% A-leg dip toward $108k, a B-bounce into ~$122k, then a C-flush near ~$94k—echoing April’s ABC rhythm. Once complete, the uptrend should re-assert into year-end. 📉🔁📈 #Bitcoin #Seasonality #Crypto
🟠 Bitcoin September Outlook: Seasonality vs. Structure
After a fresh ATH, September’s historical bias skews mildly red. Base case is a ~10% A-leg dip that develops into an A/B/C correction before trend continuation. Think controlled pullback → consolidation → next markup. 📉➡️🔁➡️📈
________________________________________
🗓️ Seasonality Snapshot (2015–2024)
• Mean (10-yr): −2.55% · Median: −4.52%
• Red months: 6/10
• Worst September: 2019 (−13.88%)
• Best September: 2024 (+7.39%)
• Last 3 yrs avg: +2.8% (2024 +7.39%, 2023 +3.99%, 2022 −3.09%)
• Last 5 yrs avg (2020–2024): −1.3%
Read: September has tended to be weak, but the last two years printed green. Seasonality is a headwind—not a handbrake. 🌬️
________________________________________
🧩 Structure Thesis (Fractal Analog)
You’re looking for a repeat of April 2025’s A/B/C rhythm—scaled up:
• April 2025 reference: A ≈ $92k → B ≈ $106k → C ≈ $80k
• Now (projected):
o A ≈ $108k (≈ 10% pullback from recent highs) 📉
o B ≈ $122k (relief rally / lower high) 🔁
o C ≈ $94k (final flush into demand, completing the correction) 🧱
Interpretation: A measured September fade aligns with the A-leg. A reflexive B-bounce can follow as funding resets and late longs get cleaned up, with a C-leg completing the pattern before the next expansion. 🚀
________________________________________
📊 How Seasonality Supports the Call
• Typical drag: Median −4.5% and multiple red Septembers justify a down-bias.
• Volatility window: The historical 21-point spread (best +7.39% vs worst −13.88%) means a 10% dip sits well within normal bounds.
• Cycle context: With a new ATH just printed, a shallow corrective phase is constructive—not bearish regime change.
________________________________________
🧭 Levels & Triggers
• Bias line: Momentum cools into $108k → watch for seller absorption and open interest reset.
• Relief cap: $122k acts as B-rally resistance; sustained closes above $122k would invalidate the ABC idea and argue for immediate continuation. ✅
• Completion zone: $94k (C) is the buy-the-dip completion area; clean breaks below raise risk of a deeper time correction rather than a swift V-reversal. ⚠️
________________________________________
🧪 What to Monitor (Confirmation/Invalidation)
• Liquidity & OI: De-leveraging into A, controlled OI rebuild into B, washout into C.
• Spot-ETF flows / stablecoin issuance: Weakening into A, stabilizing by late month supports B→C rhythm.
• Funding/basis: Overheated → normalize during A; negative spikes near C often mark capitulation.
• Breadth (alts): Underperform into A/C; broad risk-on breadth usually returns post-C.
________________________________________
📝 Base Case Path (Textbook)
September: drift to $108k (A) → bounce toward $122k (B) → final tag of ~$94k (C) → reset + markup into Q4.
(If price reclaims and holds above $122k early, treat that as trend continuation—not a correction.)
________________________________________
🔒 Risk Notes
• Seasonality is a tendency, not a rule. Macro catalysts (CPI, policy, liquidity) can dominate calendar effects.
• This is market commentary, not financial advice. Manage risk and invalidation levels. 🛡️
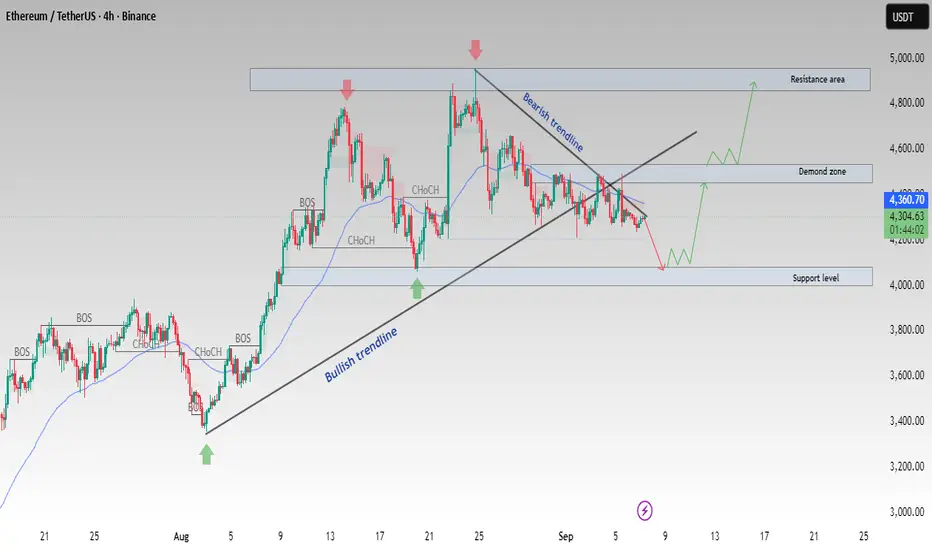
ETH/USDT at Key Demand Zone–Bullish Reversal or Deeper Pullback?Ethereum (ETH/USDT) on the 4H timeframe is trading near a critical demand zone after pulling back from resistance.
Key technical notes:
Bullish trendline supported recent upward moves
Bearish trendline currently limiting upside momentum
Price is consolidating between demand zone (4,200 – 4,300) and resistance (4,600 – 4,800)
If demand holds, ETH could rally back toward 4,600 – 4,800 resistance
A breakdown below demand may lead to a retest of the 4,000 support level
📌 The structure suggests a potential bullish reversal, but confirmation is required with a break of the bearish trendline and demand reaction.
This analysis is for educational purposes only. Always use proper risk management and do your own research before trading.
US100 - New Highs are coming!Market Context
The US100 is trading within a strong bullish structure after bouncing from a well-defined support zone. Price has been respecting key levels on the way up, forming fair value gaps (FVGs) that act as stepping stones for continuation. The overall picture points to a market that is building momentum for a potential liquidity grab higher.
Support Zone & Initial Rally
The chart shows a strong support zone at the lows, which provided the foundation for the current bullish impulse. Once price tapped into this area, buyers stepped in aggressively, leaving behind multiple bullish imbalances on the way up. This confirms that institutional interest is present at these levels.
Fair Value Gaps & Structural Strength
On the rally, price created overlapping FVGs, including a bullish fair value gap and an inversion fair value gap (IFVG). Importantly, candles never closed below the primary FVG — reinforcing its validity as strong demand. This means that even if price retraces, these areas will be closely watched for re-entries.
Liquidity Grab & Next Move
Above current price action lies a clear buy-side liquidity (BSL) level. The market is likely to target this zone, either directly from current levels or after a retest into the stacked FVGs. A liquidity sweep above the highs would be the natural continuation of the bullish structure, unlocking the potential for new short-term highs.
Final Thoughts
The US100 is showing a textbook bullish setup: strong support, healthy retracements, and unmitigated FVGs acting as demand. As long as the lower support holds, the expectation remains for a run into the BSL above.
If this analysis brought value, drop a like — and let me know: are you waiting for the retest, or do you think the market runs the highs straight away?

08.09.25 Morning ForecastPairs on Watch -
FX:EURUSD
FX:GBPUSD
FX:EURCAD
FX:AUDJPY
A short overview of the instruments I am looking at for today, multi-timeframe analysis down to what I will be looking at for an entry. Enjoy!

EUR/USD | EUR/USD Breaks 1.17 – Eyes on 1.176+ Targets! (READ)By analyzing the EUR/USD chart on the 4-hour timeframe, we can see that the price held at the 1.16 demand zone as expected and managed to climb above 1.17 with confirmation. Currently, it’s trading around 1.173. If the price can break the 1.174 resistance and close above it, we can expect further upside.
The possible bullish targets are 1.176, 1.177, and 1.179.
Please support me with your likes and comments to motivate me to share more analysis with you and share your opinion about the possible trend of this chart with me !
Best Regards , Arman Shaban

Ethereum (ETH/USD) Daily UpdateETH had a strong rally through July–August, but now price is consolidating between $4,200–$4,500.
✅ Bullish Case
If ETH holds above $4,200 support and breaks past $4,500 resistance, we could see momentum carry toward $4,800–$5,000 next.
❌ Bearish Case
If ETH loses $4,200 with a strong close, watch for a deeper pullback toward $3,950–$3,800.
🎯 Takeaway
ETH is in a sideways consolidation after a strong run. The next breakout from this range will likely decide the next big move.
👉 Are you leaning bullish continuation or bearish pullback here?
Don't forget to follow me, boost this post and comment your ideas.
-Neo

EURJPY: Range Trading Setup - Bullish Movement is ExpectedEURJPY: Range Trading Setup - Bullish Movement is Expected
EURJPY is moving within a trading range with well-defined boundaries between 172.50 - 173.25
Price tested the 172.50 area and reacted well. It is likely to rise once again to develop a broader pattern.
Main targets: 173.00 and 173.25
The bullish momentum that has surrounded the EURO for a long time can continue to push EURJPY further.
You may find more details in the chart!
Thank you and Good Luck!
❤️PS: Please support with a like or comment if you find this analysis useful for your trading day❤️

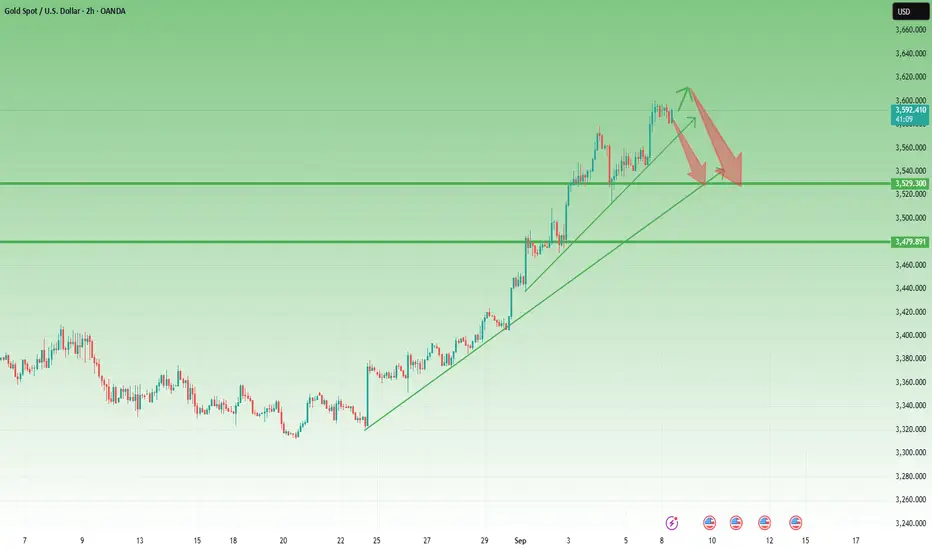
Fearless Bulls, Straight-Line Rise – But Mean Reversion CallsLast week Gold bulls were fearless – we witnessed three all-time highs within a single trading week. The market closed on Friday just below 3600, locking in an impressive 1,500 pips weekly gain. There is no doubt: the trend remains firmly bullish.
But let’s add some perspective. Even if XAUUSD were to drop 1,000 pips from current levels, that move would count as a minor correction within the dominant bullish trend. That’s how extended this rally has become.
📌 Another element supporting the correction scenario is the parabolic nature of the latest move. From the 3300 zone, the rally has been almost a straight vertical line, leaving gold strongly overextended and far away from the mean. Markets rarely sustain such deviation without at least a temporary pullback.
🔑 Trading Plan: While acknowledging the risks of counter-trend setups, I will look for short opportunities. In my view, there is more room to the downside than upside in the short term.
Target for correction: 3530 confluence support zone.
As always, the trend is still bullish, but corrections are part of the game. A disciplined trader must know when to step aside – and when to take the contrarian shot. 🚀
USDCHF Breakout and Potential RetraceHey Traders, in today's trading session we are monitoring USDCHF for a selling opportunity around 0.79950 zone, USDCHF was trading in an uptrend and successfully managed to break it out. Currently is in a correction phase in which it is approaching the retrace area at 0.79950 support and resistance area.
Trade safe, Joe.

Latest Gold Price Update Today👋 Hello everyone , what are your thoughts on OANDA:XAUUSD ?
After Friday’s impressive breakout, gold is now showing signs of a pullback at the upper resistance zone, forming lower highs and currently trading around 3590 USD.
The main scenario still favors the bullish side, but I believe a correction is likely before the primary uptrend resumes. That’s the reason behind today’s retracement. The first key support to watch is 3577 USD, followed by the 3565 – 3560 USD zone.
And you—do you think gold will pull back further or continue its rally? Leave your thoughts in the comments and give this post a like if you agree with my view.
Good luck!

Gold with bullish momentum still intactGold touched above the 3600 level, with bullish momentum still intact. If the market pulls back, watch the 38% Fibonacci retracement level as a potential support. Overall, gold has gained 4.75% in one week, suggesting that a minor consolidation could occur before the next move toward the upper resistance around 3620.
President Donald Trump’s recent move on Friday exempted graphite, tungsten, uranium, gold bullion, and other metals from tariffs, while subjecting silicon products to new levies.
You any find more details in the chart.
Trade wisely best of Luck.
Ps; Support with like and comments for better analysis.
