SPX500 | Hits 7,000 as Big Tech Earnings Fuel Risk AppetiteSPX500 | Tags 7,000 as Big Tech Earnings Reignite Risk Appetite
The S&P 500 touched the 7,000 level for the first time, as investors embraced risk amid a heavy flow of big tech earnings. Strong results from Microsoft and Meta, despite elevated AI spending, reinforced confidence in growth, while Tesla gained even after reporting its first annual revenue decline.
Markets largely looked past recent Greenland-related geopolitical jitters, returning focus to earnings momentum. While round numbers often attract headline-driven flows and profit-taking, breaking above them typically signals underlying confidence, even if follow-through takes time.
Technical Outlook
The bullish structure remains intact as long as price trades above the 6988 pivot.
Holding above 6988 supports a continuation toward 7020, with further upside potential toward 7050, marking a new all-time high zone.
A move below 6988 would trigger a short-term pullback toward 6972.
Further downside below 6972 would open the way for a deeper correction toward 6941.
Key Levels
• Pivot: 6988
• Support: 6972 – 6941
• Resistance: 7020 – 7050
Community ideas

Nikkei 225: Coiling below January highs as bulls await a breakWith the yen showing signs of stabilisation, buoyancy in Japanese equities may soon return, putting a potential retest of recent highs back in play.
Looking at our Nikkei 225 contract, price is coiling within a symmetrical triangle structure inside a prolonged bullish trend, putting traders on alert for a potential retest and break of the January high at 54,500.
There are a few setups for traders to consider, depending on how the price action evolves today.
Should we see a retest and bounce from triangle support, longs could be set above the level with a stop below, initially targeting triangle resistance. If price instead pushes up toward triangle resistance and once again fails to break cleanly through the level, the setup could be flipped, allowing shorts to be established beneath resistance with a stop above for protection, targeting triangle support.
Given the coiling pattern price finds itself in, traders should also be on the lookout for a potential bullish breakout, which would put the January highs firmly in play. A break and close above triangle resistance, or a decisive intraday breakout, would allow longs to be set with a tight stop below, initially targeting 54,500. Given the multiple failures above 54,000, a close above that level would improve confidence not only in a retest of 54,500 but also in a resumption of the broader bullish trend.
While RSI (14) and MACD are pushing lower, with the latter having already crossed the signal line from above, the message from the oscillators is more one of caution for bulls rather than an outright bearish signal for shorts. It reinforces the idea that setups shouldn’t be forced, and that patience is key while price works through this consolidation.
Good luck.
DS

Lyft Pulling Back After A Break Of Range - Long SetupLyft is pulling back to Wyckoff's "last point of supply", looking ready for markup phase. More likely than not that it will not retrace back to the lower buy zone. Risk/Reward our target is exceptional.

$META TO THE MOON!!! This is a weekly of NASDAQ:META , which reported earnings post-session yesterday. To say the market responded favorably is an understatement. Zuck is swinging for the fences with AI, and the capital markets like what he is doing. If most people's jobs eventually get replaced by AI, why not at least invest in the future of this disruptive societal and technological shift? If you can't beat 'em, join 'em!
Check out how price seems to be rotating toward buy-side liquidity (upwards) in the large channel (dark green horizontal lines) now that it has recently closed above the weekly 50-period EMA (purple line just below price). My theory of price movement is base upon liquidity price can travel to to punish those on the other side of the trade, and there is a LOT of buy side liquidity for price to be attracted to. Check out the large bear bar from the week of October 27, which tested the EMA; price may very well take its liquidity this week!
I anticipate a continuing bullish rotation in the channel, with logical market objectives including $800 (round psychological number), the R1 PP at 810.96, and if it closes strong after testing that, a rotation to the upper bound of the channel close to $900.
I would enter at the market today at open, if you were not already in this name before earnings. Use a size you do not mind losing with!
I would place a stop loss at 598, which is just below the large bull bar from last week. Incidentally, I just noticed that formed a 2 bar bullish engulfing pattern with the smaller bear bar from the week before that...Further confluences include the imminent bullish MACD crossover (highlighted in the bottom pane with a green circle).
Disclaimer: DO NOT TAKE THIS TRADE! DO NOT FOLLOW MY ADVICE!
Best,
MrJosephTrades


Nippon Seiki (Japan) - Tech Leader Testing Another RunNippon Seiki Co Ltd has been a standout performer in the Japanese market lately, putting up a gain of over 120% in the last twelve months. Based in Nagaoka, they are a major global player in automotive and motorcycle instrumentation, specifically known for their high-end head-up displays (HUDs) and digital clusters . While many know them for their car tech, their recent momentum has actually been supercharged by massive demand for motorcycle displays across India and Southeast Asia .
Fundamentally, the story here is about shifting gears and better margins. While the car market in China has been a bit sluggish, the company has offset that with explosive growth in the two-wheeler segment. They also recently updated how they collect development costs from customers, which gave a nice boost to their operating profit. The recent minor pullback from the January highs seems to be simple profit-taking ahead of their Q3 earnings release in early February. It’s also worth noting they’ve been active with share buybacks and just confirmed a solid dividend , which usually helps keep a floor under the price.
Technically, the chart shows a classic trend-following setup. After a vertical move to start the year, the price has drifted back toward the 20-day moving average. This area has acted as a springboard several times over the last six months, and we are seeing price action start to stabilize right where you’d expect. The RSI has cooled off from overbought levels and is now sitting in a much more neutral zone, giving it room to move if the buyers step back in. The MACD is crossing lower, which confirms the short-term pause, but the long-term trend remains firmly pointing up.
Could be one to keep an eye on.
..................................................
PLEASE NOTE: Nothing I post is trading advice. All investing involves risk, and past performance doesn’t predict future results. Trends can and do end. For 2026 , my goal is to try and post one new asset each day. Something outside the usual gold, silver, BTC, or big tech names. I like to find stocks worldwide showing steady trends with some good gains, a recent pullback, and signs of renewed strength. I don’t necessarily hold positions in these. They are simply companies I find interesting at the time of posting. I’ll often revisit them within a week to see how they went and share any updates. If you enjoy these posts, please BOOST and FOLLOW ME to discover more under-the-radar stocks and businesses from around the world.
..................................................

Nifty levels - Jan 30, 2026Nifty support and resistance levels are valuable tools for making informed trading decisions, specifically when combined with the analysis of 5-minute timeframe candlesticks and VWAP. By closely monitoring these levels and observing the price movements within this timeframe, traders can enhance the accuracy of their entry and exit points. It is important to bear in mind that support and resistance levels are not fixed, and they can change over time as market conditions evolve.
The dashed lines on the chart indicate the reaction levels, serving as additional points of significance to consider. Furthermore, take note of the response at the levels of the High, Low, and Close values from the day prior.
We hope you find this information beneficial in your trading endeavors.
* If you found the idea appealing, kindly tap the Boost icon located below the chart. We encourage you to share your thoughts and comments regarding it.
Wishing you success in your trading activities!

EURUSD, Elliott wave analysis■Outlook of EURUSD on 1M chart.
We are currently in wave Y, a sub‑wave of the upper‑degree wave B.
The internal structure of wave Y formed a Regular Flat. The wave preceding wave Y, wave X, formed a Flat with an extended (C)-wave, and the wave before that, wave W, formed an Expanded Flat.
If this interpretation is correct, wave Y has already completed (Rule of Alternation), and the next move will be the start of the upper‑degree wave C. This suggests that the market is likely to turn bearish.

GER40 (DAX) – trading plan for today | January 30🔥 GER40 (DAX) – trading plan for today | January 30
The day's opening occurred below the important level of 24,557, with this level situated below the Point of Control (POC).
Such an opening structure creates a short bias for today and indicates a seller's advantage.
As long as the price remains below the key level, the priority stays with downward movement.
Plan for today (short)
Today's target:
– lower daily short zone: 24,292 – 24,185
With increased selling pressure, a potential continuation may occur:
– weekly reversal zone: 24,089 – 23,959
In these areas, I expect:
– partial position closures,
– possible buyer reaction.
Loss of short bias
The short scenario will only be questioned if the price closes above the daily important level of 24,557.
In this case, potential movement opens up:
– to the weekly important level of 24,778
Make trading decisions strictly based on price reaction and confirmation.

Meta Platforms Shares Rise Above $700 After Earnings ReleaseMeta Platforms (META) Shares Rise Above $700 After Earnings Release
Yesterday, Meta Platforms published its fourth-quarter 2025 earnings report, which made a strong impression. In after-hours trading, META shares surged by more than 10% at one point, reaching around $740.
Why META Shares Are Rising
The company not only met analysts’ expectations but significantly exceeded them:
→ Earnings per share (EPS): actual $8.88 (expected $8.19–8.21), up 11% year-on-year.
→ Revenue: actual $59.9bn (forecast around $58.35bn).
In addition, the media highlighted several positive factors:
→ A strong outlook for 2026.
→ A high operating margin of around 41%, demonstrating strong business efficiency despite substantial spending.
→ Continued growth in advertising services: the company has integrated AI into ad delivery, with growth seen both in ad pricing (+6%) and the number of impressions (+18%).
A particularly important development was Mark Zuckerberg’s statement that the Reality Labs division is expected to pass its peak loss this year. This reassured investors concerned about prolonged cash burn related to capital expenditure.
Technical Analysis of the META Chart
On higher timeframes, the price remains in an uptrend. In January, the lower boundary of the long-term channel once again acted as support (indicated by the arrow).
In pre-market trading, META is quoted around $715–720. If the main session opens in this area, two observations appear especially important:
1 → The price is breaking upwards out of a descending channel (shown in red), which can be interpreted as an intermediate correction — a classic bull flag — within the broader prevailing uptrend.
2 → The price is moving above a key area that includes the psychological $700 level, which has acted as both support and resistance since July 2025. This zone may now provide a base for bulls in their attempt to move towards the median of the long-term channel.
This article represents the opinion of the Companies operating under the FXOpen brand only. It is not to be construed as an offer, solicitation, or recommendation with respect to products and services provided by the Companies operating under the FXOpen brand, nor is it to be considered financial advice.


ES - January 29th - Daily Trade PlanJanuary 29th - Daily Trade Plan - 5:51am
*Before reading this trade plan, if you did not read yesterday's take the time to read it first! (You can view the posts in the related publication section) *
If my posts provide quality information that has helped you with your trading journey. Feel free to boost it for others to find and learn, also!
My daily trade plan and real-time notes that I post are intended for myself to easily be able to go back and review my plan and how I did from an execution perspective.
--------------------------------------------------------------------------------------------------------
We are entering the end of the month, and you can clearly see that Institutions have been buying and keeping price above the 6975 level all week. Our weekly high is 7042 and we had some great levels yesterday. Each day we have 2-3 key levels that I patiently wait for price to flush and reclaim. My core edge is to ride price higher with Institutions. This takes losing a key level, running stops and continuing higher. When you are a retail trader, it is difficult to be at your desk each day when price loses and reclaims one of those levels. Patience is key and setting up a system to capture the 2-3 core levels daily is not about the next technical indicator but understanding how to setup, implement and execute a system. The question you have to ask yourself is this...
Do I have a system that can execute the outcomes I want to achieve from trading? If not? Why not? Trading is repetitive and boring. If you are chasing the next indicator or watching your next FVG online video, you do not have a system in place.
----------------------------------------------------------------------------------------------------------
Around 4pm yesterday price flushed down to 6977 (2pts shy of the 6975 level) and immediately ran stops and ran higher into yesterday's opening range around 7022. Overnight we came back down to yesterday's low at 6990 (2:30pm low) and reclaimed around 8:45pm and rallied into the 7028 overnight high. That is a nice 40pt move. Why does all of this matter? It helps us identify our key levels for today.
Key Levels Today -
1. 7017 - Flush and Reclaim
2. 7006 - Flush and Reclaim
3. 6990 - Flush and Reclaim
4. 6975 - Flush and Reclaim
Until price loses 6975 and cannot reclaim that level or price clears 7042 and continues higher, we are in a range that could produce a decent sell off next week as we enter into February.
7028 is a solid resistance level. If price can clear that level, the back test of it would be actionable.
I will post an update around 10am EST.
----------------------------------------------------------------------------------------------------------
Purple = A Weekly Low (Current or Previous Week)
Blue = A previous day low (Day before or day in the past week)
Red - Overnight Session High/Low (Prior to my post)
White = Key Support/Resistance Levels

THE MAIN BACKBONE $ETH It held everything from the $880 bottom in 2022 to the $1520 bottom in 2023.
Fakeout (Bear Trap): In mid-2025, price dipped below this line (the middle blue arc). While everyone screamed "ETH is over," it was just a liquidity flush. Price is now back ABOVE this main trendline.
The trend was not violated; it was stress-tested. The direction is still UP.
INVERSE HEAD & SHOULDERS
Look at the blue arcs drawn at the bottom of the chart. This is a textbook, gigantic Inverse Head & Shoulders pattern.
Technical Target, When this pattern plays out, it typically travels the depth of the head upwards. This takes us directly back to the old All-Time Highs (ATH).
THE PIVOT POINT: THE $2800 FORTRESS 🏰
Pay attention to the green dotted line (2,817 level).
SR Flip (Support/Resistance Flip): This was the ceiling that couldn't be broken in 2024. Now, it is the floor the price is sitting on.
Status: ETH is currently at $2,951, holding above this critical support. As long as $2,800 is defended, the structure is BULLISH.
THE SILENT STORM
While the market is busy talking about Solana, SUI, or AI coins, Ethereum is quietly building the largest accumulation structure in history in the background.
Psychology: Investors are "tired" of ETH. This is a bottom signal.
It is above the rising trendline and forming a massive IH&S.
First stop is $4,100 (Upper green line). Once that breaks, price discovery begins.
"When elephants walk, the earth shakes." ETH currently looks like a sluggish elephant preparing to move, but once it starts running, it won't stop to pick up passengers.
With a stop-loss below $2,800, this zone (Right Shoulder) offers a perfect Risk/Reward ratio.
ALso check
ETHBTC
8 years breakout EVE here

CHFJPY Is Bullish! Buy!
Please, check our technical outlook for CHFJPY.
Time Frame: 4h
Current Trend: Bullish
Sentiment: Oversold (based on 7-period RSI)
Forecast: Bullish
The market is on a crucial zone of demand 197.884.
The oversold market condition in a combination with key structure gives us a relatively strong bullish signal with goal 199.265 level.
P.S
Overbought describes a period of time where there has been a significant and consistent upward move in price over a period of time without much pullback.
Like and subscribe and comment my ideas if you enjoy them!

WILL GOLD PRINT 5750, DESPITE GOLD CRUSHED $3 TRILLION USD ?Gold is currently trading around the 5344 level, with 5100 acting as key support and 5600 as major resistance. After a recent corrective phase driven by profit-taking, price action appears to be stabilizing, keeping the broader structure constructive.
Ongoing geopolitical tensions, along with continued central bank buying, are supporting demand for safe-haven assets. In particular, renewed US–Iran tensions over the nuclear deal have added to market uncertainty, helping to underpin gold prices.
If bullish momentum resumes and resistance is cleared, the 5750 level comes into focus as a potential upside area. Monitoring price reaction around key levels will be essential.

COPPER (XCU/USD) SHORT SIGNAL
Entry: Around current levels ~6.260 - 6.323 (near recent high / retracement zone after strong bullish impulse)
Bearish confirmation: Price in retracement phase after massive rally, targeting to fill the FVG (Fair Value Gap) below + potential CHOCH (Change of Character) confirmation
Target: 6.200 – 6.150 (FVG fill zone / previous BOS area) or lower toward 6.000 support
Stop Loss: Above 6.330–6.340 (above the recent high/red box to invalidate the short setup) Watching for bearish momentum as copper pulls back to balance after the explosive move! #Copper #XCUUSD #CopperPrice #ShortCopper #Commodities #Trading #FVG #SmartMoney Not financial advice — This is just my personal view based on the chart. Trading involves significant risk, especially in volatile commodities like copper—do your own research, use proper risk management, and never risk more than you can afford to lose!

USD/CAD Falls Below the 2025 LowUSD/CAD Falls Below the 2025 Low
Yesterday, financial markets were closely watching statements from central banks regarding interest rates, including the Federal Reserve and the Bank of Canada. According to Forex Factory:
→ The Federal Reserve kept the Federal Funds Rate at 3.75% by a majority vote. “The economy has once again surprised us with its strength,” Powell said at the press conference. The Fed Chair also added that “our policy is in a good place”.
→ The Bank of Canada left the Overnight Rate unchanged at 2.25%. In its official statement, significant attention was paid to the impact of uncertainty surrounding the trade agreement between Canada, the United States and Mexico (CUSMA).
Although there were no surprises and the central banks’ decisions matched analysts’ forecasts, the reaction of the USD/CAD pair was quite dynamic. After a spike in volatility, the exchange rate fell below the 2025 low. Moreover, on higher-timeframe charts, a bearish break of support is visible, with that support running through the lows of 2023–2025.
Technical Analysis of the USD/CAD Chart
On 19 January, when analysing the USD/CAD chart, we:
→ highlighted important signs of bullish weakness on the chart;
→ suggested that bears might seize the initiative and attempt a break of the local ascending channel (shown in blue).
Indeed, a bearish breakout occurred, after which the price formed a trajectory resembling an accelerating plunge (approximately −2.7% over 10 days). At the same time, there are grounds to assess the market within the context of a long-term downtrend (shown in red).
In this context, we see that the price is near the lower boundary of the channel, which may act as support and slow the decline. However, even if bulls attempt to form a rebound, they are likely to face significant difficulties, because:
→ the price fell aggressively from the median to the lower boundary and broke the December low with virtually no local recoveries;
→ the area around the 1.3650 level appears to be a key resistance zone.
Thus, the USD/CAD exchange rate reflects the broader January trend, in which the US dollar is under considerable pressure due to geopolitical and other factors. Notably, even Powell’s comment about the “strength of the economy” failed to support the dollar. This suggests that the market may currently be driven not by past successes of the US economy, but by concerns about future uncertainty.
This article represents the opinion of the Companies operating under the FXOpen brand only. It is not to be construed as an offer, solicitation, or recommendation with respect to products and services provided by the Companies operating under the FXOpen brand, nor is it to be considered financial advice.

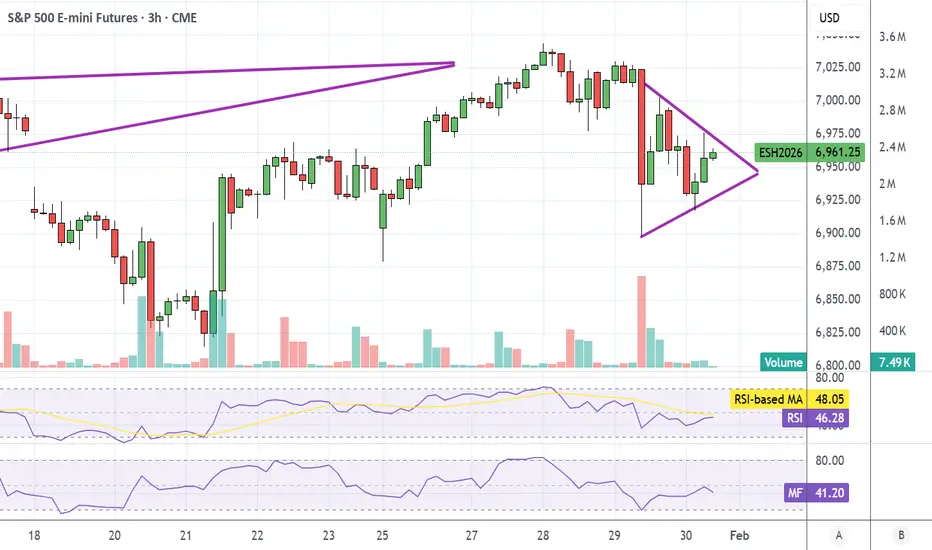
ES UpdateCOuld be forming a pennant here, if it does expect a whipsaw day today.
Probably not gonna be a good day to day trade, but I could be wrong.
Bitcoin Loves Bulls Right Now… Until This HappensYello Paradisers! Enjoy the video!
And Paradisers! Keep in mind to trade only with a proper professional trading strategy. Wait for confirmations. Play with tactics. This is the only way you can be long-term profitable.
Remember, don’t trade without confirmations. Wait for them before creating a trade. Be disciplined, patient, and emotionally controlled. Only trade the highest probability setups with the greatest risk to reward ratio. This will ensure that you become a long-term profitable professional trader.
Don't be a gambler. Don't try to get rich quick. Make sure that your trading is professionally based on proper strategies and trade tactics.

Silver Is Digesting the Breakout — Continuation Depends Hello traders, Silver is currently trading near $114.60, following a strong impulsive advance that previously pushed price into all-time high territory. That expansion leg was sharp and initiative-driven, confirming that the broader bullish structure remains intact. Since then, price has transitioned into a controlled pullback and rotation phase, which is a typical response after vertical price discovery.
From a structural standpoint, the recent retracement remains corrective rather than impulsive. Price has pulled back toward the former breakout region around $112.60–$113.00, an area that now acts as a key technical reference. This zone represents short-term balance, where the market is reassessing participation rather than distributing aggressively.
Below current price, the highlighted demand zone around $104.80–$106.50 continues to serve as the major structural support. As long as silver holds above this area, downside moves should be viewed as part of a broader consolidation process, not a trend reversal. Buyers have previously defended this zone with conviction, and it remains the line that separates healthy digestion from structural failure.
On the upside, sustained acceptance above $116.00–$117.00 would signal that the consolidation phase has completed, opening the door for another expansion leg toward the $122.00–$124.00 region, where price may again pause due to profit-taking and liquidity interaction. These levels should be treated as reaction zones, not guaranteed targets.
Invalidation is clear and objective. A decisive breakdown below the $104.80–$106.50 demand zone would disrupt the current bullish structure and shift focus toward a deeper corrective phase.
For now, silver is not breaking down. it is digesting gains.

EURUSD, BULLISHRetracement has ended already and uptrend started already, looking for opportunity to enter for long.

SILVER READY FOR CORRECTION | FALLING WEDGE & MACROLiquidity Rotation, Not Capitulation: Bitcoin Caught in a Macro Pause ▶️
Global capital is clearly rotating. Gold and the S&P 500 are printing record highs, while Bitcoin is struggling to regain momentum, but on-chain data suggests this is fatigue and rebalancing, not a full-scale exit 💸
Two signals define the current pressure:
📊 A deeply negative Coinbase Premium shows persistent U.S. selling, pointing to institutional deleveraging rather than retail panic
📊 Stablecoin supply contraction confirms that some capital has temporarily moved back to fiat, reducing near-term “dry powder” for impulsive rebounds
At the same time, leverage metrics show repeated futures open interest resets, meaning recent volatility is driven more by liquidations than aggressive spot selling. This aligns with historical mid-to-late cycle cooling phases, where momentum fades before structure breaks
Importantly, liquidity has not fully left crypto. Stablecoin ratios, exchange outflows, and DeFi activity suggest capital is waiting on clearer direction rather than funding the gold rally directly. This is diversification, not abandonment
Scenarios to watch:
📉 Bearish: Continued institutional selling could pressure BTC toward structural supports (~$81K, $70K, worst-case $58K)
🕯 Neutral/Base case: Sideways consolidation as the market absorbs supply and rebuilds liquidity
📈 Bullish: Stablecoin inflows resume, leverage stabilizes, and spot demand returns, reigniting trend continuation
Bitcoin isn’t breaking, it’s pausing. Direction will be decided by liquidity returning, not headlines ☄️

GBPJPY corrective pullback supported at 209.60The GBPJPY remains in a bullish trend, with recent price action showing signs of a corrective pullback within the broader uptrend.
Support Zone: 209.60– a key level from previous consolidation. Price is currently testing or approaching this level.
A bullish rebound from 209.60 would confirm ongoing upside momentum, with potential targets at:
212.65 – initial resistance
213.50 – psychological and structural level
214.10 – extended resistance on the longer-term chart
Bearish Scenario:
A confirmed break and daily close below 209.60 would weaken the bullish outlook and suggest deeper downside risk toward:
209.00 – minor support
208.50 – stronger support and potential demand zone
Outlook:
Bullish bias remains intact while the GBPJPY holds above 209.60. A sustained break below this level could shift momentum to the downside in the short term.
This communication is for informational purposes only and should not be viewed as any form of recommendation as to a particular course of action or as investment advice. It is not intended as an offer or solicitation for the purchase or sale of any financial instrument or as an official confirmation of any transaction. Opinions, estimates and assumptions expressed herein are made as of the date of this communication and are subject to change without notice. This communication has been prepared based upon information, including market prices, data and other information, believed to be reliable; however, Trade Nation does not warrant its completeness or accuracy. All market prices and market data contained in or attached to this communication are indicative and subject to change without notice.
