High probability strategies for the London SessionHey traders, let's break down the London session trading . In my opinion key session for the forex trading mainly for the EUR, GBP and CHF. I ll show you two high probability setups and its conditions to trade and when not to trade. Make notes and backtests so you got statistics and you can improve yourself over time. You will find out, that if you focus only on these 2 setups on 3 mentioned currencies. You will have 3-5 high probability opportunities per week.
Which is enough to make 6R gains in a week. Which is 3% on prop account with risk 0.5% per trade. And it's enough to make trading your main income.
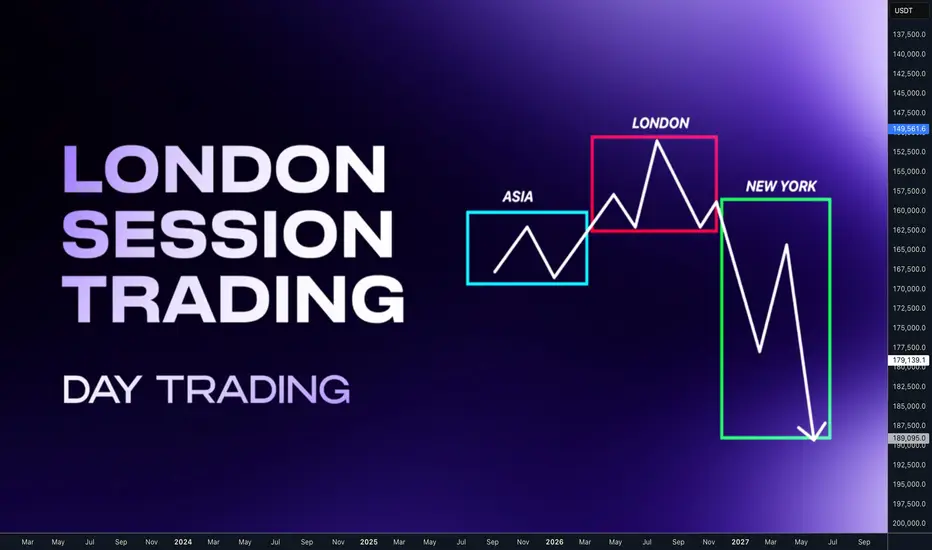
📌 Asian Session
Low volatility & accumulation phase — the market usually consolidates inside a tight range after the previous New York close. If the Asia session is trending, London will be continuation setup.
📌 London Session
The highest-probability setups often occur during this session.
If Asia was tight range, London usually manipulates the Asian range sweeping stops above or below then reverses and starts the true daily move. London will be Reversal setup. Often sets the daily high or low of the day
📌 New York Session
Brings in the highest volume and often continuation or reversal of the London move. Based what has happen in London and on relationship with key levels and market phases. We can build market narrative for our trades.
🧪 London Continuation Bearish setup
•Narrative: Asia did the manipulation → London does the continuation.
• Asia session already made a manipulation into a key level
• Price displaced away from that level
• CIOD / OB on M15 or H1 before London open
• H1: Asia runs above the stops above H1 high into a key level
• It gets rejected and followed by order block and displacement
• At London open, price retraces into M15 premium key level and continues in the same direction
❌Invalidation: the manipulation high/low from Asia session
🧪 London Continuation Bullish setup
• Narrative: Asia did the manipulation → London does the continuation.
• Asia session already made a manipulation into a key level
• Price displaced away from that level
• CIOD / OB on M15 or H1 before London open
• H1: Asia runs bellow the stops above H1 high into a key level
• It gets rejected and followed by order block and displacement
• At London open, price retraces into M15 discount key level and continues in the same direction
❌Invalidation: the manipulation high/low from Asia session
🧪 London Reversal Bearish setup
• Narrative: London performs the manipulation → price reverses.
• Asia session consolidates near a higher timeframe key level
• London open initiates the manipulation into the key level
• Price reject at the key level and created M15 order block • H1: Asia consolidates Bellow Key Level
• London opens, price runs Asia high into that Key Level
• M15 breaks down → Change in order flow → clean short setup
• Target: higher timeframe draw on liquidity (e.g., previous day low)
❌Invalidation: the London session high (manipulation point)
🧪 London Reversal Bullish setup
• Narrative: London performs the manipulation → price reverses.
• Asia session consolidates near a higher timeframe key level
• London open initiates the manipulation into the key level
• Price reject at the key level and created M15 order block • H1: Asia consolidates above the Key Level
• London opens, price runs Asia high into that Key Level
• M15 breaks up → Change in order flow → clean short setup
• Target: higher timeframe draw on liquidity (e.g., previous day low)
❌Invalidation: the London session low (manipulation point)
🧩 to trade this method successfully you need to understand Order Blocks
🔗 Click the picture below to learn more 👇https://www.tradingview.com/chart/BTCUSD/LJ69Z8r4-Order-Block-Powerful-Key-level-and-Entry-confirmation/ 🕐 Timing is important
1️⃣Continuation setup can occur in first part of the London session. during the start of the settlement 2️⃣ Reversal setup needs a bit more time. I suggest don't enter before the 10 CET
wait for clear change in order flow after the manipulation 🧩 Day Trading doesn't mean trading every day. For highest probability setups trade only within the higher timeframes H4/D1/W1 trends.
📌 Down Trend - Trade Stop hunts above the highs
Trade London continuation or Reversal if the H4 Downtrend has run above the highs (stop hunt) It will give you chance to catch big expansion moves 📌 Up Trend - Trade Stop Hunt below the lows
Trade London continuation or Reversal if the H4 Downtrend has run below the lows (stop hunt) It will give you chance to catch big expansion moves. 🧩 In other words you want be buying loses and Selling highs.
🔗 Click the picture below to learn more 👇 I have explained how to do it in this post bellow Trend is your friend so H4 is minimum trend requirement for the London session traders. But if you want to take it to next level and enter on the sniper entries during the London session, you should also know daily and weekly trends within the monthly range. This opens a whole new world where you can catch London session model with HTF range move and it can be +10RR trades if you patient enough.
📈 Bullish LTF Ranges within HTF Range
Analyze HTF range (monthly) and define daily ranges, and wait for the London setups on the lows of the previous days within HTF trend. Always follow the same process in the London session on LTF. Asia either make manipulation - go with continuation setup or Asia consolidates and wait for the manipulation during the London session - go with London Reversal setup. 📉 Bearish LTF Ranges within HTF Range
Analyze HTF range (monthly) and define daily ranges, and wait for the London setups on the highs of the previous days within HTF trend. Always follow the same process in the London session on LTF. Asia either make manipulation - go with continuation setup or Asia consolidates and wait for the manipulation during the London session - go with London Reversal setup. ‼️ In trading, you make most money by making precisely best decisions and controlling your risk. Hence understanding the different probabilistic scenarios we can start focusing on quality over quantity by avoiding lower probability conditions. The aim is to improve our decision making process by knowing when it's better to trade and when not.
❌ Low Probability London Session Conditions
• After a series of 3 consecutive bullish daily candles - Avoid Longs.
• After a series of 3 consecutive bearish daily candles - Avoid Shorts.
• After FOMC event that produces an extreme range.
• Ahead of NFP and CPI data release
• Multiple high and medium impact news events.
• The Asian Range is has been trending and is larger than 40 pips.
• If the Asian Range is not visually consolidating.
• Absence of a candle range
✅ High Probability London Session Conditions
• The market has recently reacted off of Daily /H4 key level
• The Asian Range is visually a consolidating and smaller than 40 pips.
• Presence of a clean visual candle range
• Presence of a higher timeframe key level.
• Clean higher timeframe draw on liquidity.
✅ High Probability Intraday Setups
The highest importance is placed on the H TF Daily or 4h direction:
• Clean orderflow.
• Clean higher timeframe draw on liquidity and directional bias.
• Strong price based narrative.
• Strong time based narrative.
• 4h candle range
• 4h Key level.
• Key time
Adopt this simple concept and master it. You will not need to pay any signals group and other nonsense anymore. Just sacrifice 6 months to one strategy in one time window and find repetitiveness. Build confidence based on statistical data. Become independent.
✨ Trading Mastery is reflection of your life
Have a longterm plan, No Alcohol & Drugs, Ignore others, Focus on your journey , Backtest regularly, Review your weeks, Journal mistakes, Exercise, Sleep well, Read books, Walks in nature (no phone) , Meditate, Reduce social media time, Spend time with family, Live Life.
Trading is hard, but not impossible. I believe in you 💪
David Perk aka Dave Fx Hunter
Community ideas
EURUSDHello Traders! 👋
What are your thoughts on EURUSD?
In the EUR/USD chart, we can see that price failed to close above the marked resistance zone and was rejected from that area.
Additionally, the pair has broken its ascending trendline and closed below it, signaling a potential shift in short-term momentum.
We expect a pullback toward the broken trendline or resistance zone, followed by a downward continuation toward the next support level.
If a weekly candle closes above the resistance zone, this bearish scenario will be invalidated.
Don’t forget to like and share your thoughts in the comments! ❤️

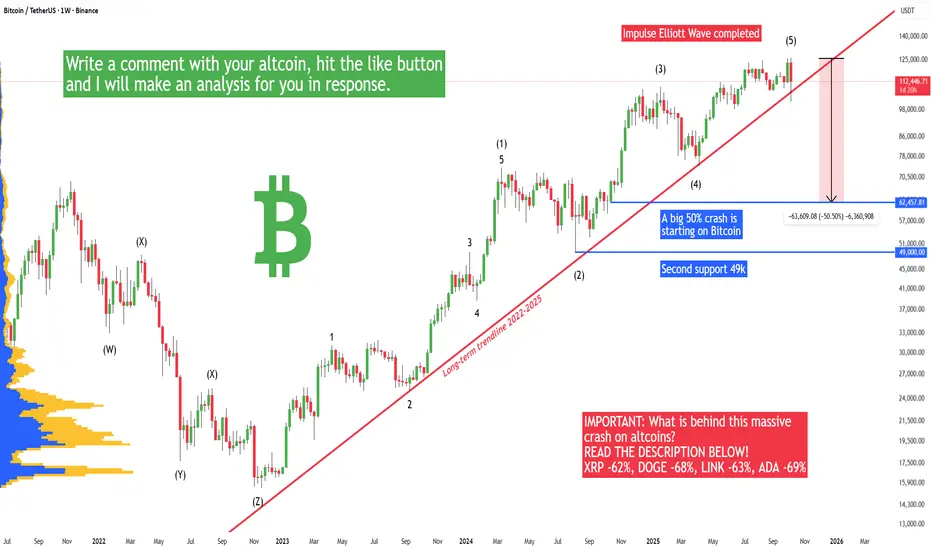
BITCOIN AND CRYPTO RUG PULL, HERE IS THE REAL REASON WHY!In the 1-hour time period, all altcoins and Bitcoin crashed on Friday afternoon/night! The real reason behind this crash is in this article. The vast majority of traders on the futures market got liquidated with a very low leverage of 2x or more.
If you still believe in Democrats and their controlled opposition Republicans, this article may open your eyes. So what happened? You probably already know that the crypto market is completely controlled and manipulated by whales (banks and huge institutions). Not only the price but also the development. If you still believe that Bitcoin is here to bring freedom or that Bitcoin is developed by some geeks and that the banks have no control over Bitcoin, please wake up! It's completely the opposite. Bitcoin is a bank's biggest love, and if you love Bitcoin, you also love the Fed and their money printer and inflation.
XRP -62%, DOGE -68%, LINK -63%, ADA -69%
Alien in disguise Elon Musk and his favorite DOGE coin dropped by 68% and almost hit a new long-term low since 2022. We have never seen such a crash in the history of this coin, and what is the reason behind this rug pull? Why are all Doge investors and traders disappointed by the performance of this coin? After almost 5 years, the coin was trading today at 0.08 USDT, which is minus 90% from the all-time high peak in 2021! Currently, this coin is trading 75% below the all-time high peak! So what is happening, and why did Elon Musk fail in the eyes of his fans? Pretty much everyone who watched the live rug pull was in disbelief, because their portfolio and all their money were pretty much wiped out. Elon Musk and his reptilian friend Donald Trump are not here to save you, nor to help you. The reason behind this crash is simple—to take away your money while you are cheering at what they do. Twitter used to be a good platform, but after Elon Musk's touch, it turned black, and X is not even a name; it's a letter.
What about ADA? Trump (Biden's good friend, btw) a few months ago made a post on the scam social network TruthSocial (btw, they only took the Twitter source code and renamed it to TruthSocial; that's why it's the same) about strategic crypto reserves, including the ADA coin. This is supposed to be bullish, but ADA today just almost hit a new all-time low and wiped all gains made in 2022, 2023, 2024, and 2025. Almost every ADA investor is deeply unsatisfied with the performance of this coin.
It's so obvious that the banks started selling and crashed the whole crypto market, forcing all futures traders to quit their long positions. The crypto market is a bank's paradise when it comes to making money; in other words, it's a casino and pump and dump scheme. There is no secret that 99% of crypto investors are at a loss or have experienced a huge loss already. This crypto technology was brought to planet Earth by reptilians and mantoids, so if you think that some human invented this technology, you have been scammed. And this technology is not here to bring freedom, actually it's the opposite. All transactions are monitored on the public blockchain. Every year you see more crypto restrictions; it basically turned into a total control money system, 100x worse than cash or fiat. And that's not all; soon everyone will mine Bitcoin with their physical body instead of computers (see patent WO2020060606A1 - Cryptocurrency system using body activity data). Your mind connected to the hive AI network will not be the best experience on this isolated planet Earth from the rest of the galaxy. It's good that we have democracy, and the most important thing about democracy is freedom of speech.
Many, many coins went to ZERO (0.00 USDT) on the spot market, such as IOTX. That's when there were absolutely no buyers (only sellers), and people that sold lost all their money. Please do not look at news or search for what happened to the crypto market. It's more than obvious that the banks wanted to liquidate as many people as possible. And they will do it again and again in the future, so be prepared if you want to stay in this crypto casino game.
Write a comment with your altcoin, hit the like button, and I will make an analysis for you in response.
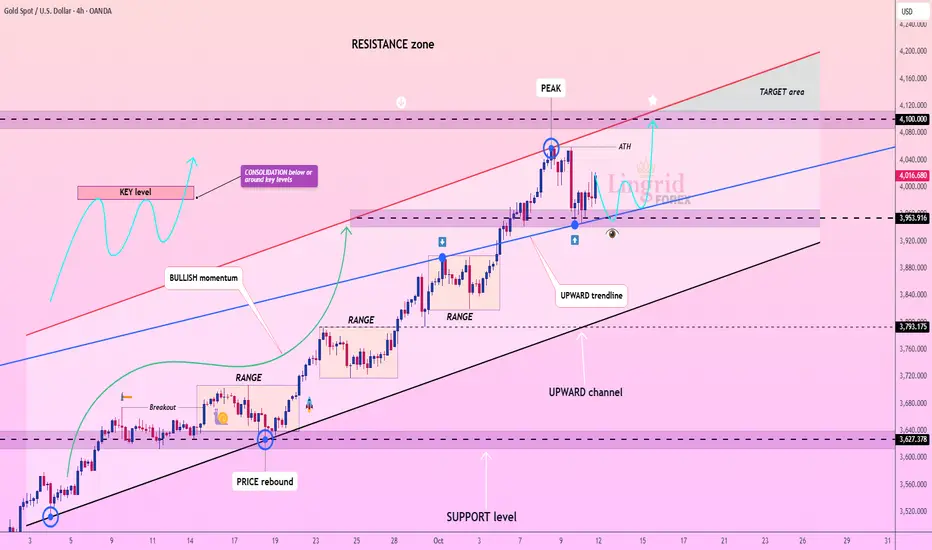
Lingrid | GOLD Weekly Outlook: Dip-Buying Dominance ContinuesThe price perfectly fulfilled my previous weekly idea . OANDA:XAUUSD market delivered another impressive performance this week, decisively pushing through the psychologically significant $4,000 threshold. While this round number naturally attracts considerable market attention, seasoned traders recognize it as simply another milestone in gold's broader trajectory rather than a definitive ceiling.
What's particularly noteworthy is the dramatic increase in market volatility. Recent weeks have demonstrated a pattern where pullbacks averaging around 2% are consistently followed by rallies exceeding 4.5%. This asymmetric price action—where advances substantially outpace corrections—reveals strong underlying bullish momentum and aggressive buying on dips. The market may easily absorb a 2.8% pullback before staging another robust recovery, reinforcing this established rhythm.
Price action shows gold trading within a well-defined upward channel, with price respecting both the lower trendline support near $3,950 and approaching the upper resistance zone around $4,100. The all-time high formation near $4,060 marked a crucial peak, and current consolidation below this level suggests the market is building energy for the next directional move.
Key support remains anchored around $3,950, while the upward channel structure indicates potential targets extending into the $4,100-$4,200 range. The combination of persistent bullish momentum, widening volatility swings, and successful defense of higher lows points to a market that's far from exhausted. We should watch for either a breakout above $4,060 toward the target area or a retest of channel support before the next advance materializes.
If this idea resonates with you or you have your own opinion, traders, hit the comments. I’m excited to read your thoughts!
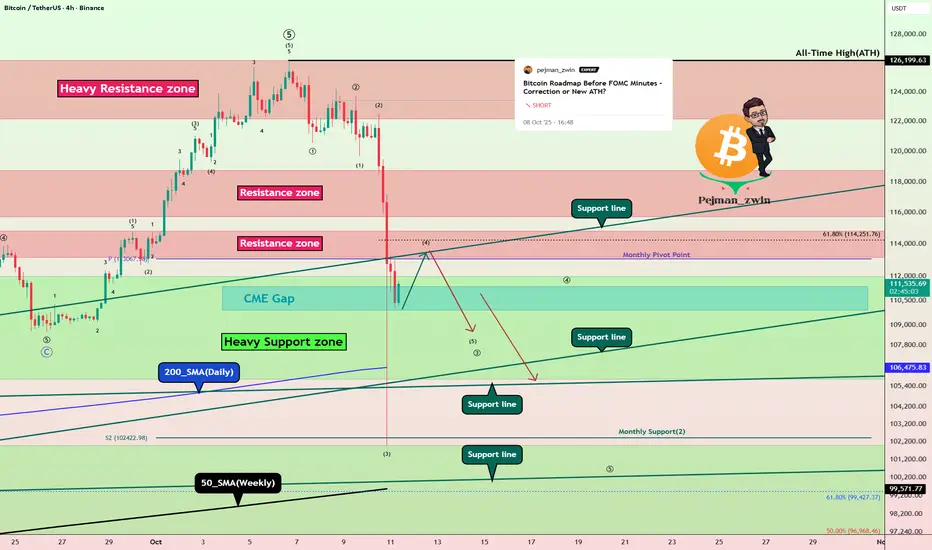
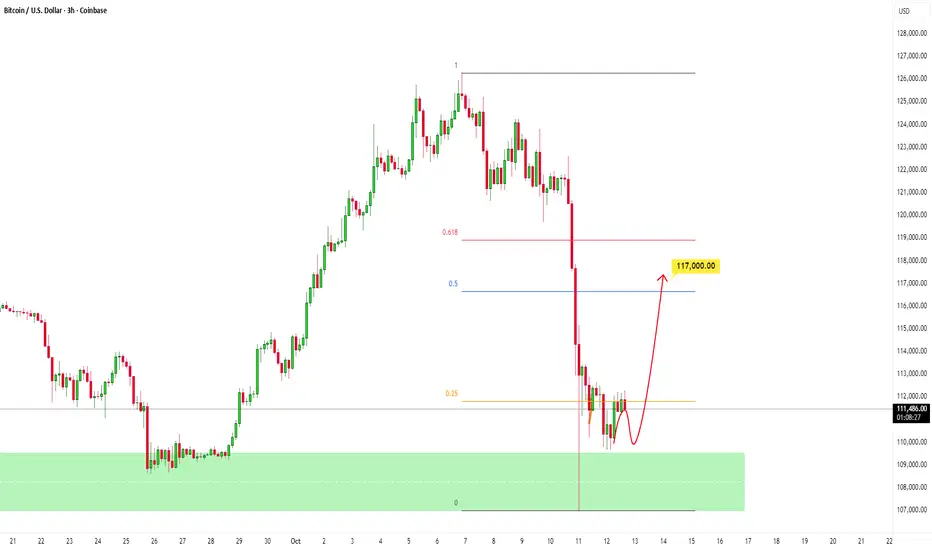
Bitcoin Roadmap: Is a Major Correction the Next Stop?As I expected from the previous analysis , Bitcoin did start to drop and hit its targets .
Now, with the news that the U.S. might impose a 100% tariff on China , we saw Bitcoin sharply sell off last night. Actually, as I mentioned in my previous ideas , the rally from about $109,000 to around $126,199(ATH ) (which was a new all-time high for Bitcoin) had relatively low volume. That was a sign that a correction might be on the way, and last night’s news just acted as a trigger to speed it up.
In fact, what took Bitcoin 10 days to climb was reversed in about 4 days , showing how strong the sellers are right now.
Educational tip: You can use volume candles on TradingView to see which candles had higher volume—the thicker the candle, the more significant the move.
Now, the big question: will Bitcoin keep dropping or bounce back?
Right now, it’s sitting near a cluster of Support lines and close to the daily 200_SMA(Daily) and the 50_SMA(Weekly) , as well as a Heavy Support zone($111,980-$105,820) . Last night’s drop was basically the first test of these supports .
Since it’s the weekend and volumes are usually lower, we don’t expect a huge downward move in the next 48 hours.
Bitcoin might do a pullback to the broken Resistance zone($114,820-$113,180) and then continue its drop.
According to Elliott Wave analysis , Bitcoin seems to be completing a microwave 4 of the main wave 3 .
I expect that after Bitcoin completes , we might see it continue downward and fill the CME Gap($111,355-$109,915) early in the next week.
So, do you think the major correction for Bitcoin has started or not? Let me know what you think!
Note: In case the Support lines break, there’s also a chance that we might see a Death Cross (where the 50-day moving average crosses below the 200-day moving average), which could signal further bearish momentum.
Note: Around the $108,000 level, we have huge buy orders stacked up, which might act as a significant support zone.
Please respect each other's ideas and express them politely if you agree or disagree.
Bitcoin Analysis (BTCUSDT), 4-hour time frame.
Be sure to follow the updated ideas.
Do not forget to put a Stop loss for your positions (For every position you want to open).
Please follow your strategy and updates; this is just my Idea, and I will gladly see your ideas in this post.
Please do not forget the ✅' like '✅ button 🙏😊 & Share it with your friends; thanks, and Trade safe.
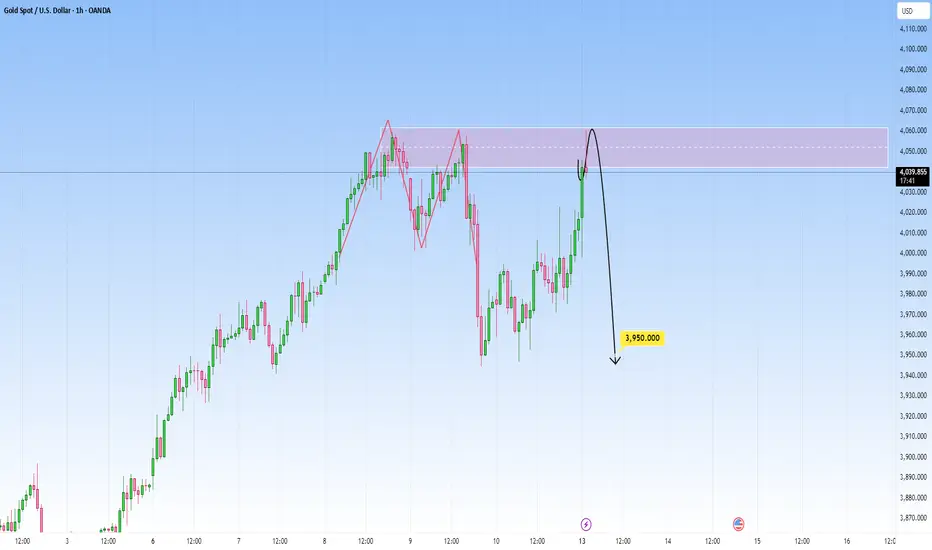
Gold’s Reaction Here Could Set the Next Big Move!Price rallied to the upside, retracing the previous drop and reaching the area where sellers had previously taken control.
If price rejects this zone with strong bearish candles, it would confirm seller presence and could mark the start of a new leg down, targeting the previous lows around 3,950.000.
However, if buyers manage to break above this level with momentum, it could invalidate the bearish setup.
Gold’s Playbook Repeating in Silver?HI GUYS!
History doesn’t repeat, but in the markets, it often rhymes, and silver’s chart looks eerily familiar.
Gold’s long-term cup-and-handle pattern between 2013–2023 led to a massive breakout above $4,000. Now, silver appears to be tracing the same formation, just a few years behind.
Silver’s cup (2011–2024) has completed, and its handle (a descending channel) is forming right where gold’s did before it launched.
The measured target? Around $200+ USD, a level that would mark a historic revaluation of the metal.
With industrial demand rising and monetary uncertainty persisting, silver could soon follow gold’s lead, turning this technical Deja vu into a full-blown breakout.
History’s playbook is open. Silver might be next.

Bitcoin’s Bloodbath Was a Setup Smart Money Knows ItBitcoin remains structurally bullish despite the recent market turmoil. The monthly chart clearly shows that the main ascending trendline continues to hold firm acting as the backbone of the current bull cycle.
The recent drop was nothing more than a controlled retest of this key support zone. As long as Bitcoin stays above $103,000 and the trendline remains intact, the bull market stands strong.
Next upside projections:
First target: $126K – $165K
Extension target: $200K+
Only a confirmed monthly close below $103K would invalidate the bullish structure. Until then, this phase remains a buyers’ market, not a sellers’.
Share your thoughts below do you believe this trendline can carry BTC to new highs?
Like & share if you agree.

THE KOG REPORTTHE KOG REPORT:
In last week’s KOG Report we had a bias level and bullish above 3740 and a red box break we wanted to see above the 3765 level. We managed to swoop the low, not into 3740 but not far off, then break above and managed to complete all of the red box targets on that day.
During the week, we then released our updates confirming the move and managed to track it all the way, near enough to the top, where we suggested caution on longs and expected the move down, which worked very well.
All in all, another successful week in Camelot, not only on Gold but across the other pairs we trade and analyse as well.
So, what can we expect in the week ahead?
We had a 60% recovery on Friday which Is a good sign for bulls, however, there is a bias level here and that’s the 4003-6 region. We’ll use that as the guide for a break above or below for the opening, and say that if it holds, we should be looking for a completion of the move into the 4030-3 levels and above that 4060. If we do reach 4050, we will have flipped and any RIPs will be temporary from what we can see with potential for price to attempt the 4100 level and potentially a little above, which is where we feel there may be an opportunity to short again.
Now, if we can break below the 4003 level, bulls will need to play caution as the first main key level below starts at 3955 which is where we may get a temporary bounce, but based on the flip below 3995 will become the new resistance level.
We’re expecting potential gaps on market open so we’ll leave this report as subject to change for now and as always, we’ll update traders with our red box strategy levels and what to look for.
KOG’s bias of the week:
Bullish above 4003
Bearish below 4003
RED BOX TARGETS:
Break above 4630 for 4645, 4660, 4663 and 4672 in extension of the move
Break below 4620 for 4610, 4603. 3998, 3990, 3985 and 3960 in extension of the move
Please do support us by hitting the like button, leaving a comment, and giving us a follow. We’ve been doing this for a long time now providing traders with in-depth free analysis on Gold, so your likes and comments are very much appreciated.
As always, trade safe.
KOG

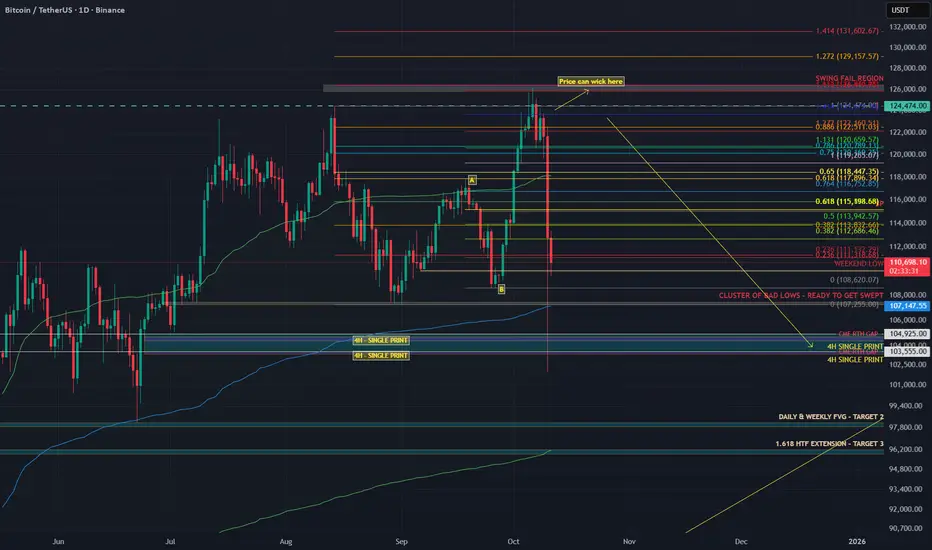
Bitcoin - What to expect from this week?Introduction
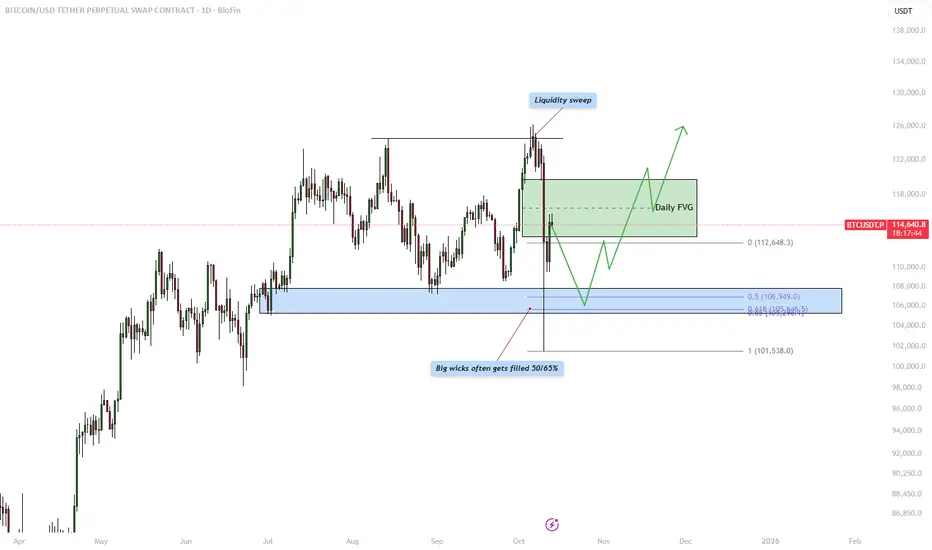
This analysis examines the recent price behavior of Bitcoin against USDT on the daily timeframe. The chart highlights several key technical concepts, including a liquidity sweep at the highs, a daily Fair Value Gap (FVG) acting as resistance, and the likelihood of a wick fill within a major imbalance zone. Together, these elements provide valuable insight into how institutional traders may be engineering liquidity and preparing for the next significant move. Understanding these areas can help traders anticipate high-probability reaction zones and better align with the market’s underlying structure.
Liquidity sweep
The market recently executed a liquidity sweep above previous swing highs, triggering buy stops and attracting breakout traders into the move. This sudden push to the upside was quickly rejected, signaling that smart money likely used this moment to gather liquidity and distribute positions. Liquidity sweeps often serve as the market’s way of collecting orders before a reversal or retracement, indicating that the bullish momentum may be temporarily exhausted. This event sets the stage for price to rebalance inefficiencies left behind during the rapid move.
Daily FVG resistance
Following the liquidity sweep, price left behind a clear daily Fair Value Gap, which represents an area of imbalance caused by strong displacement. This gap often acts as resistance, where price is expected to return and mitigate before potentially continuing lower. The FVG provides an ideal area for institutional traders to reposition, as it offers a point of confluence between inefficiency and structure. If price reacts bearishly within this zone, it would strengthen the bearish outlook and suggest a continuation toward lower levels.
Wick fill
The large wick seen during the recent sell-off is an important feature of this chart. Historically, big wicks tend to get filled by 50% to 65%, reflecting the market’s tendency to rebalance inefficiencies over time. The marked blue zone below shows where this fill is most likely to occur. This zone aligns closely with previous support levels and Fibonacci retracement levels, further reinforcing it as a potential area of interest. A wick fill into this region could provide liquidity for future bullish movement, allowing the market to establish a more solid foundation for the next impulsive leg upward.
Conclusion
In summary, the current daily structure of Bitcoin suggests that price has completed a liquidity sweep at the highs and is now in the process of rebalancing inefficiencies through a possible retracement. The daily Fair Value Gap above serves as a critical resistance zone where sellers may re-enter, while the wick fill area below marks a high-probability target for price to revisit before establishing new direction. Traders should monitor how price reacts to these two regions, a rejection from the FVG coupled with a move toward the wick fill zone could signal the next significant swing opportunity. In this environment, patience and precision are key, as the market seeks equilibrium before its next major directional move.
-------------------------
Thanks for your support. If you enjoyed this analysis, make sure to follow me so you don't miss the next one. And if you found it helpful, feel free to drop a like 👍 and leave a comment 💬, I’d love to hear your thoughts!
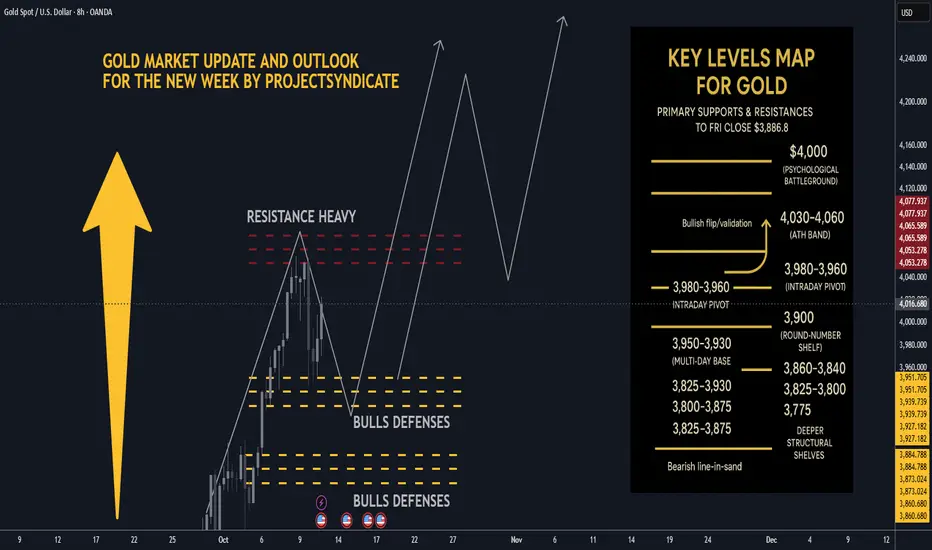
Gold next week: Key S/R Levels and Outlook for Traders🏆 Friday’s Close & Recent ATH:
Gold XAUUSD closed Friday around ~$3,990–$4,020/oz depending on venue most consolidated feeds show prints near $3.99–$4.02k at Friday close. The nearest recent intraday highs printed in the $4,030–$4,060 area across data providers this week, putting $4,000 as the immediate psychological battleground and $4,050–$4,060 as the latest short-term ATH band. YTD performance remains extraordinary 2025 YTD still showing a very large gain.
📈 Trend Structure:
Price continues to track a well-defined ascending channel on 1H/4H with clear impulsive legs out of recent consolidations. Market character = higher highs / higher lows, persistent dip-buying, and strong trend adherence into quarter-turn 25/50 handles near round thousands. Momentum has been resilient into week-end despite tariff headlines, suggesting structural demand and participation from official buyers.
🔑 Key Resistance Levels:
The most critical resistances to watch updated from Friday close ≈ $4,000:
• 4000 — immediate psychological round-number battleground.
• 4,030–4,060 — recent intraday ATH band / short-term supply recent highs printed here across venues.
• 4,075 → 4,100 — measured move / extension band if acceptance above the ATH zone occurs.
• 4,150–4,200 — stretch momentum targets on sustained risk-off and break/acceptance above 4,100 structural extension.
Quick note: different data vendors quote small differences in ticks — I used consolidated high prints to identify the ATH band.
🛡️ Support Zones:
Immediate supports step down as follows
• 3,980–3,960 intraday pivot just under Friday close.
• 3,950–3,930 multi-day base / near-week lows.
• 3,900–3,888 round-number shelf and the prior week’s consolidation band.
• Deeper structural shelves: 3,860–3,840, 3,825, 3,800 → 3,775.
A sustained break below ~3,900–3,888 would signal increasing corrective risk; daily close under ~3,825 would more clearly shift the regime.
⚖️ Likely Scenarios:
• Scenario 1 Base Case – Controlled dip toward 3,950–3,930 or the 3,900 area to reload bids, then rotation higher toward 4,030–4,060 as buyers re-engage.
• Scenario 2 Momentum Break – Quick clearance of the 4,030–4,060 ATH band → sustained acceptance above 4,075–4,100, unleashing momentum into 4,150–4,200. Overbought readings exist intraday, but structural demand has kept pullbacks shallow.
📊 Short-Term Targets:
On continuation: 4,020 → 4,030–4,060 → 4,075 → 4,100, with 4,150–4,200 as higher extensions if acceptance holds.
On retrace: 3,980 → 3,950 → 3,930 → 3,900 as the key retrace ladder.
💡 Market Sentiment Drivers updated:
• Tariff shock / geopolitical risk: President Trump announced proposals for large new tariffs reports of a 100% tariff threat and expanded export controls on Chinese imports this week, escalating trade-war risk and knocking risk sentiment — that increases safe-haven demand for gold. News outlets Reuters, AP, WaPo and market reactions were visible Friday.
• Rate & policy expectations: Markets continue to price material odds of rate easing/softer Fed path relative to earlier in the year; that reduces real yields and supports gold. Feeds and FedWatch implied pricing show elevated cut odds that underpin lower opportunity cost for gold.
• Official demand: Central bank buying has remained constructive — WGC/official stats show continued net purchases in recent months monthly buying rebounded in August. This adds structural support to dips.
• Macro/flow: Risk-off from tariff headlines, rare-earth export controls, and supply-chain concerns are the immediate drivers that could catalyze pushes toward the ATH band.
🔄 Retracement Outlook:
A tag of 3,950–3,930 or a short stop-run into 3,900–3,888 would be a typical healthy pullback inside the trend. Fast reclaim of the first support band after a liquidity flush often precedes fresh ATH tests. Breaks under 3,900 that fail to reclaim quickly increase the probability of a deeper slide into the 3,860–3,825 shelf.
🧭 Risk Levels to Watch:
• Bullish structure intact: holding above ~3,950–3,930 or more conservatively, above 3,900 keeps the bull case intact.
• Bearish line-in-sand: daily close < 3,825 weakens trend; daily close < 3,775–3,750 signals a bigger corrective phase and opens lower targets.
🚀 Overall Weekly Outlook:
Gold remains in a strong uptrend with $4,020–$4,030/ATH band $4,030–$4,060 → $4,000 as the immediate battleground after Friday’s close. Expect buyable dips while supports hold; the topside roadmap favors 4,075–4,100 and 4,150–4,200 as measured extensions if the market digests tariff news into a longer-running risk-off regime.
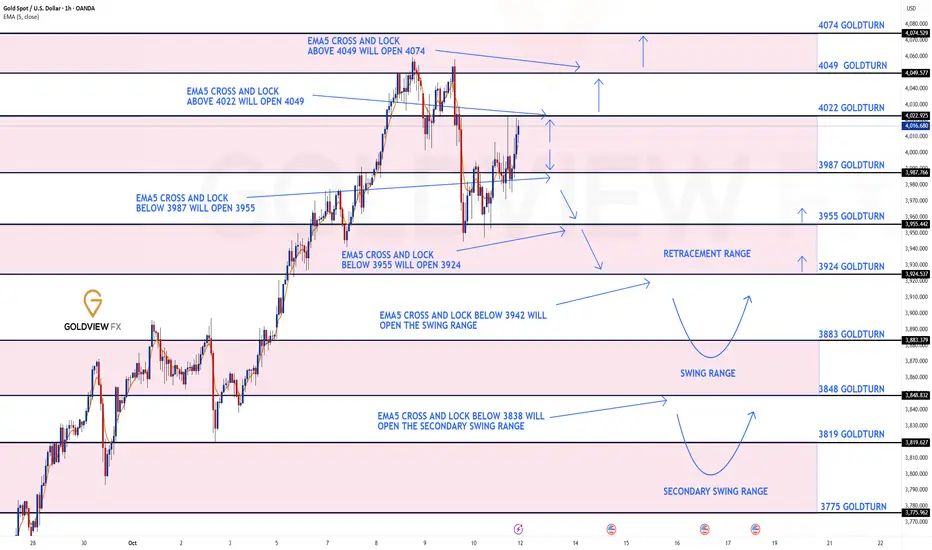
GOLD 1H CHART ROUTE MAP UPDATE & TRADING PLAN FOR THE WEEKHey Everyone,
Please see our updated 1h chart levels and targets for the coming week.
We are seeing price play between two weighted levels with a gap above at 4022 and a gap below at 3987. We will need to see ema5 cross and lock on either weighted level to determine the next range.
We will see levels tested side by side until one of the weighted levels break and lock to confirm direction for the next range.
We will keep the above in mind when taking buys from dips. Our updated levels and weighted levels will allow us to track the movement down and then catch bounces up.
We will continue to buy dips using our support levels taking 20 to 40 pips. As stated before each of our level structures give 20 to 40 pip bounces, which is enough for a nice entry and exit. If you back test the levels we shared every week for the past 24 months, you can see how effectively they were used to trade with or against short/mid term swings and trends.
The swing range give bigger bounces then our weighted levels that's the difference between weighted levels and swing ranges.
BULLISH TARGET
4022
EMA5 CROSS AND LOCK ABOVE 4022 WILL OPEN THE FOLLOWING BULLISH TARGETS
4049
EMA5 CROSS AND LOCK ABOVE 4049 WILL OPEN THE FOLLOWING BULLISH TARGET
4074
BEARISH TARGETS
3987
EMA5 CROSS AND LOCK BELOW 3987 WILL OPEN THE FOLLOWING BEARISH TARGET
3955
EMA5 CROSS AND LOCK BELOW 3955 WILL OPEN THE FOLLOWING BEARISH TARGET
3924
EMA5 CROSS AND LOCK BELOW 3924 WILL OPEN THE SWING RANGE
3883
3848
EMA5 CROSS AND LOCK BELOW 3848 WILL OPEN THE SECONDAARY SWING RANGE
3819
3775
As always, we will keep you all updated with regular updates throughout the week and how we manage the active ideas and setups. Thank you all for your likes, comments and follows, we really appreciate it!
Mr Gold
GoldViewFX
Bitcoin: Play Range Until Something Changes.Bitcoin is still within the Wave 4 consolidation even though some charts show a brief test of the 102K level. While many supports broke, it was BRIEF. This tariff surprise is the kind of thing I warn about every week on my streams: they come out of no where and a chart WILL NOT warn you about something like this. I have been warning about buying into the 125K area and new highs precisely because of this type of vulnerability. From here the key drivers are going to be either we get a negotiation outcome and the tariffs are delayed again OR we get an implementation of the tariffs. On top of that, unless I am missing something we don't have the results of NFP, and other government reports which also hold potential positive or negative surprises. Plus how is Powell going to process this info for the FOMC meeting this month?
Massive movements like this often signal a structural change. IF this tariff and trade situation gets worse, it could be the fundamental driver that implies that Wave 5 has completed which could mean we are in the beginning of a broad corrective wave. Keep in mind technicals alone are NOT sufficient for this type of analysis in this situation. Everything depends on the outcome of this China Trade situation. The type of sentiment that we are seeing is typical of this time of year and has often marked the bottom of the "Santa Rally" which is has a tendency to follow in the coming months.
As of now, the support and resistance levels are the same. The 108K AREA support for bullish reversals and the 118K AREA resistance for bearish, both specifically on this time frame. IF 118K establishes a lower high, this would be the technical area for a short that can test the 108Ks again and potentially break. This would COINCIDE with a negative tariff outcome.
In my opinion, the situation is more likely to be smoothed over. It is hard to believe these new tariffs will be implemented and I would be watching for positive announcements this week. I have little evidence to base this on besides on the behavior we have seen since April. The 113K area which seems to be the mid point of this range is probably the MOST random price location to be taking any swing trade positions. The best way to play this right now while waiting for clarity is to work on smaller time frames, I repeat this every week. Otherwise, there is not much else to do except maintain an open mind and WAIT for a clear signal.
Thank you for considering my analysis and perspective,

New Ath of Gold 4115Gold (XAU/USD) is showing strong bullish momentum on the 1-hour chart, breaking above resistance near 4060. Price is targeting a new all-time high around 4115 as buyers continue to dominate the market.

BITCOIN Market Resilience Amid the BloodbathDespite yesterday’s broad market massacre, Bitcoin continues to demonstrate exceptional structural strength. The sell-off wasn’t random, it was a precisely engineered liquidity flush designed to test the integrity of the primary ascending trendline that has defined this bullish cycle.
That deep retest tapped directly into the historic accumulation zone, the same area from which every significant rally in this macro uptrend has emerged. This region now acts as the ultimate bullish defense line, where smart money typically re-positions before the next expansion phase.
As long as Bitcoin maintains a daily close above $102,000, the bullish projection remains fully valid. The next key target sits around $126,000, followed by the extended leg projection towards $168,000, which remains technically achievable within this cycle.
Every revisit to the base structure should be viewed as a strategic buying opportunity, not a signal of weakness, but a reaffirmation of strength within a controlled market reset.
Do you agree with this outlook or not?
Share your thoughts below, hit the like, and share this analysis if it aligns with your perspective.

EURUSD: Downtrend will Continue in ChannelHello everyone, here is my breakdown of the current Euro setup.
Market Analysis
The price action has been clearly bearish, with the market being guided lower by a well-defined Downward Channel. This structure has been in place for some time, creating a series of lower highs and lower lows after a failed breakout above the 1.1775 Resistance.
Currently, the price is in a corrective rally after a 'fake breakout' below the major 1.1575 Support. This bounce from the lows is now carrying the price back up towards the upper boundary of the Downward Channel, which is a key area to watch for seller activity.
My Scenario & Strategy
My scenario is based on the expectation that the dominant downtrend will continue. I'm looking for this corrective rally to complete as it reaches the descending resistance line of the channel. The key signal would be a clear and strong rejection from this dynamic resistance, indicating that sellers are stepping back in to defend the trend.
Therefore, the strategy is to watch for this rejection. A confirmed failure to break higher would validate the short scenario. The primary target for the subsequent decline is 1.1550, which is located within the major Support zone.
That's the setup I'm tracking. Thank you for your attention, and always manage your risk.

GOLD 4H CHART ROUTE MAP UPDATE & TRADING PLAN FOR THE WEEKHey Everyone,
Please see our updated 4h chart levels and targets for the coming week.
We are seeing price play between two weighted levels with a gap above at 4041 and a gap below at 3978. We will need to see ema5 cross and lock on either weighted level to determine the next range.
We will see levels tested side by side until one of the weighted levels break and lock to confirm direction for the next range.
We will keep the above in mind when taking buys from dips. Our updated levels and weighted levels will allow us to track the movement down and then catch bounces up.
We will continue to buy dips using our support levels taking 20 to 40 pips. As stated before each of our level structures give 20 to 40 pip bounces, which is enough for a nice entry and exit. If you back test the levels we shared every week for the past 24 months, you can see how effectively they were used to trade with or against short/mid term swings and trends.
The swing range give bigger bounces then our weighted levels that's the difference between weighted levels and swing ranges.
BULLISH TARGET
4041
EMA5 CROSS AND LOCK ABOVE 4041 WILL OPEN THE FOLLOWING BULLISH TARGETS
4099
EMA5 CROSS AND LOCK ABOVE 4099 WILL OPEN THE FOLLOWING BULLISH TARGET
4154
EMA5 CROSS AND LOCK ABOVE 4154 WILL OPEN THE FOLLOWING BULLISH TARGET
4212
BEARISH TARGETS
3978
EMA5 CROSS AND LOCK BELOW 3978 WILL OPEN THE FOLLOWING BEARISH TARGET
3916
EMA5 CROSS AND LOCK BELOW 3916 WILL OPEN THE SWING RANGE
3840
3767
EMA5 CROSS AND LOCK BELOW 3767 WILL OPEN THE SECONDARY SWING RANGE
3689
3632
As always, we will keep you all updated with regular updates throughout the week and how we manage the active ideas and setups. Thank you all for your likes, comments and follows, we really appreciate it!
Mr Gold
GoldViewFX

BTC to Retrace to Key Fibonacci level after Heavy SelloffPrice experienced a sharp and aggressive selloff and now, after a strong rejection from key level, the market is consolidating, showing early signs of stabilization as sellers begin to lose momentum.
If buyers can defend this area and push price higher, the next logical target lies around the Fibonacci 0.5–0.618 retracement zone, aligning with the 117,000 - 119,000 level, a key area where sellers may step back in.
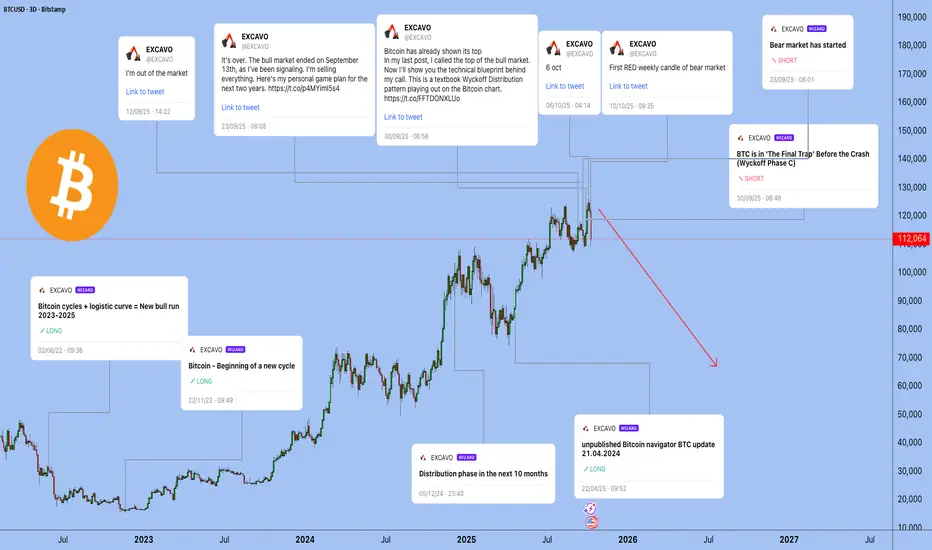
Today's Crypto Slaughter 11.10.2025I want you to look closely at this chart. These aren't just lines and candles. This is a timeline of warnings. September 12th, 23th, 30th, October 6th, October 10th—I was screaming that the top was in. I told you I was getting out of the market.
For this, I received more hate than I have in my entire career. 90% of the comments disagreed with me. But I knew what I was signing up for. I wanted to warn you. And I am grateful to those who listened.
And today, we saw the price the market pays for euphoria.
This Isn't a Meme. This is a Tragedy
Today was not just a "liquidity grab." It was the robbery of 1.6 million traders for $10 billion.
And these are not just numbers. Today, a trader I knew from competitions, Kostya Kudo, took his own life. This is no longer a joke. This is not a meme. People are dying. The best are leaving. We cannot watch this like it's some internet meme while real lives are being destroyed.
How Did This Happen? The Anatomy of a Perfect Storm
Of course, someone dumped a large volume. But why was the fall so deep and so fast?
Cascading Liquidations: The first wave of selling triggered a chain reaction.
A Vacuum in the Order Book: I've known this since 2019. During crashes like this, market makers simply switch off their algorithms to avoid losing money. They pull their liquidity. The order book becomes empty. Any sell order moves the price down by hundreds, thousands of dollars. This isn't a market. It's a vacuum.
The Exchanges Are the Winners: Where are those $10 billion now? With the centralized exchanges. And no one will be compensated. You'll just be told, "Manage your risk next time."
Why This Is Only the Beginning. The Road to the Bottom
I cannot be liquidated. I am entirely in stablecoins, just as I said I would be. I am tired of this aggressive environment.
But why am I certain we are going lower?
Only futures traders have been liquidated so far. But there is an army of players using leverage through collateral. They collateralize BTC/ETH, receive stablecoins, buy more BTC/ETH with them, and collateralize again... creating a pyramid. They are waiting for BTC at $200k.
With a 40-60% drop from the peak, this pyramid will begin to collapse, causing a new wave of forced selling. The bottom, by my calculations, will be around $60,000 - $65,000.
And who needs these liquidations? The major financial players who need a good entry point. They don't buy at the highs. They buy on blood.
An Address to Every Trader
I want to speak to every one of you. Analysts, traders, investors, speculators. You work alone. One-on-one with your decisions, with your problems, in front of a screen.
I have immense respect for everyone who has stepped onto this path. You have entered a hostile environment where the smartest algorithms and entire corporations want to take your money.
I am disappointed myself. I was expecting an "altseason" that never came. And I admitted it in time: "Altseason" is a scam. A meme that no longer works with a million coins on the market. This isn't a flip-flop. I was following my plan: stay in until September.
To those who are waiting for the market to fly up now "without the excess baggage"—good luck. I am not participating in that. I will return to active buying closer to September 2026.
Who is left to push the market up? The 1.6 million liquidated traders? The traders who are no longer with us?
This post is not gloating. It is pain. And it is a final warning. Protect yourselves and your capital.
Best Regards EXCAVO
EUR/USD (Euro vs US Dollar) chart on the 4H timeframe...EUR/USD (Euro vs US Dollar) chart on the 4H timeframe, here’s the detailed analysis 👇
✅ Current Price: around 1.1613
✅ Trend: Bearish (price below Ichimoku Cloud and broken trendline support)
✅ Market structure: Retesting previous support zone as resistance — likely continuation to the downside
---
🎯 Target Levels
1. Primary Target (next support): 1.1500 – 1.1480
Matches My chart’s marked “Target Point”
This is the previous demand zone from early September
2. Extended Target (if bearish momentum continues): 1.1420 – 1.1400
This would be the next key support if price breaks below 1.1480 cleanly
---
🛡 Resistance / Stop-Loss
Immediate resistance: 1.1660 – 1.1675 (old support now flipped to resistance)
Stop-loss: above 1.1700 (if daily candle closes above, downtrend invalidates)
---
🔍 Summary
Trend bias: Bearish continuation
Sell zone: 1.1600 – 1.1650
Target 1: 1.1500 – 1.1480
Target 2: 1.1420 – 1.1400
Stop-loss: above 1.1700

BITCOIN – THE REAL REASON BEHIND THE FALLWhen I started trading someone told me something I’ll never forget: “If you can predict tomorrow’s newspaper headline, you understand the market.”
He didn’t mean I should chase news. He meant I should read structure so well that I know what kind of headline the market is already writing, before the mass even see it.
And now, looking around online, I see the complete opposite. Everywhere you look, there’s another “confluencer” talking about crypto with big words and zero understanding.
People selling dreams, memberships, and indicators, while they don’t even know what open interest or CVD means.
I’m not here to sell anything. I’m here to help people actually learn how to read data and see through the noise. Because what most of these so-called experts call “analysis” is just emotional guessing wrapped in confidence.
What I called and what happened
Last week I posted my “Big Dump” thesis.
I said Bitcoin would swing fail above the highs, then drop into the 104K region. That is exactly what happened.
Price ran the sweep into 126K, trapped the late buyers, and dumped straight into 104K.
People blamed tariffs. The tariff headline was the spark. The fuel was crypto’s own positioning.
Why the structure was ready to snap
Before the crash, the data told the story clearly.
Stablecoin OI went from 257K to 285K contracts (+10.9%). That is new leveraged exposure.
Coin-margined OI dropped during the breakout, then rose again near the highs. Shorts were fading strength.
Spot CVD stayed flat to slightly negative. Real buyers were missing.
The long/short ratio fell from 2.05 to 1.02 even while price kept climbing.
That’s what distribution looks like. Buyers on leverage pushing price up while stronger hands sell into them. No real spot demand, just futures exposure.
You don’t need a macro event to fall. You only need a reason for those leveraged buyers to stop bidding. Think of it like a crowded elevator. Everyone keeps piling in as it moves up, feeling safe because it hasn’t stopped yet. But the moment one person hesitates, the weight shifts. When the next person panics, the whole thing drops.
That’s what happens when a market is driven by leverage instead of conviction. You don’t need bad news, you just need hesitation.
Look back at similar events.
In May 2021, funding rates were insane, perps overloaded, and spot volume thin. Elon Musk tweeted about Bitcoin’s energy use. That tweet didn’t cause the dump. It just made leveraged longs pause. The bids disappeared and the cascade started.
In August 2023, Evergrande headlines hit. Bitcoin was sitting at resistance with flat spot CVD and rising OI. Equities wobbled, crypto longs hesitated, and the structure collapsed within hours.
In March 2020, when COVID panic hit, Bitcoin had already been stretched thin. Funding was high, leverage was heavy, and liquidity was weak. The virus didn’t break the market, leverage did.
Leverage creates confidence until it doesn’t. Price doesn’t fall because people start selling. It falls because nobody steps in to buy. Headlines decide when the drop starts. Structure decides how far it goes.
Why 104K was my first target
I didn’t pick 104K out of thin air. That level was built on confluence.
1) AVWAP from the April 7 auction
That swing low kicked off with massive volume. When a move starts with that kind of participation, the anchored VWAP becomes a key reference for institutional flow. It represents the average cost of that whole auction, and when extended forward, it acts as a dynamic area where liquidity and algorithms interact.
That blue AVWAP line from April has been running right through the 104K region.
It’s not that price revisited that auction, it’s that the anchored VWAP from that event still marks the fair value area for that entire move.When price traded back down into that region, it met that same volume-weighted anchor, creating a major confluence zone that algos and larger players watch closely.
2) The June 22 breakout left an LVN
A new auction started on June 22 and pushed higher, leaving a Low Volume Node behind.
An LVN is a thin zone on the volume profile where the market moved quickly with little trade.
Markets often revisit these thin areas later to find balance or test unfinished business.
3) HTF Fibonacci cluster
Multiple higher timeframe Fibonacci retracements and extensions overlapped near the same 104K area. When several fib levels align with structure, that’s a strong confluence zone watched by both human traders and algorithms.
The 104K region was where the AVWAP line, LVN, and fib cluster all met. That’s not a random target. It’s a structurally defined area where liquidity concentrates and where markets tend to react sharply. And that’s exactly what happened.
The spark versus the structure
The tariff headline didn’t cause the drop. It triggered it.
The structure was already unstable. Leverage was maxed. Spot demand was flat. Funding was positive and rising. When the tariff news hit, traditional markets pulled back and crypto followed instantly. It wasn’t correlation, it was liquidity contagion.
Traders managing multiple books de-risk across assets when volatility spikes. That creates a gap in liquidity. When the bids vanish, the market falls into the first real pool of resting orders — in this case, the 104K zone.
You saw the same mechanics during the March 2020 crash and the 2021 deleverage. External shocks trigger internal liquidation cascades. That’s why saying “this had nothing to do with crypto is completely wrong.
This had everything to do with crypto. It’s like blaming the thunder for breaking a window when the glass was already cracked. Or saying the iceberg sank the Titanic when the captain was already steering through a sea of warnings.
Crypto was structurally weak. Leverage was stretched, spot demand was gone, and funding was positive. When the headline hit, it didn’t cause the collapse. It just gave the market permission to do what it was already set up to do — unwind.
Crypto is built on leverage.
Perpetual futures dominate volume.
Stablecoin collateral drives exposure.
When external risk events change funding conditions or risk appetite, the crypto market reacts instantly because its structure is fragile by design.
Example:
When yields spike, the dollar strengthens and funding costs rise. Leveraged longs become more expensive to hold, so traders unwind positions.
When equities dump, cross-asset desks reduce risk globally, which pulls liquidity out of crypto perps too.
Intermarket correlation always matters. Macro sets the mood. But the speed and violence of crypto moves always come from leverage inside the system.
How you can spot it next time
Compare Spot CVD vs Stablecoin CVD. If stablecoin CVD rises while spot stays flat or negative, the rally is leverage-driven.
Track Open Interest vs Price. Both rising together usually means exposure is building. Confirm with spot flow.
Watch the Long/Short ratio. If it drops while price rises, shorts are entering and the move may be getting absorbed.
Anchor VWAPs to real pivots like swing lows, breakouts, or liquidation spikes. Those levels attract institutional flow.
Study Volume Profiles. LVNs are thin and often retested. HVNs are balance zones that attract price.
Map HTF fib clusters for confluence. Reactions are stronger when multiple timeframes agree.
Note single prints and thin brackets on TPO or volume profiles. These often act as magnets.
When these factors line up, you don’t need to predict headlines.
You’ll already most likely know which headline will break the market.
TLDR
The rally was leverage-driven: Stablecoin OI up 10.9%, Spot CVD flat, Long/Short ratio down from 2.05 to 1.02
The swing fail at 126K was the final liquidity grab
104K was the target due to AVWAP + LVN + HTF fib cluster
The tariff headline was the spark, not the cause
The crash was caused by leverage and missing spot demand
Crypto didn’t fall because of politics. It fell because the market was already begging for an excuse to reset.
The data showed it clearly weeks before the drop.
If this helped you see the market a little clearer or made you think differently about how price really moves, please leave a like and drop a reaction. It keeps me motivated to keep posting real analysis, not the copy-paste bullshit hype that floods your feed every day.
Check the Order Flow Data from 6 October here: ibb.co
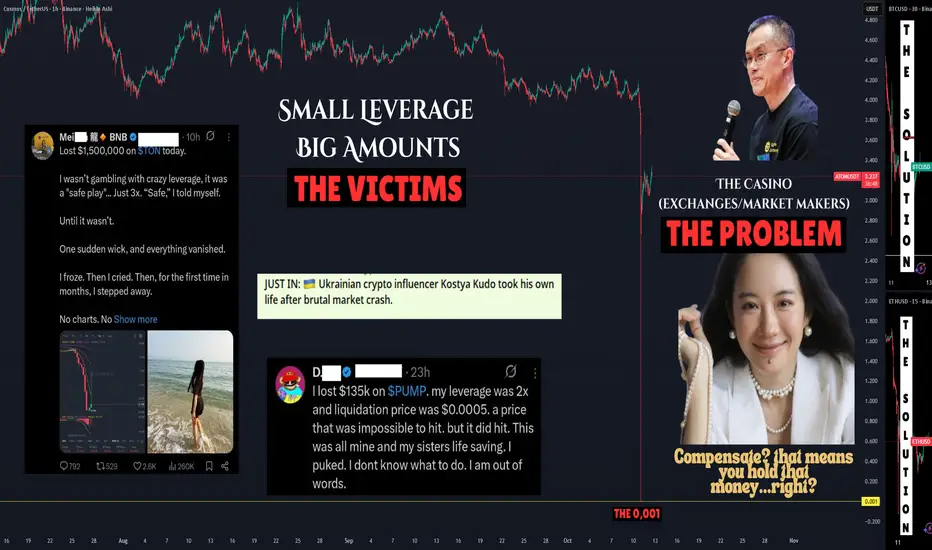
The Problem With Crypto – Part 1: Centralized 'Exchanges'🧠 The Problem With Crypto – Part 1: Centralized Exchanges
It actually took me a while to decide what title to give this post.
Because every single one of these would fit:
-The Exchange Illusion
-The Liquidation Machine
-The Centralized Harvest
-Inside the Casino
-How Exchanges Always Win
-Where Did Your Money Go? 💰
-They Say They’ll Compensate You… So Who’s Holding Your Cash?
-The Perfect Crime Nobody Talks About 🎭
-Your Loss = Their Profit
-The Casino Always Wins 🎰
And honestly… they’re all partially — or maybe wholly — true.
💥 About Friday’s Crash
Friday’s collapse wasn’t random.
It wasn’t “volatility.”
It was a harvest event — engineered by liquidation engines that feed the exchanges.
Coins didn’t drop 50–60 % because of news — they dropped because leverage met latency, and the house collected the pot.
👩🏫 A Question From My Student
One of my community members, Sarah, asked me:
“Professor, how did this even happen? How can small-leverage positions just disappear?”
So here’s the truth — no sugar-coating. ☕💀
🎭 The Illusion of Liquidity
When you see a coin drop 50–60 % in minutes, that’s not price discovery — it’s engineered implosion.
Exchanges create the illusion of deep liquidity, but when panic hits, that liquidity vanishes faster than your stop-loss button.
They brag about billions in open interest, but that’s just leveraged ghost money.
On a 100× market, $10 million in deposits looks like $1 billion of “open interest.”
A 1 % move = total collapse of the stack.
🧨 How the Domino Falls
1️⃣ Market dips 1–2 %.
Liquidation bots start killing over-levered longs.
2️⃣ Those positions don’t close quietly — the system market-sells them, pushing price lower and triggering the next wave.
3️⃣ Within seconds you have a cascade — a healthy market turns into a slaughterhouse.
That’s how you get –60 % in five minutes on a coin with no news, no hack, no reason.
🏦 The Exchanges’ Dirty Secret
They love these crashes.
Because every liquidation = trading fee + funding reset + spread capture.
They collect the liquidation fee (usually 0.5–1 %).
They resell your collateral into thin order books.
Their own market makers scoop up panic liquidity at discounts.
Then the price “recovers” 30–40 % like nothing happened.
It’s not volatility — it’s profit harvesting disguised as market action.
🧮 “But It’s the Trader’s Fault, Right?”
That’s the official line.
They’ll say, “You were liquidated because you took too much risk.”
But here’s what nobody explains:
Your liquidation price often triggers before your stop-loss — sometimes way before.
Let’s say you open a position with $100 using 50× leverage.
Your exposure is $5 000.
You’d expect to only lose that $100 if the market moves 2 %.
Instead, the exchange liquidates you when your position drops about 75 % of your margin,
so you’re wiped out on a 1.5–2 % move — while the chart barely twitches.
Now compound this:
If you scale or DCA into a trade, the liquidation engine recalculates your threshold even closer —
often within 10–15 % of normal price action.
Meaning your trade could still have equity left, but the exchange force-closes it,
sells it into the book, and keeps the rest.
And here’s the question no one dares to ask:
👉 If these exchanges have AI, algorithms, and “smart risk engines,”
why don’t they auto-close your position when you’re down 10–15 % and just take the loss?
Why do they wait until liquidation — when the trader loses 100 % and the exchange keeps the remainder?
Where does that extra money go?
It doesn’t vanish.
It’s absorbed by the exchange’s insurance and profit pools — the same ones that market makers draw from.
In other words, they could have saved you at minus 15 %,
but they chose to liquidate you at minus 100 % because it pays them better.
That’s not a trading platform.
That’s a profit engine disguised as protection.
(in Part 3 we will examine a lot more closely into this and other factors like how order books work and WHO sets them UP!!!!)
🩸 Small Leverage, Big Losses
People think “2× or 3× is safe.”
It wasn’t.
Friday proved that even low leverage isn’t safe when the exchange controls the price feed.
We saw NASDAQ:ATOM , NYSE:PUMP , and others hit zero ticks on Binance.
That’s not a market event — that’s a systemic failure or an engineered flush.
One trader lost $135 K at 2×.
Another lost $1.5 M at 3×.
These aren’t degens — they’re victims of a broken system.
💬 Community Voices Demanding Answers
Even the Turkish crypto community (and I'm 100% Greek by the way) publicly asked CZ:
“How can altcoins crash 90 % in seconds when no one sold?
How can prices nuke without real volume?
And why did tokens not listed on exchanges stay safe?”
These are valid questions.
And Binance, Bybit, MEXC and the rest — owe us PROPER answers.
🧾 The Yi He Statement
Yi He, co-founder and Chief Customer Service Officer of Binance — the public face of the company after CZ — finally spoke.
She said:
“We’ll address losses case-by-case.
We won’t compensate for price fluctuations or unrealized losses.”
Now, read that carefully.
Translation: We hold the money and decide who gets it back.
If Binance can “compensate,” that means the liquidated funds didn’t vanish — they were captured and are still inside the system.
And that raises the obvious question:
👉 Where does all that liquidation money actually go?
Yi He’s post feels like the moment when you lose at a casino, the dealer miscounts the chips, and management says, “Don’t worry, we’ll review your case individually.”
You know the money never left the casino.
So is it the same here?
Do the exchanges hold these funds?
How are they redistributed?
We need clear answers — from Yi He herself, from CZ, and from every exchange that claims to be transparent.
It’s time they step forward and explain how these liquidation systems truly work — because people lost life savings, and silence isn’t customer service.
⚙️ The Mechanics Behind the Scenes
1️⃣ When you’re liquidated, your collateral is sold instantly into the order book.
2️⃣ That money moves into the exchange’s insurance fund.
3️⃣ The insurance fund feeds market makers to “stabilize” prices.
4️⃣ The exchange earns fees on each loop.
It’s a closed system where every loss feeds their balance sheet.
🧯 The Verdict
-Friday’s crash wasn’t a bug.
-It was a business model.
-A perfect harvest executed in 24 hours.
While millions lost life savings, exchanges collected fees, spreads, and collateral — and then tweeted “systems functioned normally.”
Until there’s transparency on liquidation flows, public insurance fund audits, and a ban on exchange-owned market makers, this will happen again.
💙 Final Word
To every retail trader who lost money on Friday — you weren’t reckless.
You were caught in a system designed to protect itself first and you last.
This is only Part 1 of The Problem With Crypto.
There will be at least two more parts, because this story runs far deeper than one flash crash.
I originally planned to release this series at the end of October,
but what happened on Friday forced me to start early.
The truth couldn’t wait.
Part 2 will dive into the unregulated, decentralized perpetual DEXs —
names like Aster, Hyperliquid, and others — platforms offering anonymity to insider traders and quietly damaging the market from multiple angles.
Part 3 will expose the market-maker cartels and their connections to the exchanges,
showing how price control and “liquidity partnerships” have become the hidden layer of manipulation behind every listing.
But it won’t end in darkness.
Because every cycle — like in the ancient Greek tragedies — follows the same path:
Ύβρις → Άτη → Νέμεσις → Κάθαρσις
(Hubris → Delusion → Retribution → Catharsis)
We’re living through Νέμεσις now — the correction phase.
The arrogance, the greed, the manipulation — they’re being exposed.
And what comes next is Κάθαρσις — purification and renewal.
That’s where the good side of crypto will rise again:
cleaner, fairer, more transparent.
Crypto doesn’t need to burn — it just needs to evolve.
And it will.
👉There are some truths I can’t fully share here — TradingView has its limits
and I’ve been banned before for saying too much or crossing lines. (can't advertise and sharing links might appear like that, so i won't risk it, sorry!)
So I’ll explain everything I can’t post here in a separate, long-form video soon (I am allowed to post my links here so follow those).
Stay tuned — because this story is just another day of progress 👩🏫 :
For those who remember my post from November 2022 — “Just another delay: Bitcoin will prevail” —
I’ll say it again, two years later, with even more conviction:
It was never the end.
It was only Nemesis on the way to Catharsis.💙💙💙
Bitcoin — and the real spirit of crypto — will prevail. 💙💙
As for the exchanges: It's your time to get your Token2049 parties aside and start thinking and acting right, like there IS a tomorrow! Start with giving your side of the story, explanations.
One Love,
The FX PROFESSOR 💙
PS. This ATOM to 0.001 chart should first hunt you (👉 你 (nǐ)) — and then it should never happen again in crypto.
The tech is there to make crypto what it’s supposed to be — use it and stop abusing it.
Every problem has a solution. 🔧
Wall Street Weekly Outlook - Week 42 2025Every week I release a Wall Street Weekly Outlook that highlights the key themes, market drivers, and risks that professional traders are watching.
This week promises to be particularly volatile.
With tensions escalating in the U.S.–China trade conflict, markets already began to show the first signs of risk-off sentiment late Friday. In this video, I’ll break down what this shift means for global markets and how investors can navigate the current environment.
+Extra lesson:
Any questions? Drop a comment or reach out directly.
-Meikel
