Bitcoin - Bear flag, 74k confirmed! (warning, must see)Bitcoin has just completed its bearish flag formation. What now? The probability of going down is now around 70%, while the probability of going up is only 30%. Many times we see a bullish breakout of a bear flag. How does it look? Something like that:
We see that for a bullish breakout, the bulls need to completely go above the flag's resistance, which is much harder than simply going down, especially in a strong bear market, like in this Bitcoin's case.
Bitcoin's price and development are completely controlled by the banks and huge institutions that control this planet. To make money, you have to identify their actions on the chart.
On the chart we can also see a completely unfilled FVG (Fair Value GAP). Precisely between 90600 and 92060. There is a possibility for Bitcoin to partially or completely fill this GAP before starting the upcoming drop! Longs are riskier at this point, because we want to trade with the bearish trend. But if the price increases in the short term, we can have a much better entry point for our short position on futures. It's also a possibility to retest the long-term blue trendline from the all-time high.
From the Elliott Wave point of view, this bear flag seems to be a complex corrective pattern. To be honest, I don't see any signs of strength, such as an impulse wave or a leading diagonal wedge pattern. I am currently bearish on Bitcoin, and I expect a pretty significant drop in the coming weeks! Especially January is statistically an extremely weak month for Bitcoin.
Write a comment with your altcoin + hit the like button, and I will make an analysis for you in response. Trading is not hard if you have a good coach! This is not a trade setup, as there is no stop-loss or profit target. I share my trades privately. Thank you, and I wish you successful trades!
Community ideas

Bitcoin (BTCUSDT): Double Top Confirms Short-Term Bearish ShiftHi
Market Structure:
BTC formed a clear double top, signaling exhaustion near recent highs. This structure marked a shift from bullish momentum to short-term bearish control. Following the rejection, price began making lower highs and lower lows, confirming a local downtrend.
Trend & Price Action:
Price is currently trading below a descending trendline, acting as dynamic resistance. Each attempt to move higher has been capped, reinforcing bearish pressure. The recent pullback toward the trendline appears corrective rather than impulsive.
Key Levels:
Resistance Zone: 88,800 – 89,100
Current Price Area: ~86,900
Major Support / Target: 83,500 – 83,000 (demand zone)
Outlook & Strategy:
As long as price remains below the descending trendline, downside continuation toward 83.5k remains the higher-probability scenario. A confirmed breakout above resistance would be required to invalidate the bearish bias.

Bitcoin - Can it reclaim $89.000?Bitcoin (BTC) is currently trading in a crucial zone after the recent decline, positioned between a bullish 4-hour FVG around the lower $85,000 region and a 4-hour bearish FVG just below resistance. This BTC technical analysis focuses on whether Bitcoin can reclaim the lost trendline and the associated FVG, or whether the market instead opts for a deeper correction.
Bullish 4H FVG
The bullish 4-hour FVG around approximately $85,500 is holding for now as an important support level. From this zone, BTC recently initiated a modest bounce, indicating that buying interest is still present. As long as price continues to close above this FVG, there remains technical room for a larger recovery move toward the higher resistance zones.
Bearish Scenario
The bearish scenario centers on a rejection within the 4-hour bearish FVG that aligns with the previously broken ascending trendline. If BTC only revisits this area as a retest and is subsequently sold off, it would confirm that former support has turned into resistance. In that case, lower prices become likely again, with potential targets below the recent lows and deeper into the $80,000 range.
Bullish Scenario
The bullish scenario requires a convincing reclaim of both the trendline and the 4-hour bearish FVG above it. If BTC manages to close above this cluster and then successfully retest it as new support, market sentiment would shift back in favor of the bulls. In that case, BTC would likely revisit the recent highs near the major resistance zone. This BTC technical analysis therefore emphasizes that the reaction around the converging trendline and FVG will be decisive for the next larger move.
Conclusion
BTC is currently at an important crossroads between a still-holding bullish 4-hour FVG around $85,500 and a critical 4-hour bearish FVG at the broken trendline. A rejection at the upper levels increases the probability of further downside, while a clear reclaim of both the trendline and the FVG would open the door for a retest of the highs.

BTC Breaks Wedge Structure, Bearish Pressure IncreasingBTC Breaks Wedge Structure, Bearish Pressure Increasing
Over the past month, Bitcoin has been consolidating within a large wedge pattern, creating a complex and somewhat misleading structure.
The recent breakout has clarified the pattern as bearish, significantly increasing the probability of further downside.
This shift in momentum may also be influenced by recent MicroStrategy-related news, particularly discussions about its potential removal from the US100 benchmark.
Growing concerns around MicroStrategy’s business model,given its extreme sensitivity to Bitcoin’s price fluctuations, have raised uncertainty in the market.
As one of the largest Bitcoin holders, any negative sentiment surrounding MicroStrategy can directly impact BTC price action.
If Bitcoin continues to hold below the broken wedge structure, bearish continuation becomes more likely. In that scenario, downside targets come into focus at:
82,000
76,400
You may find more details in the chart!
Thank you and Good Luck!
PS: Please support with a like or comment if you find this analysis useful for your trading day

USDCAD Potential DownsidesHey Traders, in today's trading session we are monitoring USDCAD for a selling opportunity around 1.38100 zone, USDCAD is trading in a dowtrend and currently is in a correction phase in which it is approaching the trend at 1.38100 support and resistance area.
Trade safe, Joe.

Lingrid | GOLD Anticipating Brief Corrective PullbackOANDA:XAUUSD perfectly played out my previous trading idea . Price has pushed into the 4,350 resistance band after printing a marginal higher high, but price is now stalling beneath a well-defined supply zone. The latest advance appears stretched, with momentum flattening as price hugs the upper boundary of the ascending structure. This behavior may suggest buyers are losing follow-through strength at premium levels.
If selling pressure increases here, gold could drift lower toward the 4,230 area, where the rising trendline and prior consolidation overlap. That zone may act as a short-term magnet before any broader trend decision unfolds.
➡️ Primary scenario: rejection from 4,350 → pullback toward 4,230.
⚠️ Risk scenario: a firm acceptance above 4,360 could negate the retracement setup and expose 4,400.
If this idea resonates with you or you have your own opinion, traders, hit the comments. I’m excited to read your thoughts!

How to Use VWAP in Confluence with StructureVWAP is one of the few indicators that consistently adds value when used correctly. It does not predict direction and it does not replace market structure, but it provides a powerful reference point for where fair value sits within the current session or trend.
When combined with structural analysis, VWAP helps you filter trades, improve timing, and avoid impulsive entries that fight the underlying flow.
The first step is understanding what VWAP represents. It shows the average price weighted by volume, reflecting where most transactions have occurred. When price trades above VWAP, it signals that buyers are in control of the session.
When price trades below it, sellers dominate. This context becomes meaningful only when it aligns with the higher timeframe structure.
Start by establishing your bias through market structure.
If the higher timeframe is in an uptrend and price trades within a discount zone, VWAP becomes a dynamic confirmation tool. A reclaim of VWAP after a liquidity sweep or after a break of structure is one of the cleanest signals that buyers are stepping back in.
The same applies in reverse for downtrends: a VWAP rejection after a pullback into premium strengthens the short bias.
VWAP also adds clarity during intraday consolidation. Ranges often form around VWAP because it reflects the session’s equilibrium. Breakouts that occur away from VWAP without pullbacks frequently lack durability.
However, a breakout followed by a retest of VWAP shows acceptance and builds confidence in continuation. This combination turns a common indicator into a reliable filter rather than a standalone signal.
Another effective use of VWAP is identifying exhaustion. When price aggressively pushes far above or below VWAP, it often signals that the move is extended. This does not mean you fade the trend, but it does mean you tighten expectations and wait for structure to align before entering. Once price reconnects with VWAP and shows intent, the next move becomes more sustainable.
VWAP becomes particularly powerful when paired with session logic. Trading above VWAP in a bullish higher timeframe environment during London or New York sessions often leads to cleaner impulses.
Trading against VWAP during low-volume hours produces far more false signals. Timing, structure, and VWAP together create a cohesive framework.
Used in confluence, not in isolation, VWAP supports disciplined decision-making.
It aligns entries with momentum, filters low-quality setups, and clarifies whether the market accepts or rejects a level. When you combine VWAP with structure, liquidity, and session context, your trades become more intentional, less emotional, and significantly more consistent.
BTCUSD Holds Triangle Support - Bounce Toward 88,500 ExpectedHello traders! Here’s my technical outlook on BTC/USD based on the current chart structure. After a prolonged bearish move inside a downward channel, Bitcoin found a base near the lower boundary and reversed sharply, signaling seller exhaustion and a shift in momentum. This reversal was followed by a breakout above the descending resistance, confirming the end of the bearish phase. Price then entered a consolidation range, where accumulation took place before a confirmed breakout pushed BTC higher. Following the range breakout, the market formed a triangle structure, with price respecting the Triangle Support Line while facing pressure from the Triangle Resistance Line. Recently, BTC revisited the Buyer Zone around 86,300–85,500, which aligns with both horizontal support and the lower triangle boundary. Buyers stepped in at this level, defending the structure and keeping the recovery scenario intact. Currently, BTC is attempting a rebound from the Buyer Zone and is aiming toward the 88,500 Resistance Level (TP1). As long as price holds above the support zone, a move toward this resistance remains likely. A clean breakout above 88,500 would confirm further upside continuation, while rejection could lead to another consolidation or retest of support. For now, the structure favors buyers, with 86,300–85,500 as key support and 88,500 as the main upside target. Please share this idea with your friends and click Boost 🚀

BTC - Shakeout Complete… Is the Trap Set???Bitcoin just delivered a classic manipulation move into the higher-timeframe demand zone❗️ The sharp sell-off below structure flushed late longs and triggered stops, only to be quickly reclaimed.
That’s not weakness. That’s intent.
📉📈From a structural perspective , this demand zone has already proven itself before. Price reacted strongly from it in the past, and once again, buyers stepped in aggressively after the sweep. This suggests the downside move was more about liquidity than genuine trend reversal.
⁉️ Now comes the key question.
⚔️As long as BTC holds above this demand and continues to build acceptance, the focus shifts to a recovery move back into the prior structure and supply zone above. That area will be the real test, whether this bounce is just a correction, or the start of a larger continuation.
For now, patience is key. Let price show its hand near demand before committing.
Is this the reset before the next leg higher, or just a temporary relief bounce? 🤔
⚠️ Disclaimer: This is not financial advice. Always do your own research and manage risk properly.
📚 Stick to your trading plan regarding entries, risk, and management.
Good luck! 🍀
All Strategies Are Good; If Managed Properly!
~Richard Nasr

EURUSD Weekly CLS Model 1 nested in Monthly CLS Hi friends, new range created. As always we are looking for the manipulation in to the key level around the range. Don't forget confirmation switch from manipulation phase to the distribution phase to make the setup valid. Stay patient and enter only after change in order flow. If price reaches 50% of the range take partial or full close.
👊 Your ultimate goal as a trader is not to be a generalist who knows 10 000 patterns. But rather create one system with narrowed criteria of each element of the trade to remove subjective and emotional decisions as much as possible and stick to this system no matter what. Practice it 10 000 times become a MASTER.
I promised myself I’d become the person I once needed the most as a beginner. Below are links to a powerful lessons I shared on Tradingview. Hope it can help you avoid years of trial and error I went thru.
📊 Sharpen your trading Strategy
⚙️ 100% Mechanical System - Complete Strategy
🔁 Daily Bias – Continuation
🔄 Daily Bias – Reversal
🧱 Key Level – Order Block
📉 How to Buy Lows and Sell Highs
🎯 Dealing Range – Enter on pullbacks
💧 Liquidity – Basics to understand
🕒 Timeframe Alignments
🚫 Market Narratives – Avoid traps
🐢 Turtle Soup Master – High reward method
🧘 How to stop overcomplicating trading
🕰️ Day Trading Cheat Code – Sessions
🇬🇧 London Session Trading
🔍 SMT Divergence – Secret Smart Money signal
📐 Standard Deviations – Predict future targets
🎣 Stop Hunt Trading
🧠 Level Up your Mindset
🛕 Monk Mode – Transition from 9–5 to full-time trading
⚠️ Trading Enemies – Habits that destroy success
🔄 Trader’s Routine – Build discipline daily
💪 Get Funded - $20 000 Monthly Plan
🛡️ Risk Management
🏦 Risk Management for Prop Trading
📏 Risk in % or Fixed Position Size
🔐 Risk Per Trade – Keep consistency
Never stop learning
David Perk

Why Consistency Beats Talent in TradingWelcome all to another post! In today's post we will review the difference between Talented trading and consistent trading.
Why Consistency Beats Talent in Trading
Many new traders usually enter trading believing that success belongs to the most intelligent individuals, the most analytical, or the most “naturally gifted.” In any field.
When in reality, the market only rewards something that is far less glamorous, and that is.. consistency.
Talent can help you understand charts faster and/or grasp concepts a lot quicker, but it is consistency that determines and shows whether you survive long enough to become profitable and make a positive return.
Talent Creates Potential | Consistency Creates Results
Talent shows up early, like in the first week or two.
You might spot patterns instantly, win a few trades, or feel like trading “just makes sense” to you.
Consistency shows up later and it’s far rarer.
The market does not care how smart you are.
It only responds to:
- How often you follow your rules and system.
- How well you manage risk ( or gamble it. )
- How disciplined you are under pressure and stress
- A talented trader who trades emotionally will eventually lose, ( always lose. )
- A consistent trader with average skills can compound them steadily over time.
Why Talented Traders Often Struggle
Ironically, talent can be a disadvantage ( keep on reading )
Talented traders often:
- Rely on intuition instead of their own rules or the games rules ( or common sense. )
- Take trades outside their plan ( like above, not following their rules. )
- Increase risk after a few wins ( again, not following RM rules. )
- Ignore data because “ they feel confident ”
This leads to inconsistency big wins followed by bigger losses. ( Gambling )
The market eventually punishes anyone who treats probability like certainty.
Consistency Turns Probability into an Edge
Trading is not about being right it’s about commencing the same process over and over.
Consistency means:
- Taking only the setups you’ve defined. (Defined what A+ is)
- Risking the same amount per trade. (Risk Management)
- Accepting losses without deviation. (Moving on after a loss)
- Following your plan even after losing streaks. (Maintaining consistency)
One trade means nothing.
A hundred trades executed the same way reveal your edge.
Consistency allows probability to work for you, not against you.
The Market Rewards Discipline, Not Brilliance
The best traders in the world are not constantly trying to outsmart the market.
They:
- Trade fewer setups
- Keep their approach simple
- Protect capital first
- Let time and repetition do the work
- They understand that survival is the first goal.
- You can’t compound an account you’ve blown.
Consistency Is Boring and That’s the Point
Consistencty lacks excitement.
There are no adrenaline rushes, no heroic trades, no all-in moments.
Just repetition, patience, and restraint. This is why most people fail.
The market filters out those who chase excitement and rewards those who treat trading like a business, not entertainment.
Talent Without Consistency Is Temporary
Many traders experience early success.
Very few maintain it.
Short-term success often comes from:
- Favorable market conditions
- Random luck
- Overconfidence
Long-term success comes from:
- Process
- Risk control
- Emotional discipline
Consistency is what turns a good month into a sustainable career.
How to Build Consistency as a Trader
Consistency is a skill not a personality trait.
You build it by:
- Defining clear trading rules
- Using fixed risk per trade
- Journaling every trade honestly
- Reviewing performance regularly
- Trading less, not more
Your goal isn’t to be impressive.
Your goal is to be repeatable.
Final Thoughts
Talent may get you interested in trading.
Consistency keeps you in the game.
In a profession driven by uncertainty, the trader who shows up the same way every day will always outperform the one chasing brilliance.
In trading, consistency doesn’t just beat talent > it replaces it.
Thank you all so much for reading, I hope everyone enjoys it and that it benefits you all!
Let me know in the comments below if you have any questions or requests.

GOLD scenario potential continuation setup.Gold is trading within a broader consolidation range after a strong bullish impulse. Price previously ranged sideways before breaking higher, confirming bullish strength. The current structure shows price pulling back into a key demand zone, suggesting a potential continuation setup.
Technically if price holds above the demand zone and breaks above 4,340, a continuation toward 4,372 is likely if the price looks weak we could expect price again move to downside a support level could 4272 t0 4250
You may find more details in the chart,
Trade wisely best of luck buddies.
Ps; Support with like and comments for better analysis thanks for supporting.

GBPUSD I Weekly CLS Model 1 - Key Level FVG + SMTHi friends, new range created. As always we are looking for the manipulation in to the key level around the range. Don't forget confirmation switch from manipulation phase to the distribution phase to make the setup valid. Stay patient and enter only after change in order flow. If price reaches 50% of the range take partial or full close.
👊 Your ultimate goal as a trader is not to be a generalist who knows 10 000 patterns. But rather create one system with narrowed criteria of each element of the trade to remove subjective and emotional decisions as much as possible and stick to this system no matter what. Practice it 10 000 times become a MASTER.
I promised myself I’d become the person I once needed the most as a beginner. Below are links to a powerful lessons I shared on Tradingview. Hope it can help you avoid years of trial and error I went thru.
📊 Sharpen your trading Strategy
⚙️ 100% Mechanical System - Complete Strategy
🔁 Daily Bias – Continuation
🔄 Daily Bias – Reversal
🧱 Key Level – Order Block
📉 How to Buy Lows and Sell Highs
🎯 Dealing Range – Enter on pullbacks
💧 Liquidity – Basics to understand
🕒 Timeframe Alignments
🚫 Market Narratives – Avoid traps
🐢 Turtle Soup Master – High reward method
🧘 How to stop overcomplicating trading
🕰️ Day Trading Cheat Code – Sessions
🇬🇧 London Session Trading
🔍 SMT Divergence – Secret Smart Money signal
📐 Standard Deviations – Predict future targets
🎣 Stop Hunt Trading
🧠 Level Up your Mindset
🛕 Monk Mode – Transition from 9–5 to full-time trading
⚠️ Trading Enemies – Habits that destroy success
🔄 Trader’s Routine – Build discipline daily
💪 Get Funded - $20 000 Monthly Plan
🛡️ Risk Management
🏦 Risk Management for Prop Trading
📏 Risk in % or Fixed Position Size
🔐 Risk Per Trade – Keep consistency
Good Luck
David Perk aka Dave Fx Hunter

BTCUSDT: Sellers Defend Resistance - Support Zone at $85,200Hello everyone, here is my breakdown of the current BTCUSDT setup.
Market Analysis
BTCUSDT previously moved inside a clear downward channel, confirming strong bearish pressure. After reaching the lower boundary, price produced a temporary bounce and broke above the channel, but this move failed to develop into a sustainable bullish trend. Instead, BTC entered a consolidation range below the key 88,000 Resistance Zone, showing clear hesitation from buyers. Following the range formation, price developed a descending triangle structure, with lower highs forming along the Triangle Resistance Line and support being tested near the 85,200 Support Zone. Multiple fake breakouts above resistance and below support indicate liquidity grabs rather than true reversals. Recent price action shows rejection from the Resistance Zone and a failure to reclaim the upper range, suggesting seller dominance is returning.
Currently, BTCUSDT is trading below the 88,000 Resistance Zone and remains capped under the Triangle Resistance Line, keeping bearish pressure intact.
My Scenario & Strategy
My scenario is short-biased as long as BTCUSDT stays below the 88,000 Resistance Zone and the Triangle Resistance Line. I expect price to continue drifting lower toward the Triangle Support Line, with a primary target at the 85,200 Support Zone. A confirmed breakdown below this support would signal continuation of the bearish trend and open the path for deeper downside.
However, if price instead breaks and holds above 88,000 with strong momentum, the short scenario would be invalidated. Until that happens, rallies into resistance are viewed as selling opportunities.
That’s the setup I’m watching. Trade carefully and always manage your risk.

EUR/USD - Central Bank Week in Control (18.12.2025)📝 Description🔹 Market Context (Fundamental) FX:EURUSD
This week is central-bank heavy, keeping EUR/USD sensitive to volatility and USD strength:
BoE (Thursday): High impact – rate cut expected → risk-off tone
ECB (Thursday): Low impact – policy hold expected
BoJ (Friday): High impact – rate hike expectations, supporting JPY and pressuring USD pairs via risk repricing
Overall, policy divergence + risk uncertainty keeps EUR/USD capped near resistance.
🔹 Technical Setup
Price is trading below a key resistance zone and struggling to hold above short-term EMA / cloud levels. Repeated rejections from the highlighted zone indicate seller dominance.
As long as price stays below resistance, pullbacks are likely to extend lower.
📌 Trade Plan 🔴 Bearish below resistance
Sell-on-rejection from the resistance zone
Momentum confirmation preferred on lower timeframes
🔴 1st Support: 1.1685
🔴 2nd Support: 1.1660
#EURUSD #ForexTrading #FundamentalAnalysis #CentralBankWeek #PriceAction #SupportResistance #FXMarket #TradingView #Kabhi_TA_Trading
⚠️ Disclaimer
This analysis is for educational purposes only.
Not financial advice. Always manage risk and use a stop-loss.
❤️ Support the Analysis 👍 Like if this breakdown helps 💬 Comment your EUR/USD bias
🔁 Share with fellow traders

XAUUSD – The Bullish Trend Remains DominantGold prices edged higher in the previous session after the U.S. jobs report showed that the unemployment rate continued to rise , reinforcing expectations that the Fed will maintain its rate-cutting path . As rate expectations decline, the U.S. dollar weakens, providing a solid foundation for gold to sustain its medium-term bullish momentum.
From a technical perspective, XAUUSD on the H2 timeframe continues to maintain a clear bullish structure . Price is trading above the ascending trendline , indicating that buyers remain in control of the market. The 4,300 level is acting as a key support zone, consistently absorbing selling pressure during pullbacks.
As long as XAUUSD holds firmly above 4,300 , the current retracement is likely purely technical. In this scenario, the bullish trend is expected to resume, with upside targets toward the 4,350 – 4,370 zone.
Overall, gold is being supported by both a favorable macro backdrop and a constructive price structure. While the trend remains intact, the optimal strategy is to stay patient and follow the flow of capital, using pullbacks as opportunities rather than chasing price.

GOLD: In a bigger accumulation before moving higherGOLD: In a bigger accumulation before moving higher
Today, the US reported NFP data for October and November 2025.
USD Non-Farm Payrolls for October were -105k vs. 119k previously.
USD Non-Farm Payrolls for November were 64k vs. 50k expected.
Initially, the USD started off a bit weak, but as we can see for November we had a strong increase in employment data. This could be the reason why the USD started showing some strength again.
Today gold rose from 4271 during the day and reached 4335 during the news.
The strength of the USD pushed gold back down, but gold should rise soon again. The USD lost the correlation a long time ago. So however the USD could be tomorrow gold may rise further.
In my opinion, we could be in for a larger than normal bullish accumulation before gold moves further to 4350; 4380; 4400 and 4450.
You may find more details in the chart!
Thank you and Good Luck!
PS: Please support with a like or comment if you find this analysis useful for your trading day

Japan just sent a warning most Bitcoin traders are missing!Hey @TradingView Community,
Japan just sent a signal most traders are overlooking
Let me explain
The Bank of Japan is preparing to raise interest rates toward 0.75%
Levels not seen in decades
On the surface, it looks insignificant but In reality, it impacts global liquidity
For years, Japan has been the cheapest source of capital. Investors borrowed yen at near-zero rates and deployed that money into risk assets like equities, real estate, and crypto.
This is the yen carry trade!
When rates rise, leverage unwinds.
Not because Bitcoin is weak but because cheap money disappears.
Higher borrowing costs lead to:
• Leveraged position closures
• Forced selling
• Increased volatility
This is not Japan targeting Bitcoin, this is liquidity tightening!
Bitcoin is still being traded as a leveraged risk asset, not held purely as a long-term store of value and that distinction explains the reaction
At We Trade Waves we don’t panic over volatility, we study where price pressure comes from, how to read the structures and how to take advantage of the next move
Assets dependent on leverage are fragile but Assets held with conviction turn volatility into opportunity
Japan’s move isn’t about 0.75%
It’s about discipline returning to markets and every cycle reminds us of the same truth:
Easy money inflates moves
Tight conditions reveal structure
That’s how real market understanding is built and that's how cycles and waves works
And the most important part, don't forget We Trade Waves 4 Golden rules!
1) Do not jump in
2) Do not over risk/trade
3) Do not trade without Stop Loss
4) Never ever add to a losing position!
What’s your take: short-term liquidity shock or a healthy market reset?
Trade with care,
Alain M(Coach)
WTW Team

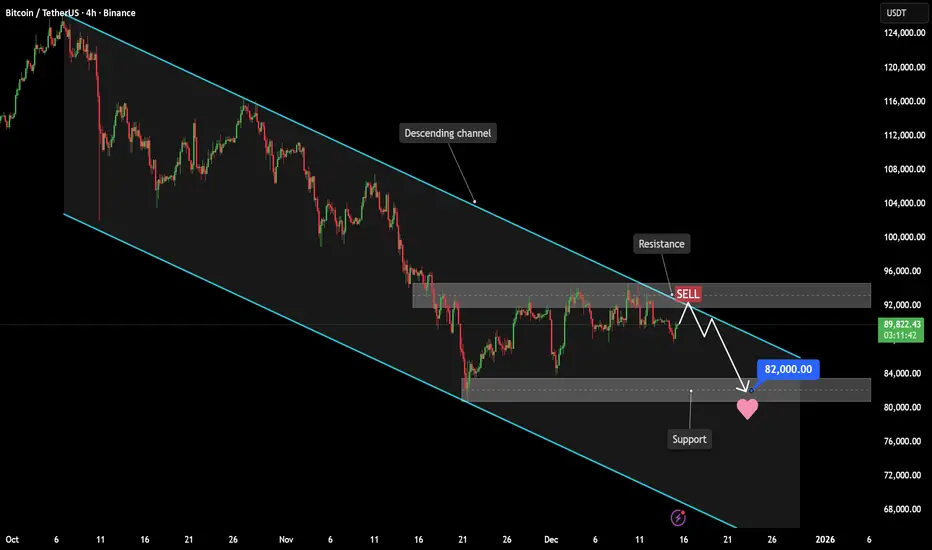
Bitcoin - Downtrend reinforced by technicals and macro sentimentHello everyone,
At the moment, Bitcoin is trading cautiously as capital has yet to decisively return to risk assets. Overall market sentiment remains defensive, with investors continuing to assess macroeconomic conditions and monetary policy. As a result, buying pressure has not been strong enough to reverse the prevailing trend.
From a technical perspective , the H4 chart shows that Bitcoin continues to respect a well-defined descending channel . Market structure remains bearish, with a clear sequence of lower highs and lower lows, confirming that selling pressure is still dominant. Recent rebounds have been purely technical in nature and have repeatedly been rejected near the upper boundary of the channel, signaling that buyers lack control.
Notably, the 92,000–94,000 USD area is acting as a key resistance zone. This region aligns with the upper boundary of the descending channel and a prior distribution area, where price has been rejected multiple times. In the current context, each failed attempt to close decisively above this zone reinforces the view that it is a trend-aligned SELL area , rather than a bullish reversal signal.
On the news front , the crypto market continues to be influenced by a broader risk-off environment, with capital favoring safety and liquidity. The absence of strong positive catalysts makes it difficult for Bitcoin to sustain a meaningful breakout. This cautious investor behavior effectively supports the existing bearish structure, as weak and hesitant demand often allows downtrends to persist.
On the downside, the 80,000–82,000 USD region stands out as an important support area. While price has reacted from this zone in the past, within a broader downtrend it should be viewed primarily as a potential profit-taking target , not a safe BUY zone. Attempting to catch the bottom before the bearish structure is broken carries elevated risk and does not align with disciplined trading.
Overall, both technical structure and the current news backdrop point toward a bearish continuation scenario . Until there is a clear shift in market structure or a meaningful improvement in capital flows, the most rational approach remains to sell rallies in line with the trend , rather than trying to predict a bottom.
In conclusion , Bitcoin remains in a controlled downtrend. Only a decisive break above the descending channel, supported by a more favorable news environment, would justify considering a trend reversal. Until then, patience, discipline, and respect for the dominant trend are essential for capital protection and consistent performance.
Wishing you clear judgment, strong risk management, and disciplined trading in line with the primary trend.
USDJPY Breaks Falling Wedge Pattern, Ready to pump!USDJPY ( FX:USDJPY ) has started to climb from its Support lines and Support zone(155.100 JPY-154.120 JPY), showing good momentum in its upward movement.
From a classical technical analysis perspective, it seems that USDJPY has successfully broken the upper lines of the falling wedge pattern on the 1-hour timeframe, which is a positive sign for the continuation of the bullish trend.
From an Elliott Wave perspective, it appears that USDJPY has completed main wave 4 using a Double Three Correction(WXY) within the Support zone(155.100 JPY-154.120 JPY).
Looking ahead, I expect USDJPY to resume its upward movement following a pullback to its Fibonacci levels, potentially rising at least to the 155.94 JPY.
First Target: 155.94 JPY.
Second Target: 156.27 JPY.
Stop Loss(SL): 154.82 JPY.
Please respect each other's ideas and express them politely if you agree or disagree.
📌 U.S. Dollar/Japanese Yen Analyze (USDJPY), 1-hour time frame.
🛑 Always set a Stop Loss(SL) for every position you open.
✅ This is just my idea; I’d love to see your thoughts too!
🔥 If you find it helpful, please BOOST this post and share it with your friends.

Gold - The -50% correction is starting!🎯Gold ( OANDA:XAUUSD ) is starting a -50% correction:
🔎Analysis summary:
For the past 10 years, we have been witnessing an underlying bullrun on Gold. Just like we saw back in 2011, the 10 year bullrun was followed by a correction of -50%. Together with the retest of the ultimate resistance trendline, Gold is now clearly shifting bearish.
📝Levels to watch:
$4,500
SwingTraderPhil
SwingTrading.Simplified. | Investing.Simplified. | #LONGTERMVISION

NQ Range (12-17-25)Not what it seems, have to follow the crumbs of Tricks. On 12/26 NQZ hit KL 24,910 and is now at 25,245 (White Arrow). This is the actual PRICE of NQ, which is under Channel and 200 plus points lower. NDX will gap open higher (and above danger zone), that was the goal today. Knowing the Tricks may help with your next trade, which should be Short (at some point).
NDX Chart
IDS27 Chart

GOLD → Growth may continue after correction...FX:XAUUSD is trading in a sideways range amid mixed signals: weak macro data and concerns about an AI bubble are supporting the metal, but the moderate strengthening of the dollar is limiting its growth...
Fundamental situation
• Weak data from China: industrial production and retail sales showed the lowest growth in several years.
• Mixed data from the US: NFP for November: +64K (better than forecast), but October revised to -105K. Unemployment rose to 4.6%.
• Expectations of Fed policy easing remain, especially against the backdrop of the possible appointment of a new “dovish” chair (Christopher Waller is being considered).
The fundamental backdrop remains favorable for gold, but new triggers are needed to break out of the range. Attention is shifting to US inflation data, which will set the direction before the end of the year.
Technically, gold may test key support before attempting to rise to retest 4335-4350.
Resistance levels: 4335, 4353, 4380
Support levels: 4311, 4300, 4329
The trend is bullish, and the fundamental background is favorable. If the bulls keep the price above 4320-4310 within the current correction, the growth may continue...
Best regards, R. Linda!
