GOLD → Consolidation before continuing growth to 3700 FX:XAUUSD resumed its growth on Friday, approaching the $3,650 level, amid growing expectations of aggressive Fed rate cuts and geopolitical risks. The metal remains near record highs and is poised for a fourth consecutive week of gains.
Key drivers: Probability of a 25 bp rate cut on September 17 — 92%, chance of a 50 bp cut — 8%. Markets are expecting three cuts in 2024. US plans to impose new tariffs on India and China are supporting demand for safe havens.
Gold remains in a bullish trend. The weak US economy and geopolitics are pushing it to new highs, but profit-taking at current levels is possible.
There is no news today, so trading may be relatively calm.
Technically, if the price does not retest 3738 but begins to consolidate near 3657 and attempts a breakout, the chances of continued growth will increase.
Support levels: 3638, 3630
Resistance levels: 3649, 3657
I expect the market to reach the liquidity zone of 3638 before returning to retest the trigger. However, if MM deems this maneuver unnecessary and forms a trading range between 3657 and 3649, then closing above 3657 could lead to another bullish distribution.
Sincerely, R. Linda!
Community ideas

XAUUSDHello Traders! 👋
What are your thoughts on GOLD?
Gold has entered a corrective phase after printing a new high and is currently consolidating within a clearly defined channel.
The price is fluctuating inside this channel and may even test the lower boundary before continuing higher.
As long as gold remains within the channel, sideways to slightly downward movement can be expected in the short term.
A bullish breakout above the channel would likely act as a trigger for the next impulsive move, potentially leading to a new all-time high.
Wait for a confirmed breakout before entering long. Premature entries within the range may face choppy action.
Don’t forget to like and share your thoughts in the comments! ❤️

ETHUSDT → Correction and hunt for liquidity ahead of growth BINANCE:ETHUSD is showing positive dynamics and breaking through the resistance conglomerate (consolidation boundary and downward correction line). The fundamental background is positive, and bulls are generally quite confident...
The cryptocurrency market, Bitcoin, and altcoins are awaiting a batch of positive news. Traders are waiting for interest rates to fall, which could attract additional capital to the cryptocurrency market, especially ETH.
The breakout of the correction resistance and consolidation resistance gives the market hope for growth. The global trend is bullish, and the fundamental background is positive. If the bulls hold their defense above 4488-4450, ETH may strengthen.
Resistance levels: 4661, 4783
Support levels: 4488, 4450
Technically, I expect a false breakdown of support (retest of the liquidity zone). If this maneuver ends with the price closing above 4488 and the formation of a confirming bullish pattern, then in this case, we can consider the continuation of growth.
Sincerely, R. Linda!

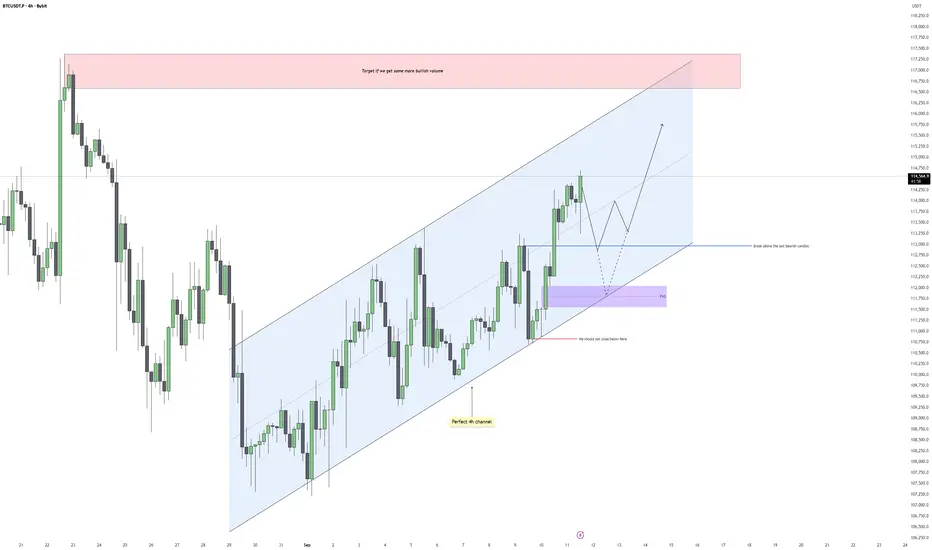
Bitcoin - Clearing the Gaps on the Way to 117kBitcoin continues to respect the ascending channel on the 4H chart, showing steady higher highs and higher lows with clean structure. Price has been climbing with solid bullish momentum, and each retracement so far has been contained within the channel. This gives us a clear framework to track both short-term pullbacks and the next potential leg higher.
Channel Dynamics
The channel is holding perfectly, with both the upper and lower bounds being respected almost to the point. As long as price trades within this structure, the bias remains bullish. A deep pullback into the lower side of the channel would not necessarily invalidate the setup, but we should avoid closing below the last key demand zone if we want to keep the bullish structure intact.
Fair Value Gaps Below
Before continuing higher, Bitcoin may dip back into inefficiencies left behind. A key fair value gap sits below around the 111,700–112,300 region, aligning with prior support. Price filling this gap would be healthy for the structure, giving bulls a better base to push from. If price respects that level, the probability of a continuation toward the channel highs increases significantly.
Bullish and Bearish Scenarios
On the bullish side, if we hold the demand zone and reclaim the blue structure line, price should attempt to sweep short-term highs and extend into the upper channel boundary. A clean break above would open the door to the red supply zone around 117,000–118,000. On the bearish side, any decisive close below the purple fair value gap would shift momentum and put pressure on the lower channel boundary, signaling weakness and invalidating the immediate bullish scenario.
Price Target and Expectations
If the structure continues to play out, I expect Bitcoin to first dip into the imbalance below, find support, then make another leg higher toward 116,500–118,000. This area is a logical liquidity pool where stops above recent highs are clustered, and also aligns with a major supply zone. That zone should be closely monitored for reactions and potential reversals.
Conclusion
Bitcoin remains in a constructive bullish channel, but gaps below need to be addressed before a push into higher liquidity levels. I will be looking for a retracement into the imbalance to set the stage for a continuation higher into the upper red supply zone. As long as we hold above the key demand region, the bullish play remains valid.
___________________________________
Thanks for your support!
If you found this idea helpful or learned something new, drop a like 👍 and leave a comment, I’d love to hear your thoughts! 🚀
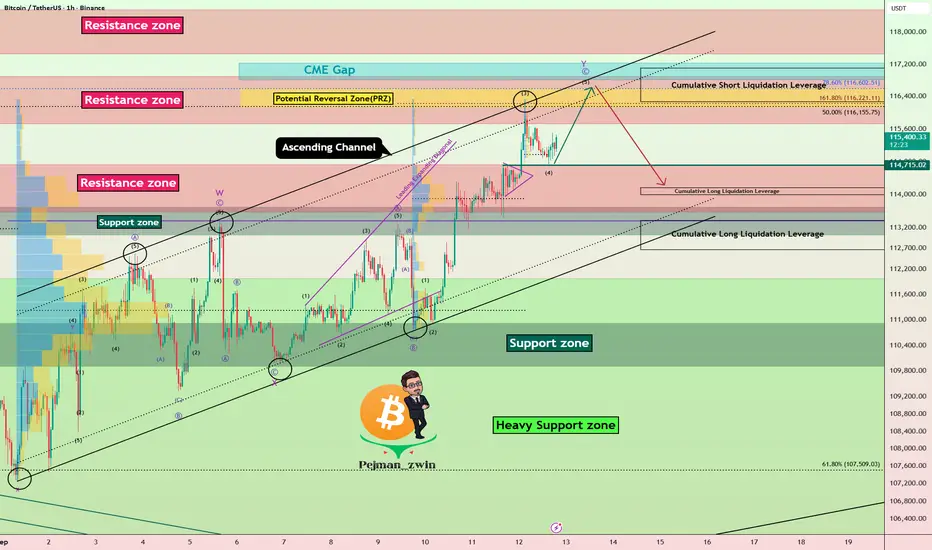
Bitcoin Roadmap | Short termBitcoin ( BINANCE:BTCUSDT ) has been experiencing a lot of volatility over the past 10 days, and the reasons for these movements could be the announcement of US indices + geopolitical issues Those who were in favor of Bitcoin caused Bitcoin to pump .
Bitcoin's movements over the past 10 days have managed to form an Ascending Channel .
In terms of Elliott Wave theory , Bitcoin appears to be completing microwave 5 of microwave C of the main wave Y .
I expect Bitcoin to try to complete main wave Y , and if we find signs of a reversal in the Resistance zone($116,900-$115,730) and Potential Reversal Zone(PRZ) , we can expect a further decline . Also, it is expected that the CME Gap($117,235-$116,820) will eventually be completed in the main wave Y .
Cumulative Long Liquidation Leverage: $114,165-$113,989
Cumulative Long Liquidation Leverage: $113,370-$112,664
Cumulative Short Liquidation Leverage: $117,102-$116,266
Please respect each other's ideas and express them politely if you agree or disagree.
Bitcoin Analysis (BTCUSDT), 1-hour time frame.
Be sure to follow the updated ideas.
Do not forget to put a Stop loss for your positions (For every position you want to open).
Please follow your strategy and updates; this is just my Idea, and I will gladly see your ideas in this post.
Please do not forget the ✅' like '✅ button 🙏😊 & Share it with your friends; thanks, and Trade safe.
Bitcoin - Heading lower after hitting resistance?Introduction
Looking at the current 4-hour Bitcoin chart, we can see that price action is moving into a crucial zone. After a strong upward move, Bitcoin has reached an area of resistance where multiple factors align, making it an important level to watch. The chart highlights fair value gaps (FVGs) both above and below, which are key points that could influence the next move. By analyzing these areas, we can form a clearer idea of the potential short-term trend and what traders might expect in the coming days.
Bearish 4h FVG resistance and liquidity grab
At the moment, price is testing a strong resistance level, which coincides with a 4-hour fair value gap. This area has already absorbed much of the short-side liquidity, meaning that stop losses from traders positioned against the uptrend have been triggered. This liquidity grab often signals exhaustion in the upward move and can serve as the starting point for a retracement. The resistance zone is proving to be difficult to break, and if the market fails to hold above it, we could see a shift in momentum toward the downside.
4h bullish FVG to hold
Just below the current price, there is a 4-hour bullish fair value gap that could act as support in the short term. If buyers step in and defend this area, it may temporarily stabilize the market and create a bounce. However, if this support fails to hold, it would open the path for further downside movement. The chart suggests that a break below this level would likely drive Bitcoin toward the next major target around the $112,000 region. This makes the bullish FVG a key decision point for the market.
Target for the short
If Bitcoin cannot sustain its position above the highlighted resistance zone, the downside target becomes more clear. The lower 4-hour fair value gap, sitting closer to $112,000, is marked as the target for the short. This is where price is likely to be drawn in order to rebalance inefficiencies left behind in the chart. Traders looking for bearish opportunities would see this as the logical area to aim for, as the market often gravitates toward unfilled gaps after liquidity grabs at the top.
Final thoughts
In conclusion, Bitcoin is currently at a critical point. The resistance area combined with the 4-hour FVG has absorbed liquidity, creating the possibility for a downward move. The short-term bullish FVG below is the level to watch, as a break here could confirm bearish continuation toward $112,000. On the other hand, if buyers manage to hold the current support, the structure may remain intact and prevent deeper downside. Overall, the chart suggests that the path of least resistance may now be lower, unless the market proves otherwise by breaking convincingly above resistance.
-------------------------
Thanks for your support. If you enjoyed this analysis, make sure to follow me so you don't miss the next one. And if you found it helpful, feel free to drop a like 👍 and leave a comment 💬, I’d love to hear your thoughts!

Latest Gold Price Update Today👋Hello everyone, what do you think about OANDA:XAUUSD ?
Today, gold continues to trade sideways around the $3,650 mark. The recent surge in new unemployment claims has negatively impacted the US Dollar, allowing XAU/USD to maintain its high position, despite August CPI data coming in slightly higher than analysts’ estimates.
From a technical perspective: The recent highs around $3,655 - $3,657 could serve as key resistance levels, beyond which gold might test its all-time high around $3,675. Additional buying orders could allow XAU/USD to continue its recent breakout and aim for the $3,700 level, especially as the H1 trendline shows signs of breaking.
The support levels to watch are $3,630 - $3,615 , and eventually the psychological $3,600 level. If these hold, short-term buying strategies remain favored. Remember, "The trend is your friend."
What do you think? How will gold move from here? Hit like if you agree with my analysis!
Good luck!

Euro will reach seller zone and then start to fallHello traders, I want share with you my opinion about Euro. The market for the Euro is currently positioned at a critical inflection point, as a prolonged period of consolidation appears to be nearing its resolution. After transitioning from a prior downward channel, the price action for EURUSD has been contained within a large symmetrical triangle, a pattern of contracting volatility. This structure has been defined by a clear descending resistance line and an ascending support line, anchored by the major seller zone and the buyer zone. At present, the asset has rallied from the support line and is now directly testing the upper boundary of this triangle. This area represents a powerful confluence of resistance, where the dynamic trendline meets the horizontal seller zone near the 1.1730 Resistance Level. The primary working hypothesis is a short, rotational scenario, based on the expectation that this resistance will hold. A confirmed rejection from this 1.1730 - 1.1750 area would validate the integrity of the triangle and signal that another major swing to the downside is underway. Therefore, the TP is logically placed at 1.1620 поинтов, a key target located in a high-liquidity area on the path towards the main 1.1575 support level. Please share this idea with your friends and click Boost 🚀

Gold will bounce from support area and continue to riseHello traders, I want share with you my opinion about Bitcoin. The market context for Gold remains firmly bullish, with the price action being guided by a well-established upward channel that has defined the trend for a significant period. The structure of this channel has been confirmed by multiple rotations between its support and resistance lines, originating from the deep buyer zone near the 3390 support level. Currently, after a rejection from the channel's highs, the price of XAU is undergoing a healthy corrective phase. This pullback has brought the asset into a critical confluence of support, defined by the 3630 - 3615 support area and the ascending support line of the channel itself. The primary working hypothesis is a long scenario, which anticipates that buyers will step in to defend this key support cluster. A confirmed bounce from this area would signal the conclusion of the corrective move and the resumption of the dominant upward trend. This would likely initiate the next impulsive wave higher within the channel's structure. Therefore, the TP is logically placed at 3735 points, a target that aligns with the upper resistance line of the channel and represents a new potential structural high. Please share this idea with your friends and click Boost 🚀

The Final Ascent: BTC's $165K Launchpad Before the Great ResetBuckle up. This isn't just another chart; it's the roadmap for the most critical phase of Bitcoin's current cycle. We're witnessing the final act of a masterpiece play out right now, and understanding this structure is the key to navigating what comes next.
Here’s the brutal, beautiful truth laid out by the tape:
The Setup: From Compression to Ignition
Remember the agonizingly long consolidation? That was the massive Falling Wedge throughout 2022 and early 2023. It was a pressure cooker, squeezing out weak hands and building immense energy. The major breakout from that Falling Wedge was the spark. It wasn't just a rally; it was the official signal that the bull market was back on. That breakout launched us into the next, more powerful pattern the Rising Wedge.
The Current Play: The Rising Wedge Journey
We are now deep inside this ascending channel. Each higher high and each higher low is creating this converging pattern a classic Rising Wedge. This is the market's way of climbing a wall of worry on a wave of increasing optimism and liquidity. But make no mistake, this structure is inherently bullish yet exhausting. It's the final leg up, the last major push to suck in every last bit of momentum before the fuel runs out.
The Target: The Cycle Peak
The geometry of this wedge is pointing to a final, spectacular blow-off top. The most probable target for the peak of this wedge is $165,000. I wouldn't be surprised to see a slight extension in the euphoria that could tag $170,000, but that's the ceiling. Based on the rhythm of this move, the clock is ticking towards a November 2025 finale. Mark it.
The Inevitable: The Great Bear & The Golden Accumulation Zone
This is the most critical part. A Rising Wedge resolution is almost always the same: a violent breakdown. The fallout from this peak will be brutal a proper crypto winter. It will shake out every over leveraged dreamer. This bear market will find its ultimate bottom, its point of maximum financial opportunity, in the $54,000 - $60,000 zone. That is not a typo. That will be the generational buying opportunity. The mother of all dips. ACCUMULATE THERE.
The Next Chapter: The $500K Horizon
That 2027 bottom won't be the end. It will be the foundation for the next cycle. The recovery from that $60k zone will be the start of Bitcoin's next, truly historic run towards a target that seems crazy today $500,000. This isn't hopium; it's the logical progression of the four year cycle, adoption curves, and the patterns that have always governed this market.
The Bottom Line:
We are in the final, parabolic stage. Target $165K+ by Nov 2025. Then, prepare for the storm. The real-life changing wealth won't be made at the top; it will be made by those with the courage and dry powder to buy relentlessly in the $54k-$60k pit of despair in 2027.
This is the plan. Trade accordingly.

Ethereum - The $15.000 price target!🚀Ethereum ( CRYPTO:ETHUSD ) will break out now:
🔎Analysis summary:
Looking at the higher timeframe, it is obvious that Ethereum has been consolidating for the past four years. But now, Ethereum is starting to break above the previous all time high. If Ethereum actually confirms the breakout, we are talking about an expected move of another decent +250%.
📝Levels to watch:
$15.000, $4.000
SwingTraderPhil
SwingTrading.Simplified. | Investing.Simplified. | #LONGTERMVISION

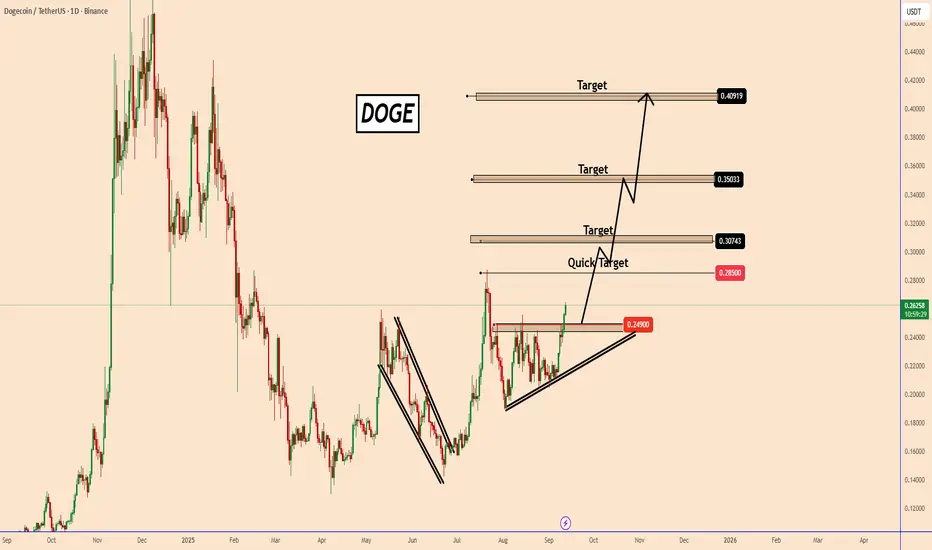
DOGE : From Accumulation to AccelerationDOGE : From Accumulation to Acceleration
On the daily chart, DOGE looks ready to rise further.
The price recently completed a bullish pattern and broke above a key resistance zone at 0.2490.
If it stays above this level, it confirms the breakout’s strength, especially since the price had been consolidating there for a while.
Short-term target: 0.2850
Next levels to watch: 0.3070, 0.3500, and 0.4090
You may find more details in the chart!
Thank you and Good Luck!
❤️PS: Please support with a like or comment if you find this analysis useful for your trading day❤️
GBP /JPY setupThis chart analysis for GBP/JPY (30m timeframe) shows a bullish setup:
Price has been moving within an ascending channel.
A limit buy trade is planned around 199.975, with a stop loss placed below at 199.373, protecting against downside risk.
The projection targets the 200.861 and 201.631 levels, marking the target zone for profit-taking.
The setup suggests anticipation of continued upward momentum, with price expected to break above the channel and reach higher resistance levels.
This is a structured long trade plan with clear entry, stop loss, and target levels.

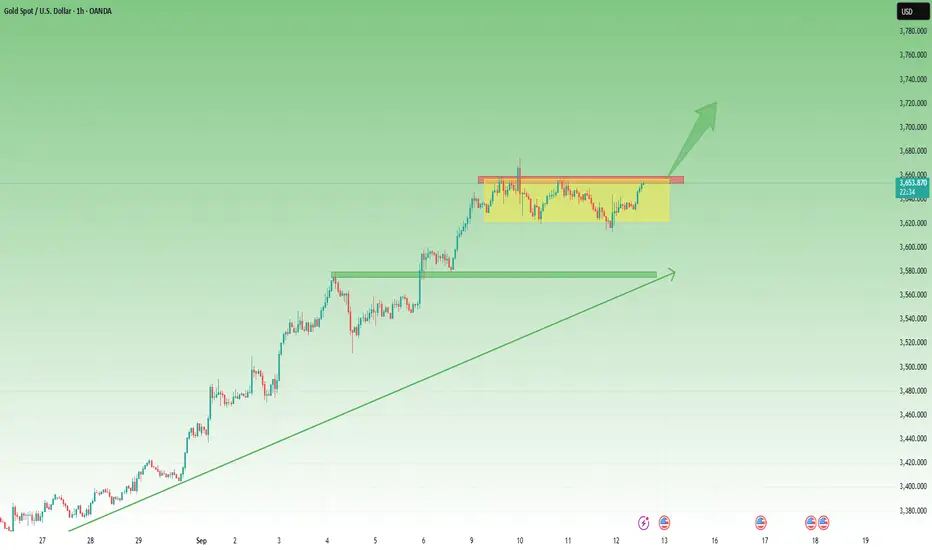
Gold Analysis – Is the Correction Over?Yesterday I maintained my bias that OANDA:XAUUSD correction could extend lower, with 3570 as the focus for the next swing low. I even sold rallies above 3640 zone with that scenario in mind.
However, after the CPI release, Gold dipped to 3620 zone but quickly recovered. That prompted me to lock in a modest 100 pips gain rather than fight the market.
A wise move in hindsight, since Gold is now back testing the 3650+ resistance zone.
So, is the correction finished?
➡️ Most probably, yes.
Here’s why:
• Bulls are defending the 3620 zone, stepping in strongly on dips.
• The chart is shaping into a rectangle, typically a continuation pattern, which suggests consolidation before trend resumption.
• Momentum is aligning again with the broader bullish trend.
Trading Plan:
• As long as 3620 holds, my strategy shifts to buying dips instead of selling rallies.
• A break above 3660 would open the path for continuation, with 3700 as the next bullish milestone.
The market has spoken – the correction seems to be losing steam, and the trend is ready to reassert itself. 🚀
Lingrid | GOLD Correction Phase - Momentum Cooling Off ?OANDA:XAUUSD has reached the resistance zone near 3,650, stalling after a strong bullish run within the upward channel. The chart shows a clear top formation, with sellers defending this area and hinting at a potential corrective move. If gold fails to break and hold above 3,650, price could retrace toward 3,546 as the next key support. The overall structure still favors bulls in the longer term, but near-term momentum points to a pullback phase. Consolidation here may also depend on upcoming economic data.
💡 Risks:
A weaker-than-expected US CPI or labor data release could reignite strong buying and push gold beyond 3,650.
Geopolitical tensions may drive safe-haven demand, supporting further upside despite technical rejection.
A dovish Fed shift could restore bullish flows, reducing the likelihood of a sustained correction.
If this idea resonates with you or you have your own opinion, traders, hit the comments. I’m excited to read your thoughts!

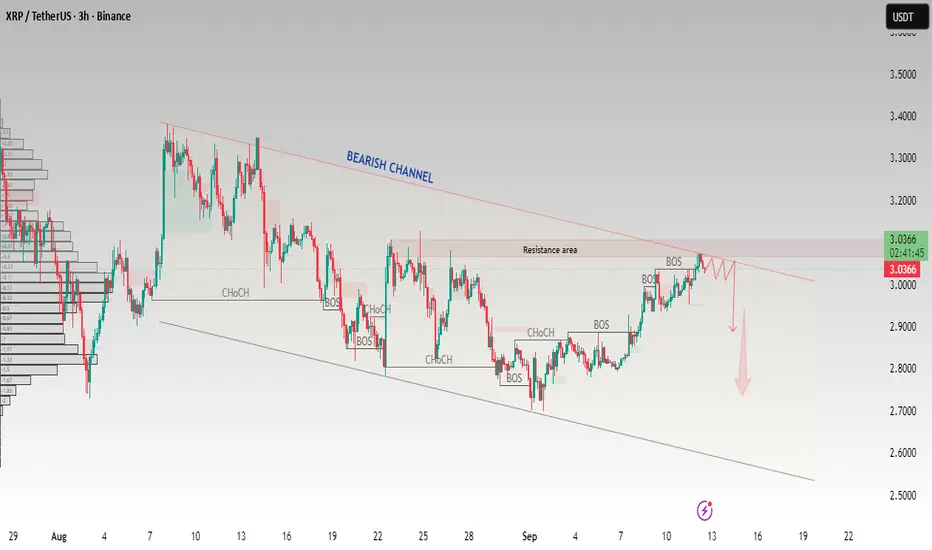
XRP/USDT – Testing Resistance Inside Bearish ChannelXRP is trading within a clear bearish channel and has reached the resistance area near 3.05 – 3.10. Price is showing rejection signs from the upper boundary of the channel, which may trigger a downside move if sellers hold control.
Key Points:
Bearish channel structure in play
Resistance zone: 3.05 – 3.10
Potential rejection at channel top
Downside target zones: 2.90 and below
This setup favors bears as long as XRP remains below the channel resistance. A confirmed breakout above resistance would invalidate the bearish view.
This analysis is for educational purposes only and does not constitute financial advice. Trading cryptocurrencies carries high risk; please trade responsibly and use proper risk management
GOLD ROUTE MAP UPDATEHey Everyone,
This is the 1H chart route map we tracked this week and it played out beautifully once again.
We got the expected play between 3613 and 3638, followed by a break above 3638 which re-opened the range to the upside. That move gave the strong push up we were looking for, just short of 3658.
Importantly, 3638 flipped into support and continued to provide precision bounces exactly in line with our dip-buying plans. A great finish to the week and a clear demonstration of how our levels consistently deliver structure and tradeable opportunities.
To recap:
3613 → 3638 gave the initial range.
The break and hold above 3638 confirmed upside continuation.
Price pushed toward 3658, with dips to 3638 giving repeated buy opportunities.
We will now come back Sunday with a full multi timeframe analysis to prepare for next week’s setups, including updated views on the higher timeframes, EMA5 alignments, and structure expectations going forward.
Thanks again for all your likes, comments, and follows.
Wishing you all a fantastic weekend!!
Mr Gold
GoldViewFX

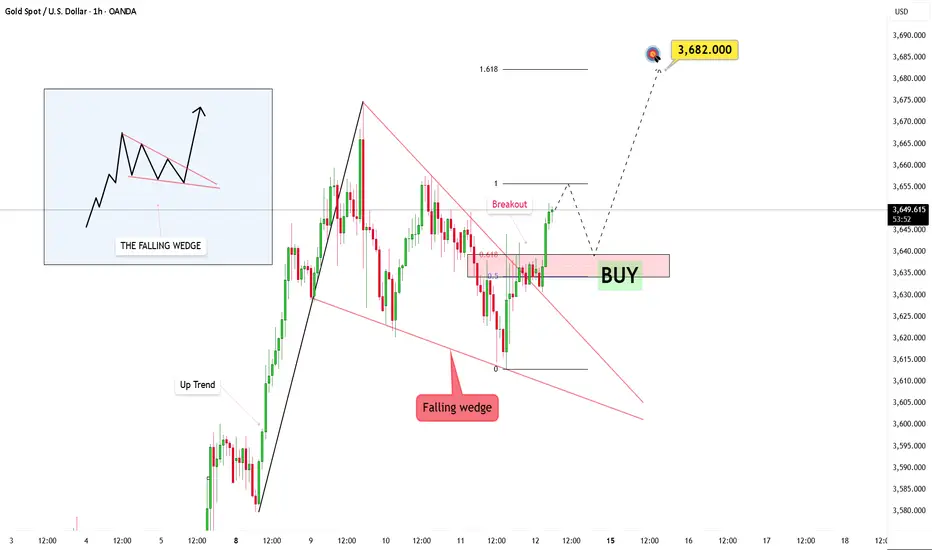
Gold Analysis: Falling Wedge Breakout and Bullish ForecastOANDA:XAUUSD The market is clearly forming a falling wedge, and recent price action suggests a potential shift is on the horizon. Price has begun breaking through this downward structure, which could be the early signs of a strong bullish move.
I’m waiting for the price to retrace back to the broken trendline. This will act as a confirmation, filtering out any false moves, while a retest of the structure will solidify the validity of the breakout. From here, my target is 3682.
The key now is to watch the pullback. If the market returns to the trendline with rising volume, it will add weight to the bullish case.
This trendline breakout is more than just a signal – it’s a story in the making. It represents a shift, and with the right volume, structure, and timing, this could be the start of a larger bullish phase.
Gold 30Min Engaged ( Bullish reversal Entry Detected )Time Frame: 30-Minute Warfare
Entry Protocol: Only after volume-verified breakout
🩸Bullish Reversal : 3645
➗ Hanzo Protocol: Volume-Tiered Entry Authority
➕ Zone Activated: Dynamic market pressure detected.
The level isn’t just price — it’s a memory of where they moved size.
Volume is rising beneath the surface — not noise, but preparation.
🔥 Tactical Note:
We wait for the energy signature — when volume betrays intention.
The trap gets set. The weak follow. We execute.
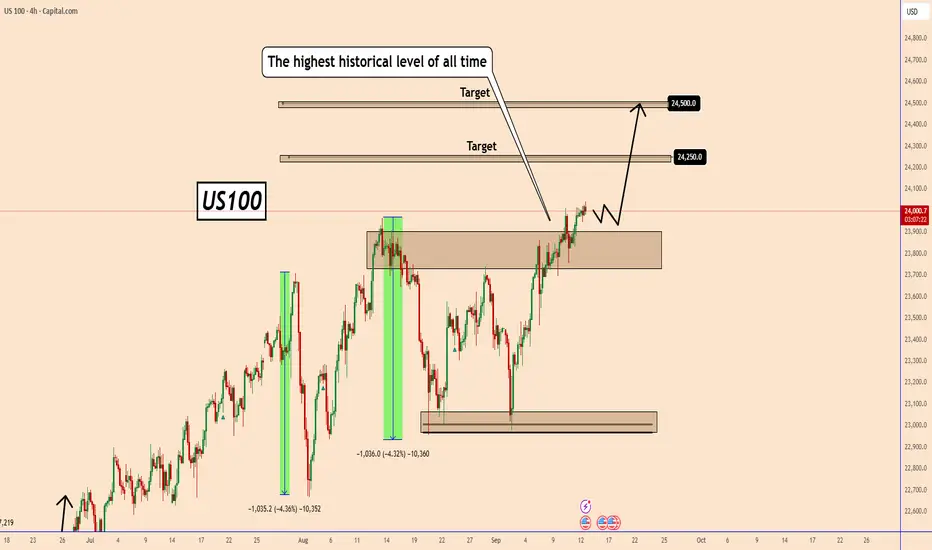
US100 Hits All-Time HighUS100 Hits All-Time High
Yesterday, US100 reached a new record high at 24040, confirming the strength of its bullish trend.
With U.S. inflation cooling, the market is now expecting the Federal Reserve to cut interest rates, possibly starting this cycle and continuing in the months ahead.
Lower rates tend to support stocks and indices, giving the economy room to breathe after a long period of tight monetary policy.
I expect US100 to continue rising toward 24500, with intermediate targets at 24250 and 24500 in the coming week.
You may find more details in the chart!
Thank you and Good Luck!
❤️PS: Please support with a like or comment if you find this analysis useful for your trading day❤️
Bitcoin will reach resistance line of channel and then dropHello traders, I want share with you my opinion about Bitcoin. The current market structure for Bitcoin is defined by a well-established upward channel that was formed after the price broke out of a prior triangle consolidation. This bullish pattern has been guiding the price action of BTC higher through a clear sequence of higher highs and higher lows between its dynamic support and resistance lines. The market has just completed another full upward rotation within this structure and is now positioned at a critical inflection point. Currently, the price is directly testing the upper boundary of the channel, which forms a powerful confluence of resistance with the horizontal 113500 - 114000 seller zone. This area has historically been a strong barrier where price has reversed on previous occasions. The primary working hypothesis is a short, rotational scenario, based on the expectation that sellers will once again defend this significant resistance confluence. A confirmed rejection from this seller zone would validate the integrity of the upward channel and likely initiate a new corrective swing to the downside, which would first need to break the current support level at 113500. Therefore, the TP is logically placed at 112400 points, a target that aligns perfectly with the ascending support line of the channel. Please share this idea with your friends and click Boost 🚀

BTC Breaks Resistance: Eyes on 123KBTC Breaks Resistance: Eyes on 123K
Bitcoin continues its upward momentum, hitting our first target as expected.
Following the release of U.S. PPI data yesterday, BTC broke through the key resistance zone at 113,200—opening the path for further gains.
If the price holds steady at current levels, we could see more upside ahead.
Next key targets: 📍 117K 📍 120K 📍 123K
You may find more details in the chart!
Thank you and Good Luck!
❤️PS: Please support with a like or comment if you find this analysis useful for your trading day❤️

PPI Shock Pushes Bitcoin Higher – Fake Pump Before Drop?Bitcoin ( BINANCE:BTCUSDT ) has been making high momentum Sharpe moves over the last few days , which has made it a little difficult to trade, which is why I am still sticking to my previous analysis , and this analysis is an update of targets and even new entry points .
Bitcoin is currently moving near the Resistance zone($114,720-$113,580) , Reversal Zone(PRZ) , Cumulative Short Liquidation Leverage($114,510-$113,771) , Monthly Pivot Point , and Resistance lines = a set of Resistances
A few minutes ago, the US Core PPI m/m and PPI m/m data were released, which triggered a pump in Bitcoin . In my view, we should wait for Bitcoin to digest this shock and then continue its real trend .
Do you agree with me?
In terms of Elliott Wave theory , it seems that Bitcoin has completed microwave 5 of microwave C of the main wave Y , and we can expect a downtrend .
I expect Bitcoin to drop again to at least $111,600(First Target) .
Second Target: $110,883
Third Target: $110,000 and more dumps.
Stop Loss(SL): $114,923(Worst)
CME Gap: $117,235-$113,800
Cumulative Long Liquidation Leverage: $110,822-$109,752
Note: Be sure to follow capital management and do not take risks.
Please respect each other's ideas and express them politely if you agree or disagree.
Bitcoin Analysis (BTCUSDT), 1-hour time frame.
Be sure to follow the updated ideas.
Do not forget to put a Stop loss for your positions (For every position you want to open).
Please follow your strategy and updates; this is just my Idea, and I will gladly see your ideas in this post.
Please do not forget the ✅' like '✅ button 🙏😊 & Share it with your friends; thanks, and Trade safe.
