Global Trade in the Modern MarketStructure, Dynamics, and Strategic Importance
Global trade in the modern market represents one of the most powerful engines of economic growth, innovation, and international interdependence. Unlike earlier eras—when trade was limited by geography, slow transportation, and fragmented information—today’s global trade ecosystem operates at high speed, across digital platforms, and through deeply integrated supply chains. Goods, services, capital, data, and technology now move across borders with unprecedented scale and complexity, reshaping how nations compete and collaborate.
1. Evolution of Global Trade
Modern global trade has evolved from simple bilateral exchange into a sophisticated, multi-layered network. Containerization revolutionized logistics, reducing costs and transit times. The rise of multinational corporations (MNCs) fragmented production into global value chains (GVCs), where design, manufacturing, assembly, and marketing occur in different countries. Digitalization further transformed trade by enabling real-time coordination, e-commerce, and cross-border services that require no physical shipment at all.
2. Key Drivers of Modern Global Trade
Several forces define today’s trading environment:
Technology and Digital Platforms: Cloud computing, AI, and data analytics optimize inventory, pricing, and demand forecasting. Digital marketplaces allow even small firms to access global customers.
Trade Liberalization: Free trade agreements (FTAs) and regional blocs reduce tariffs, harmonize standards, and encourage cross-border investment.
Capital Mobility: Global finance supports trade through credit, hedging instruments, and risk management tools such as futures, options, and insurance.
Consumer Demand: Rising incomes in emerging markets fuel demand for diverse products, while developed markets seek cost efficiency and innovation.
3. Structure of Global Trade Flows
Modern trade flows extend beyond physical goods:
Merchandise Trade: Includes commodities (energy, metals, agriculture) and manufactured goods (electronics, automobiles, machinery).
Services Trade: Finance, IT services, logistics, consulting, tourism, and digital services are growing faster than goods trade.
Intellectual Property and Data: Licensing, software, patents, and data flows are now critical trade assets.
Capital and Investment: Foreign direct investment (FDI) supports production hubs and market access.
4. Role of Global Value Chains (GVCs)
Global value chains are the backbone of modern trade. A single product—such as a smartphone—may involve raw materials from Africa, components from East Asia, design from the US or Europe, and assembly in Southeast Asia. This specialization increases efficiency but also creates vulnerability. Disruptions like pandemics, geopolitical tensions, or natural disasters can ripple across the entire chain, forcing firms to rethink resilience and diversification.
5. Emerging Markets and Trade Power Shifts
The modern trade landscape reflects a gradual shift from a unipolar system to a multipolar one. Emerging economies—particularly in Asia, Latin America, and parts of Africa—are no longer just low-cost manufacturers. They are becoming:
Major consumer markets
Innovation hubs
Strategic suppliers of critical resources
Countries like China, India, Vietnam, and Mexico play increasingly central roles in global production and trade negotiations, influencing pricing, standards, and supply-chain strategies.
6. Geopolitics and Trade Policy
Trade today is inseparable from geopolitics. Tariffs, sanctions, export controls, and industrial policies are used as strategic tools. Governments prioritize:
Economic security (semiconductors, energy, food)
Supply-chain sovereignty
Strategic alliances and friend-shoring
This has led to partial de-globalization or “re-globalization,” where trade is restructured around trusted partners rather than purely cost-based efficiency.
7. Financial Markets and Trade Integration
Modern trade is closely linked with global financial markets:
Foreign Exchange (FX): Currency movements directly impact trade competitiveness and profitability.
Derivatives: Futures and options help exporters and importers hedge price and currency risks.
Trade Finance: Letters of credit, guarantees, and supply-chain finance enable liquidity and trust across borders.
This integration allows trade to scale rapidly but also exposes it to financial volatility and capital flow reversals.
8. Sustainability and ESG in Global Trade
Environmental, Social, and Governance (ESG) considerations are reshaping trade decisions. Companies and governments now factor in:
Carbon footprints and green logistics
Ethical sourcing and labor standards
Circular economy principles
Carbon border taxes, sustainability-linked financing, and green trade corridors are emerging as defining features of modern global commerce.
9. Digital Trade and the Future of Commerce
Digital trade is one of the fastest-growing segments:
Cross-border e-commerce platforms connect sellers and buyers directly.
Digital payments and blockchain improve transparency and settlement.
Services like cloud computing, online education, and remote work are traded globally without physical borders.
Regulation of data flows, cybersecurity, and digital taxation will heavily influence the next phase of global trade.
10. Risks and Challenges in the Modern Trade System
Despite its scale and efficiency, modern global trade faces key challenges:
Supply-chain disruptions
Trade wars and protectionism
Currency volatility
Regulatory fragmentation
Climate-related risks
Managing these risks requires diversification, strategic inventory management, and advanced risk-hedging tools.
11. Strategic Importance of Global Trade
Global trade is more than economic exchange—it is a strategic asset. It shapes:
National growth and employment
Corporate profitability and competitiveness
Innovation diffusion
Global political influence
Countries that master trade logistics, financial integration, and technological adoption gain long-term strategic advantages.
Conclusion
Global trade in the modern market is a complex, fast-moving, and deeply interconnected system. It blends physical goods, digital services, finance, and geopolitics into a single global framework. While efficiency and scale have reached historic highs, resilience, sustainability, and strategic alignment are now equally important. The future of global trade will not be defined solely by how cheaply goods move across borders, but by how intelligently, securely, and sustainably global markets are connected.
Community ideas
Trading Global Indices: Opportunities, Strategies, and RisksUnderstanding Global Indices
A global index is a benchmark that tracks the performance of a group of stocks representing a specific market. Examples include the S&P 500 in the United States, the FTSE 100 in the United Kingdom, the DAX 40 in Germany, the Nikkei 225 in Japan, and the Nifty 50 in India. There are also broader indices such as the MSCI World Index or MSCI Emerging Markets Index, which capture performance across multiple countries.
These indices are usually weighted by market capitalization, meaning larger companies have a greater impact on index movement. When traders buy or sell an index, they are effectively trading the overall direction of that economy or market rather than betting on the success or failure of a single firm.
Why Traders Choose Global Index Trading
One of the biggest advantages of trading global indices is diversification. Since an index contains many stocks, the risk associated with one company’s poor performance is reduced. This makes indices relatively more stable compared to individual equities, especially during periods of company-specific volatility.
Another major reason is liquidity. Popular indices such as the S&P 500, Dow Jones, Nasdaq, and DAX are among the most liquid instruments in the world. High liquidity ensures tight spreads, efficient price discovery, and smooth execution, which is particularly attractive for intraday traders and institutional participants.
Global indices are also highly responsive to macroeconomic events. Interest rate decisions, inflation data, employment numbers, geopolitical developments, and central bank policies all influence index movement. For traders who enjoy macro-driven strategies, indices offer a direct way to express views on economic growth or slowdown.
Instruments Used to Trade Global Indices
Traders can access global indices through multiple instruments. Index futures are widely used by professional traders and institutions, offering leverage and standardized contracts traded on regulated exchanges. Index options provide strategies for hedging, income generation, and volatility trading.
For retail traders, contracts for difference (CFDs) and exchange-traded funds (ETFs) are common choices. CFDs allow traders to speculate on price movements without owning the underlying asset, while ETFs provide a simpler way to invest in an index through the stock market. Each instrument has its own cost structure, risk profile, and suitability depending on the trader’s objectives.
Key Drivers of Global Index Movements
Global indices are influenced by a combination of economic, political, and psychological factors. Monetary policy is one of the most important drivers. Interest rate hikes or cuts by central banks such as the Federal Reserve, ECB, or RBI directly impact equity valuations and index trends.
Economic data releases like GDP growth, inflation, manufacturing indices, and employment reports often cause sharp short-term moves. Strong data typically supports bullish sentiment, while weak data can trigger sell-offs.
Corporate earnings also play a significant role. Since indices are composed of major companies, quarterly earnings seasons often bring increased volatility. Strong earnings across sectors can lift an index, while widespread disappointments can drag it down.
Geopolitical events, trade policies, wars, sanctions, and global crises can lead to risk-off or risk-on behavior across global indices. In times of uncertainty, capital often flows out of equities into safe-haven assets, putting pressure on indices worldwide.
Trading Strategies for Global Indices
Index trading supports a wide range of strategies. Trend-following is one of the most common approaches, as indices often move in sustained trends driven by economic cycles. Traders use moving averages, trendlines, and momentum indicators to capture these moves.
Range trading is effective during periods of consolidation, when indices move between well-defined support and resistance levels. Breakout strategies are popular around major economic announcements, where indices can move sharply once key levels are breached.
Swing trading focuses on capturing medium-term moves over days or weeks, often based on technical patterns combined with macro themes. Long-term investors, on the other hand, use indices to participate in economic growth over years, benefiting from compounding and reinvested dividends.
Risk Management in Index Trading
Despite their diversification benefits, global indices are not risk-free. Market-wide crashes, such as those seen during financial crises or pandemics, can cause rapid and deep declines. Proper risk management is therefore essential.
Using stop-loss orders, controlling position size, and avoiding excessive leverage are fundamental principles. Traders should also be aware of correlation risk, as global indices often move together during periods of stress, reducing the benefits of diversification across regions.
Understanding trading hours is another key aspect. Different indices are most active during their local market sessions, and volatility can spike when major markets overlap.
Role of Global Indices in a Trading Portfolio
Global indices play a crucial role in portfolio construction. They can be used as core holdings to represent equity exposure, while other instruments such as commodities, bonds, or currencies are added for balance. Active traders use indices to hedge exposure in individual stocks or sectors, especially during uncertain market conditions.
For Indian traders, global indices also provide international exposure beyond domestic markets. Movements in the US or European indices often influence Asian markets, making global index analysis valuable even for local trading decisions.
Conclusion
Trading global indices offers a powerful way to participate in the world’s financial markets with diversification, liquidity, and strong macroeconomic relevance. Whether used for short-term trading, swing strategies, or long-term investment, indices reflect the collective behavior of economies and investors worldwide. Success in global index trading depends on understanding economic drivers, choosing the right instruments, applying disciplined strategies, and managing risk effectively. In an increasingly interconnected world, mastering global index trading is an essential skill for modern market participants.

AN030: Sydney Attack, Chile, and Safe-Haven Currencies
This week, currency markets were impacted by a combination of global geopolitical and political events that generated volatility in major forex crosses. We delve into the main news and their impact on market movements.
Sydney Massacre – Geopolitical Shock and Adverse Sentiment for Risk Assets
In the past few hours, a serious mass attack hit Bondi Beach, Sydney, causing numerous casualties and shocking global markets. Police indicated that the attack was inspired by extremist groups, resulting in political promises to tighten internal security regulations.
AP News
Impact on Markets and Forex:
Dominant Risk-Off: Investors tend to reduce exposure to riskier assets; flows into the USD, JPY, and CHF as safe havens could strengthen.
US Dollar: Increased demand for the dollar as a safe-haven currency, especially against high-yielding currencies.
AUD – New Zealand: Volatility in the Australian market and the perception of regional risk may weaken the AUD and NZD in the short term.
Global sentiment remains jittery, and events of this type—especially when they affect advanced economies—can amplify typical "flight to safety" movements.
Chile Presidential Election – Conservative Victory and Market Reaction
Chile elected José Antonio Kast as its new president with approximately 58% of the vote, defeating left-wing challenger Jeannette Jara. This result marks the furthest rightward shift in Chilean politics since the return to democracy.
What's Changed in the Market:
Chilean Peso (CLP): It saw immediate strength against the US dollar, suggesting that investors see Kast's victory as a potential economic boost and greater macroeconomic stability.
Yahoo Finance
Latin American Emerging Market Currencies: Positive contagion effect on currencies such as the MXN and BRL, given the pro-market and legal certainty-oriented tone among investors.
Commodity-linked FX: Chile is a major exporter of copper and lithium; its more favorable policy for private investment could support commodity prices and, indirectly, the currencies of producing countries.
Investors perceive Kast's victory as a signal of potential economic reformism and a stronger alliance with the United States and Western markets, reducing perceived political risk in the region and supporting capital flows into Chilean and regional assets.
Global risk themes and market cross-reactions
Beyond specific events:
Geopolitical tensions persist in other regions (Middle East, Ukraine/Russia), which continue to influence currency prices with risk-aversion movements.
Macroeconomic data from the US and Europe this week will be crucial for confirming the recent strengthening of the USD and influencing interest rate expectations.
Short-term technical drivers:
A slightly higher Volatility Indicator (VIX) reflects increased uncertainty.
Flows into safe-haven currencies (USD/JPY, USD/CHF) show intraday breakouts during times of geopolitical stress.
Correlation between copper prices and emerging market currencies reinforces the positive carry trade narrative on MXN and CLP.

Global Hard Commodity Trading: The Backbone of the World EconomyUnderstanding Hard Commodities
Hard commodities are primarily divided into two broad categories: energy commodities and metals. Energy commodities include crude oil, natural gas, coal, and increasingly uranium, which are essential for transportation, electricity generation, and industrial processes. Metals are further classified into base metals (such as copper, aluminum, zinc, nickel, and iron ore) used in construction and manufacturing, and precious metals (such as gold, silver, platinum, and palladium) which serve both industrial purposes and as stores of value.
The supply of hard commodities depends on geological availability, mining and extraction technology, environmental regulations, and political stability in producing regions. Demand, on the other hand, is driven by economic growth, urbanization, industrialization, energy consumption patterns, and technological change. Because both supply and demand are relatively inelastic in the short term, prices can be highly volatile.
How Global Hard Commodity Trading Works
Global hard commodity trading involves the buying and selling of physical commodities as well as financial instruments linked to those commodities. Physical trading includes long-term contracts between producers and consumers, spot market transactions, and shipping logistics. Financial trading takes place through futures, options, swaps, and other derivatives on major commodity exchanges.
Key global exchanges include the London Metal Exchange (LME) for base metals, COMEX and NYMEX in the United States for metals and energy, ICE for crude oil and gas, and regional exchanges in Asia such as the Shanghai Futures Exchange. These platforms provide price discovery, transparency, and risk management tools for market participants.
Traders range from large commodity trading houses to banks, hedge funds, producers, consumers, and even governments. Commodity trading firms act as intermediaries, managing logistics, financing, storage, and price risk. Financial participants often do not take physical delivery but trade contracts to profit from price movements or hedge exposure.
Role of Supply Chains and Logistics
Logistics play a central role in hard commodity trading. Unlike financial assets, hard commodities must be transported, stored, and insured. Crude oil moves through pipelines, tankers, and storage terminals; metals are shipped in bulk carriers and stored in warehouses; coal travels from mines to power plants via rail and ports.
Any disruption in logistics—such as port congestion, shipping shortages, pipeline shutdowns, or geopolitical conflicts—can significantly affect prices. For example, a blockade in a key shipping route or sanctions on a major exporter can tighten supply overnight, triggering sharp price spikes in global markets.
Price Drivers and Market Cycles
Hard commodity prices are influenced by a complex mix of factors. Economic growth is one of the most important drivers: when global growth accelerates, demand for energy and industrial metals rises; during recessions, demand falls sharply. Inflation expectations also play a role, especially for precious metals like gold, which are often used as hedges against currency depreciation.
Geopolitics is another powerful force. Many hard commodities are concentrated in specific regions—oil in the Middle East, gas in Russia and the US, metals in Africa, Australia, and South America. Political instability, wars, sanctions, and trade disputes can all disrupt supply and reshape trade flows.
Currency movements, particularly the US dollar, strongly influence commodity prices. Since most hard commodities are priced in dollars, a weaker dollar generally supports higher commodity prices, while a stronger dollar can suppress demand and prices.
Hard commodities also move in long-term cycles known as commodity supercycles. These occur when prolonged periods of strong demand, often driven by structural changes like industrialization or energy transitions, push prices higher for many years before new supply eventually catches up.
Risk Management and Hedging
Because of high price volatility, risk management is essential in hard commodity trading. Producers hedge to lock in future prices and protect revenues, while consumers hedge to stabilize costs. Futures and options allow market participants to manage price risk, interest rate exposure, and currency risk.
Traders also manage operational risks such as transportation delays, quality variations, counterparty defaults, and regulatory changes. Effective risk management combines financial hedging with strong operational controls and market intelligence.
Environmental, Social, and Regulatory Factors
In recent years, environmental and social considerations have become increasingly important in global hard commodity trading. Mining and energy extraction face stricter environmental regulations, higher compliance costs, and growing scrutiny from investors and governments. Carbon emissions policies, carbon pricing, and the global push toward renewable energy are reshaping demand for traditional energy commodities while boosting demand for metals used in clean technologies, such as copper, lithium, nickel, and cobalt.
Regulation also plays a major role in shaping markets. Governments regulate extraction rights, export policies, taxes, and trading activities. Sanctions, tariffs, and trade agreements can rapidly alter global supply-demand balances and trading routes.
The Future of Global Hard Commodity Trading
The future of global hard commodity trading will be shaped by energy transition, technological innovation, and geopolitical realignment. While fossil fuels will remain important for decades, the shift toward renewable energy and electric vehicles is changing the composition of commodity demand. Metals critical for batteries, power grids, and renewable infrastructure are likely to see sustained growth.
Digitalization is also transforming commodity trading. Advanced analytics, real-time data, blockchain-based tracking, and automated trading systems are improving efficiency, transparency, and risk management. However, the core fundamentals—physical supply, demand, and logistics—will continue to dominate price behavior.
Conclusion
Global hard commodity trading is far more than just buying and selling raw materials; it is the engine that powers industries, cities, and entire economies. It links mines, oil fields, factories, financial markets, and consumers across the world. Driven by economic growth, shaped by geopolitics, and influenced by long-term structural trends, hard commodity trading remains one of the most complex and strategically important areas of global commerce. Understanding its dynamics is essential for anyone seeking to grasp how the global economy truly functions.

Spot Forex Secrets: The Core of the Global Currency Market1. What Spot Forex Really Means
The word spot refers to transactions settled “on the spot,” usually within two business days. In practice, most retail traders never take delivery of currencies; they speculate on price movements. The spot forex market is decentralized, meaning there is no single exchange. Prices are derived from a network of global banks, financial institutions, and liquidity providers. This decentralization creates deep liquidity, tight spreads, and fast execution—key advantages that attract traders worldwide.
2. Liquidity: The Hidden Advantage
One of the biggest secrets of spot forex is liquidity. Major currency pairs like EUR/USD, USD/JPY, and GBP/USD trade in enormous volumes. High liquidity reduces slippage, allows smooth entry and exit, and makes technical analysis more reliable. Many professional traders focus only on highly liquid pairs because price behavior tends to respect levels, trends, and patterns better than thinly traded markets.
3. The Power of Currency Pair Dynamics
Spot forex trading is unique because every trade involves two economies. A currency pair is not just a price chart—it reflects interest rates, inflation, employment data, political stability, and central bank policy from both countries. Successful traders understand relative strength: a strong currency paired against a weak one often produces clearer, more sustained trends.
For example, if one central bank is raising interest rates while another is cutting, the interest rate differential becomes a powerful driver of spot prices. This macro awareness gives traders an edge beyond simple chart reading.
4. Time Zones and Market Sessions
Another lesser-known secret is the importance of trading sessions. The forex market follows the sun—from Sydney to Tokyo, London, and New York. Each session has its own characteristics:
Asian Session: Often slower, range-bound, dominated by JPY and AUD pairs.
London Session: High volatility and volume; trends often begin here.
New York Session: Strong momentum, especially during overlap with London.
Professional traders align their strategies with session behavior. Breakout traders prefer London opens, while range traders may thrive in Asian hours.
5. Price Action Over Indicators
Many beginners overload charts with indicators. Seasoned spot forex traders, however, rely heavily on price action. Candlestick patterns, support and resistance, trend structure, and market context often provide clearer signals than lagging indicators.
Indicators can help confirm momentum or volatility, but price itself tells the real story. The “secret” is learning to read what the market is doing, not what an indicator says it already did.
6. Leverage: A Double-Edged Sword
Leverage is both the greatest attraction and the greatest danger in spot forex. It allows traders to control large positions with small capital, amplifying profits—but also losses. The secret here is not avoiding leverage, but respecting it.
Professional traders use low effective leverage, risking only a small percentage of capital per trade. Survival and consistency matter more than chasing quick gains. Proper position sizing and stop-loss discipline separate long-term traders from gamblers.
7. Risk Management Is the Real Edge
Many believe the edge lies in finding the perfect strategy. In reality, risk management is the true secret of spot forex success. Even a strategy with a modest win rate can be profitable if losses are controlled and winners are allowed to run.
Key principles include:
Fixed risk per trade
Favorable risk-to-reward ratios
Avoiding overtrading
Protecting capital during losing streaks
Traders who master risk management stay in the game long enough to benefit from experience and probability.
8. The Role of News and Fundamentals
Spot forex reacts instantly to economic data, central bank statements, and geopolitical events. Interest rate decisions, inflation reports, and employment numbers can cause sharp price movements within seconds.
The secret is not predicting news outcomes, but understanding expectations. Markets move based on how data compares to forecasts. Many professional traders either trade the volatility carefully or stay flat during high-impact news to avoid unpredictable spikes.
9. Psychology: The Invisible Battlefield
The most underestimated secret of spot forex trading is psychology. Fear, greed, impatience, and overconfidence sabotage more traders than poor analysis. Emotional trading leads to revenge trades, premature exits, and ignoring stop losses.
Successful traders develop mental discipline:
Accepting losses as part of business
Following a trading plan strictly
Detaching ego from outcomes
Focusing on process, not individual trades
Consistency in mindset leads to consistency in results.
10. Adaptability and Continuous Learning
The forex market evolves with changes in global economics, technology, and regulation. Strategies that worked in one environment may fail in another. The real secret is adaptability—reviewing trades, refining approaches, and staying informed.
Professional traders keep journals, analyze mistakes, and remain students of the market. Spot forex rewards those who respect its complexity and commit to long-term learning.
Conclusion
Spot forex trading is not a shortcut to instant wealth, nor is it a game of luck. Its “secrets” lie in understanding liquidity, respecting leverage, mastering risk management, reading price action, and maintaining psychological discipline. The global currency market offers immense opportunity, but only to those who approach it with patience, structure, and humility.
In the end, the true secret of spot forex is simple but demanding: treat trading as a profession, not a gamble, and let discipline—not emotion—guide every decision.

Forward and Futures Forex TradingUnderstanding the Backbone of Currency Risk Management and Speculation
Foreign exchange (forex) markets are the largest and most liquid financial markets in the world. Within this vast ecosystem, forward and futures forex trading play a critical role for governments, corporations, banks, hedge funds, and traders. These instruments go beyond simple spot currency exchange and allow market participants to manage risk, lock in prices, and speculate on future currency movements. Understanding how forwards and futures work is essential for anyone looking to grasp the deeper mechanics of global finance.
1. Introduction to Forex Derivatives
In forex trading, derivatives are contracts whose value is derived from an underlying currency pair, such as USD/INR, EUR/USD, or GBP/JPY. Forwards and futures are two of the most important derivative instruments. While both allow traders to agree on a currency exchange rate today for settlement at a future date, they differ significantly in structure, trading venue, flexibility, and risk management.
These instruments are especially important in a world where exchange rates are influenced by interest rates, inflation, geopolitical events, trade balances, and capital flows.
2. Forward Forex Contracts: Meaning and Structure
A forward forex contract is a private, over-the-counter (OTC) agreement between two parties to buy or sell a specific amount of currency at a predetermined exchange rate on a specified future date.
Key Characteristics of Forward Contracts
Customized contracts: Amount, maturity date, and currency pair are tailored to the needs of the parties involved.
OTC trading: Traded directly between banks, corporations, or financial institutions, not on an exchange.
No daily settlement: Profit or loss is realized only at maturity.
Counterparty risk: Since there is no central clearinghouse, there is a risk that one party may default.
3. Purpose of Forward Forex Trading
The primary purpose of forward contracts is hedging rather than speculation.
Corporate hedging: Importers and exporters use forward contracts to protect themselves from unfavorable currency movements.
Example: An Indian importer expecting to pay USD in three months may lock in today’s USD/INR rate using a forward contract.
Budget certainty: Businesses can plan cash flows with confidence.
Interest rate parity: Forward rates reflect the interest rate differential between two countries, not just market expectations.
While speculation is possible, forwards are typically used by large institutions due to their customized nature.
4. Advantages and Limitations of Forward Contracts
Advantages
Complete flexibility in contract terms
Effective protection against exchange rate volatility
Ideal for long-term and large-value transactions
Limitations
Counterparty default risk
Low liquidity (cannot be easily exited before maturity)
Limited transparency in pricing
5. Futures Forex Contracts: Meaning and Structure
A forex futures contract is a standardized agreement traded on a regulated exchange to buy or sell a specific currency at a predetermined price on a fixed future date.
Key Characteristics of Futures Contracts
Standardized size and maturity
Exchange-traded (such as CME or NSE in India)
Daily mark-to-market settlement
Clearinghouse guarantee, eliminating counterparty risk
Unlike forwards, futures contracts are designed for both hedgers and speculators.
6. How Forex Futures Trading Works
When a trader enters a futures contract:
They deposit an initial margin with the exchange.
Profits and losses are settled daily based on price movements.
If losses exceed a certain level, a margin call is issued.
For example, if a trader believes the USD will strengthen against the INR, they can buy a USD/INR futures contract. If the exchange rate rises, they profit; if it falls, they incur losses.
7. Uses of Forex Futures
Forex futures serve multiple purposes:
Hedging: Similar to forwards, but with higher liquidity and transparency.
Speculation: Traders attempt to profit from short-term or medium-term currency movements.
Arbitrage: Exploiting price differences between spot, futures, and forward markets.
Portfolio diversification: Currency futures can reduce overall portfolio risk.
Retail traders often prefer futures due to their regulated nature and ease of access.
8. Advantages and Limitations of Futures Contracts
Advantages
High liquidity
Transparent pricing
No counterparty risk due to clearinghouse
Easy entry and exit
Limitations
Lack of customization
Daily margin requirements can increase volatility risk
Contract sizes may not perfectly match hedging needs
9. Forward vs Futures: A Comparative Perspective
Aspect Forwards Futures
Trading venue OTC Exchange
Customization High Standardized
Counterparty risk Present Eliminated
Liquidity Low High
Margin requirement Usually none Mandatory
Users Corporates, banks Traders, hedgers, institutions
This comparison highlights why forwards dominate corporate hedging, while futures dominate trading and speculation.
10. Role in the Global Forex Market
Forward and futures markets influence:
Exchange rate expectations
Interest rate parity mechanisms
Central bank interventions
Capital flow decisions
In emerging markets like India, forex futures have grown rapidly due to increased participation by retail traders and institutional investors, while forwards remain crucial for exporters and importers.
11. Risks in Forward and Futures Forex Trading
Despite their benefits, both instruments carry risks:
Market risk: Adverse currency movements
Leverage risk (especially in futures)
Liquidity risk (more prominent in forwards)
Operational risk due to contract complexity
Proper risk management, position sizing, and understanding macroeconomic factors are essential.
12. Conclusion
Forward and futures forex trading form the foundation of modern currency risk management and speculation. Forwards provide flexibility and precision for businesses exposed to currency fluctuations, while futures offer transparency, liquidity, and safety for traders and investors. Together, they enhance market efficiency, stabilize cash flows, and allow participants to navigate the ever-changing dynamics of global currencies.
In a world shaped by interest rate cycles, geopolitical shifts, and global trade, mastering forward and futures forex trading is not just a technical skill—it is a strategic necessity for anyone involved in international finance or currency markets.

Emerging Market ProfitsUnlocking Growth Beyond Developed Economies
Emerging markets have become one of the most compelling engines of global economic growth in the 21st century. Countries across Asia, Latin America, Africa, the Middle East, and parts of Eastern Europe are transforming rapidly—industrializing, urbanizing, digitizing, and integrating into global trade and financial systems. For businesses, investors, and policymakers, emerging market profits represent not just higher returns, but access to the future drivers of global demand. However, these profits come with unique dynamics, opportunities, and risks that require deep understanding and strategic execution.
1. Understanding Emerging Markets
Emerging markets are economies that are in transition from low-income, less-developed status toward more advanced industrial and service-based structures. Examples include India, China, Brazil, Indonesia, Vietnam, Mexico, South Africa, and Nigeria. These markets are characterized by:
Faster GDP growth compared to developed economies
Rising middle-class populations
Increasing consumption and investment
Structural reforms and policy evolution
Profits in emerging markets are often fueled by catch-up growth, where productivity, income levels, and infrastructure improve rapidly from a low base.
2. Demographics as a Profit Multiplier
One of the strongest foundations of emerging market profits is demographics. Many emerging economies have:
Young populations
Expanding workforces
Rising urbanization
A young and growing population drives demand for housing, education, healthcare, consumer goods, financial services, and digital platforms. For companies, this translates into:
Long-term revenue visibility
Expanding customer bases
Higher volume-driven profitability
Unlike aging developed markets, emerging economies often enjoy decades of demographic tailwinds that support sustained profit growth.
3. Rising Incomes and Consumption Growth
As emerging markets grow, per capita incomes rise, creating powerful consumption cycles. Millions of people move from subsistence living into discretionary spending. This shift drives profits across sectors such as:
FMCG and retail
Automobiles and mobility
Consumer electronics
Travel, entertainment, and lifestyle services
Even small increases in income can lead to large increases in consumption, creating exponential growth opportunities for well-positioned businesses.
4. Cost Advantages and Operating Leverage
Emerging markets often offer lower costs of production, including:
Labor
Land
Raw materials
Operational overhead
Companies that manufacture or operate efficiently in these regions benefit from strong operating leverage. As revenues grow faster than costs, margins expand, leading to higher profitability. Global corporations frequently use emerging markets as:
Manufacturing hubs
Outsourcing centers
Global supply chain anchors
This cost competitiveness enhances profit margins while improving global market positioning.
5. Infrastructure and Industrialization Upside
Large-scale investments in infrastructure—roads, ports, power, telecom, and logistics—are a major profit catalyst. Governments in emerging markets actively invest in:
Transportation networks
Energy generation and distribution
Digital infrastructure
Infrastructure development unlocks productivity, reduces costs, and enables new industries. Companies involved in construction, capital goods, engineering, logistics, and energy often experience multi-year profit cycles aligned with national development agendas.
6. Digital Leapfrogging and Technology Profits
Unlike developed markets, emerging economies often leapfrog technologies. Instead of gradual adoption, they move directly to advanced digital solutions:
Mobile payments instead of traditional banking
E-commerce instead of physical retail expansion
Telemedicine instead of hospital-heavy models
This leapfrogging creates extraordinary profit opportunities for fintech, edtech, healthtech, and platform-based businesses. High scalability combined with low marginal costs enables rapid user growth and strong long-term profitability.
7. Financial Deepening and Capital Market Growth
As emerging economies mature, financial systems deepen. Credit penetration, insurance coverage, investment products, and capital markets expand. This benefits:
Banks and NBFCs
Asset management companies
Insurance providers
Fintech platforms
In early stages, even modest increases in financial inclusion can generate substantial profits. Over time, improving asset quality, fee income, and digital efficiency further enhance returns.
8. Valuation Advantage for Investors
From an investment perspective, emerging markets often trade at valuation discounts compared to developed markets due to perceived risks. For long-term investors, this creates:
Higher return potential
Margin of safety
Re-rating opportunities as economies stabilize
When growth visibility improves and reforms succeed, market valuations often expand, resulting in both earnings growth and multiple expansion, a powerful combination for profits.
9. Role of Reforms and Policy Evolution
Structural reforms—such as tax reforms, labor laws, ease of doing business initiatives, and privatization—play a crucial role in unlocking profits. Effective reforms:
Improve capital efficiency
Reduce compliance costs
Attract foreign investment
Enhance corporate governance
Countries that maintain policy stability and reform momentum tend to generate more sustainable and higher-quality profits over time.
10. Risks That Shape Profit Cycles
Emerging market profits are not linear. They are influenced by:
Currency volatility
Political and regulatory changes
Inflation and interest rate cycles
Global capital flow movements
Short-term disruptions can impact earnings, but companies with strong balance sheets, pricing power, and local understanding are better positioned to navigate volatility. Risk management is not about avoidance, but selectivity and patience.
11. Sectoral Leaders Drive Disproportionate Profits
In emerging markets, profits often concentrate among:
Market leaders
Companies with strong distribution networks
Firms aligned with long-term structural themes
Winner-takes-most dynamics are common. Identifying sector champions early can result in outsized profit compounding over long periods.
12. Long-Term Compounding Over Short-Term Noise
The true power of emerging market profits lies in long-term compounding. While quarterly earnings may fluctuate, structural growth trends unfold over decades. Investors and businesses that focus on:
Fundamentals
Scalability
Governance
Competitive advantage
are rewarded with sustained profit growth that often outpaces developed markets over complete economic cycles.
Conclusion: Profits Rooted in the Future
Emerging market profits are not merely about higher growth rates; they represent participation in the transformation of societies, economies, and consumption patterns. From demographic strength and digital leapfrogging to infrastructure expansion and financial deepening, these markets embody the future of global economic growth.
While risks exist, they are inseparable from opportunity. Those who approach emerging markets with discipline, patience, and a long-term vision can unlock profits that are not only higher, but more meaningful—driven by real economic progress and human development. In a world of slowing growth in developed economies, emerging market profits stand as one of the most powerful engines of global wealth creation.

The Dark Side Of Christmas for Bitcoin!!!!!!Christmas buying pressure on Bitcoin is not always bullish.
When everyone expects holiday gains, the market often prepares for something else.
Is this seasonal optimism creating opportunity, or quietly building a selloff?
Hello✌️
Spend 3 minutes ⏰ reading this educational material.
🎯 Analytical Insight on Bitcoin:
Apart from the fundamental explanations regarding Bitcoin’s decline, which this entire article focuses on, the price has recently approached the top of the descending channel, and if the weekly support I have marked on the chart breaks, I expect at least an additional 4% drop, with a target around $82,600.
Now , let's dive into the educational section,
🎄 Overall Market Environment During Christmas
During the Christmas period, the market often enters a phase that looks calm on the surface but carries hidden selling pressure underneath, and this contradiction causes many traders to misread what is really happening.
Reduced participation from large players makes the balance between supply and demand much more fragile than usual, allowing price to react faster to emotions.
In this environment, Bitcoin tends to be more vulnerable to corrections rather than strong bullish continuation.
🧠 Crowd Psychology And Misleading Expectations
When bullish expectations turn into a common belief, the market often chooses a different path because most potential buyers are already positioned.
This collective mindset causes traders to ignore early signs of weakness and react later than they should.
Christmas often creates this exact situation, where optimism replaces realistic analysis.
💸 Converting Bitcoin Into Real Liquidity
During this period, many people prefer to convert part of their Bitcoin holdings into dollars or gold to cover expenses related to celebrations, gifts, and travel.
This behavior is not driven by fear of the market but by real-life liquidity needs.
When this decision happens on a large scale, it creates steady and continuous selling pressure.
📉 Why Selloffs Often Appear Sudden
Seasonal selling usually starts quietly and without panic, but once price reaches sensitive levels, the impact becomes visible as sharp drops.
Traders waiting for classic confirmations often realize the shift only after most of the move has already occurred.
This delay makes the decline feel more sudden than it actually is.
😰 The Hidden Role Of Fear In Decisions
During Christmas, many traders are uncomfortable holding open positions through holidays, which creates a hidden layer of fear that directly influences selling behavior.
This fear usually activates before sharp drops, not after them.
The market senses this hesitation and uses it as fuel.
🧯 Short Market Behavior Summary
Christmas is more about releasing pressure than building new trends.
Understanding this mental phase can help avoid emotional decisions.
🛠 TradingView Tools And Features For This Phase
Volume Profile helps identify areas where price lacks real trading activity, making fast drops more likely.
Session Breaks highlight periods of reduced participation where sudden moves become more dangerous.
VWAP provides a clear view of how far price is trading from market equilibrium.
Market Structure allows traders to detect weak and misleading breakouts.
🎯 Three Key Recommendations For Traders
In this environment, trading less is often a smarter decision than staying constantly active.
Capital protection should have higher priority than chasing moves.
Always ask yourself whether a trade comes from analysis or from psychological pressure.
✨ Need a little love!
We pour love into every post your support keeps us inspired! 💛 Don’t be shy, we’d love to hear from you on comments. Big thanks , Mad Whale 🐋
📜Please make sure to do your own research before investing, and review the disclaimer provided at the end of each post.

XAUUSD | ATHs Aren’t Resistances. They’re Liquidity**This is a long one, if you’re looking for price direction/prediction, skip. If you want to understand market movement, read on**
Hello traders,
- Gold at ATH: Why This Level?
When price revisits an ATH, most traders immediately ask:
“Is this the top or the breakout?”
I used to ask the same question. And that question itself got me no where. Actually a lot of losses.
Let us break down how markets actually behave around obvious levels, using gold as a clean, real example.
-----------------------------------------------------------------------------------
- ATHs Are Not Resistance — They’re Liquidity
ATH range is the most noticeable levels on any chart. That clarity creates these behaviors
1. Breakout traders place buy stops above the ATH
2. Shorts place stop losses above the ATH
Different ideas. Same location
That end up with is a large pool of liquidity around ATH.
Markets don’t move because a level is “strong”. They move because orders stacked in this zone.
-----------------------------------------------------------------------------------
- Why Price Is Attracted to ATHs?
Market makers (brokers, banks, exchanges) don't enter positions like we do. They need: Liquidity & Speed
The 2 behaviors we mentioned creates exactly that.
That’s why we see price usually react violently around these levels.
-----------------------------------------------------------------------------------
- The Common Mistake
Dumb money treats ATHs as automatic resistance or automatic breakout levels. What you should know that what happens after liquidity is taken matters far more.
-----------------------------------------------------------------------------------
- What You Should Look For at an ATH?
1. Has liquidity been taken?
2. What does price do after? Does it accept and hold above? Or does it reject and displace away?
-----------------------------------------------------------------------------------
- How Institutions Use These Levels
Institutions don’t chase breakouts, enter at obvious levels, place tight stops. Instead they usually follow this process:
1. Pushes price into liquidity
2. Absorb stop orders
3. Set positions after sweeping long and short orders
4. Price expands (up or down)
That’s why reversals feel sudden & a move start from candles that look “unfair”
-----------------------------------------------------------------------------------
- A Rule That Changed How I Read a Chart
If price hasn’t taken liquidity, the move isn’t ready
When we wait for liquidity to be taken, we stay out of premature entries & out of obvious traps.
-----------------------------------------------------------------------------------
- Final thought
There will be one way or the other that you will learn that markets don’t trade based on what looks logical to you. They trade where pain is maximized and orders are concentrated.
ATHs aren’t lines to fight or chase. Observe, wait and read.
We don't predict direction with a wand. Your edge is understanding the process behind the curtains.
-----------------------------------------------------------------------------------
Education only. Not financial advice.
If you find this useful, please support me with a like and comment

Why Institutions Trap Retail TraderThis video explains why institutions trap retail traders for liquidity by analyzing common price behavior around key levels. The discussion focuses on how liquidity builds near obvious highs and lows, why false breakouts and sudden reversals occur, and how institutional participation can create traps through market structure and order flow behavior.
The objective of this video is to build awareness around liquidity-driven moves and help understand market mechanics from an educational perspective, without offering any trading or investment recommendations.

The Dumbest Trades I Took This Month (And What They Taught Me)Most traders only show their wins.
This video is about the trades that cost me money.
In this breakdown, I walk through the dumbest trades I took this month—not to self-criticize, but to explain the decisions, assumptions, and psychological mistakes that led to them.
You’ll learn:
Why good-looking setups can still be bad trades
How impatience sneaks in even with experience
The difference between analysis and execution
What I ignored in real time—and shouldn’t have
How to spot these mistakes before they show up in your own trading
This isn’t about perfection. It’s about awareness.
If you’re trying to become more consistent, studying losses matters more than celebrating wins. That’s how discipline actually gets built.
Subscribe if you want honest breakdowns, market structure, and mindset without hype.
Disclaimer: Not trading advice. Just sharing perspective. Manage your risk and make your own decisions.

How to Swing Trade Breakouts in Forex Gold. Full Strategy
I'm giving you a complete, beginner-friendly trading plan to swing trade any Forex pair and Gold like a pro.
No confusing indicators—just pure price action and breakouts.
Get a complete breakout swing strategy with examples , an efficient price models for trading any currency pair and XAUUSD.
This strategy is a t rend-following strategy.
Remember, that a breakout that you identify should strictly align with the market trend.
I will show you how to trade both bullish and bearish breakouts.
Let's start with a bearish one.
How to Swing Trade Bearish Breakouts
Please, study the following model:
To swing trade bearish breakouts:
1. Market trend should be bearish
2. The price should break and close below a key horizontal support and set a new lower low lower close
3. The price should retest a broken support
4. The market should start consolidating within a range
Your signal to sell will be a breakout of a support of the range.
It will be used as a confirmation of a violation of a key support.
Your entry should be on a retest of a broken support of the range.
The level of the lowest daily candle close within that will be your perfect entry level.
Stop loss should lie above the highs of the range.
Take profit should be the next key historic support.
Examine a price action on GBPCHF forex pair on a daily time frame.
The market is trading in a bearish trend and the price broke and closed below a significant horizontal support, updating the low.
The price retested a broken support and started to consolidate on that.
Our plan to open a swing sell trade will be the following:
We will need to wait for a breakout of a support of the range on a daily candle close below that.
Our entry will be a l owest daily candle close within the range.
Stop loss will lie above its highs.
Take profit will be the next historic support.
How to Swing Trade Bullish Breakouts
Now, let me explain how to trade bullish breakouts in uptrend.
Study these model:
To swing trade bullish breakouts:
1. Market trend should be bullish
2. The price should break and close above a key horizontal resistance and set a new higher high higher close
3. The price should retest a broken resistance
4. The market should start consolidating within a range
Your signal to buy will be a breakout of a resistance of the range.
It will be used as a confirmation of a violation of a key resistance.
Your entry should be on a retest of a broken resistance of the range.
The level of the highest daily candle close within that will be your perfect entry level.
Stop loss should lie below the lows of the range.
Take profit should be the next key historic resistance.
See a price action on USDCAD forex pair on a daily time frame.
USDCAD is trading in uptrend and successfully violated a major horizontal resistance, setting a new higher high higher close.
After a retest of a broken resistance, the market started to consolidate within a horizontal range.
To open a swing buy trade, we will need a bullish breakout of a resistance of the range and a daily candle close above that as a confirmation .
Our entry will be on its retest .
Best entry level will be highest daily candle close within the range.
Stop loss is lying below the range's lows.
Take profit is the next historic resistance.
Many breakouts that we see in trading are in fact the traps .
We use this confirmation strategy to avoid them and trade safely.
It dramatically increases a win rate.
A breakout that aligns with the trend is a golden mine.
Such breakouts always provide very profitable trading opportunities.
Trade them smart, wait for a confirmation and set a safe stop loss.
Good luck in swing trading forex and gold.
❤️Please, support my work with like, thank you!❤️
I am part of Trade Nation's Influencer program and receive a monthly fee for using their TradingView charts in my analysis.

Why buying and selling are not two sides of the same coin?One of the most persistent and costly myths in the world of investing is the idea that supply and demand are perfectly symmetrical forces. Many investors assume that a winning strategy in bullish trends can simply be inverted to achieve equivalent results in bearish trends, applying the same filters but in the opposite direction.
Even some educators challenge their followers to "invert" the logic of their strategies when questioning their effectiveness, as if a low hit rate would magically turn into success by reversing the logic.
This fallacy, combined with the belief that technical patterns work equally well across all timeframes and markets, leads to prematurely discarding solid strategies. The error lies in evaluating them while assuming perfect symmetry between bullish and bearish movements, ignoring the inherent structural asymmetry in markets.
Hope vs. Fear
To understand the market, we must understand the human emotion that drives it. The emotions behind buying and selling are radically different:
Buyers: Enter the market guided by euphoria or hope for growth. It is a sentiment that seeks stability and usually builds progressively.
Sellers: Generally act motivated by fear—whether to protect gains at the slightest adverse fluctuation (risk aversion) or to cut losses. Fear is a much more unstable emotion than hope.
The Structural Reality
Stocks (Indices and Individual Stocks)
In these markets, "neutrality" does not exist, and when studying historical data, we observe a clear upward bias.
A large portion of the volume in indices (SPX, Nasdaq) is not speculative but structural (pension funds, 401ks, automatic monthly contributions). There is a constant flow of money entering these markets and ETFs regardless of price.
It is also important to note that many successful companies repurchase their own shares, artificially reducing the floating supply.
Many investors try to apply chart patterns (such as those popularized by Richard W. Schabacker) expecting the same reliability in bearish trends as in bullish ones (or across all markets and timeframes). The reality is that exhaustion patterns in bullish trends fail more often, simply because the natural inertia in traditional markets is to rise.
In my own tests of quantitative systems (such as the Vital Wave , Classic Wave , and Reversal Wave strategies, published on my profile and applicable to traditional markets), the data is conclusive:
• Strategies designed for long-only positions show solid and consistent historical returns.
• When introducing short entries into those same systems under the logic of "inverting the rules," the hit rate plummets and the statistical performance is destroyed.
This happens because in a market with an upward bias, sell-offs occur in contexts of much greater randomness and instability, and they happen less frequently.
Key S&P 500 Data (since 1928):
• Bull Markets: Have occurred 28 times. They last an average of 4.3 years and generate an average return of 149.5%.
• Bear Markets: Have occurred 27 times. They last only 11.1 months with an average decline of -35%.
• Frequency: Since 1984, the S&P 500 has closed negative in only 7 years (1990, 2000, 2001, 2002, 2008, 2018, 2022).
Forex Market
Unlike stocks, currencies cannot rise or fall indefinitely without serious economic consequences (for example, an excessively strong euro would destroy European exports). This creates a more balanced environment:
• Self-Correcting Forces: Central banks intervene (via interest rates or directly) to maintain balances, acting as invisible "ceilings" and "floors."
• Typical Chart Structure: There is no real symmetry here either, but it is undoubtedly a more balanced scenario compared to traditional stocks and indices.
• Chart Structure: Sideways movements, wide ranges, false breakouts (bull and bear traps).
Bitcoin and Cryptocurrencies
Bitcoin exhibits periods of consolidation followed by explosions of volatility, but it maintains a long-term upward bias, heavily influenced by its growing correlation with indices like the S&P 500 (especially since 2020-2021, with significant positive correlations).
As for altcoins, their nature is highly speculative: they depend largely on Bitcoin (lagged movements), have low capitalization, limited regulation, and are vulnerable to manipulation. This makes them inconsistent and difficult to compare with BTC. Exceptions like Monero (XMR) stand out for their greater independence and technical potential.
Conclusion and Recommendation
Design and evaluate your trading systems separately: one optimized for long positions and another (if you use it) for short positions.
Understanding that markets, timeframes, and directions are not symmetrical will give you a significant edge. Instead of seeking the "universal strategy," adapt your tools to the specific context. This perspective not only prevents discarding valid strategies but also allows you to exploit the real inefficiencies of the market.

How to trade every smart money concept: HTF tutorialI talk about trading HTF concepts inside of the smart money world not chasing minutia but paying attention to the larger levels

TALKING CANDLESTICKS- Reading the charts in simple way!This is an attempt to analyze the chart patterns in a simple and common language.

Trading Gold with Fair Value Gaps and Engulfing Candles: A PatieTrading Gold with Fair Value Gaps and Engulfing Candles: A Patient Approach
Trading Gold (XAU/USD) often provides excellent setups for Smart Money Concepts (SMC) like Fair Value Gaps (FVG) and Engulfing Candlestick patterns, especially when combined with a multi-timeframe analysis. Gold's high volatility and clean structure make it an ideal asset for these types of strategies1. Fair Value Gaps (FVGs)FVGs are areas on the chart that represent a price inefficiency or an imbalance between buyers and sellers, often created by large, impulsive moves from institutional order flow. They are identified by a three-candle pattern where the wick of the first candle does not overlap with the wick of the third candle, leaving an empty space or "gap" in the middle candle's range.Role: FVGs are treated as magnets or high-probability zones where price is likely to retrace to "fill the gap" before continuing its move in the original direction.Identification: Look for a strong move (bullish or bearish) that leaves an untraded area.2. Engulfing Candlestick PatternsThe engulfing pattern is a two-candle reversal formation where the second candle completely engulfs the body (and often the wicks) of the first candle, signaling a strong and sudden shift in momentum.Role: They serve as a powerful confirmation signal for entry at a key zone.Bullish Engulfing: Occurs after a downtrend or pullback, where a large bullish candle closes above the open of the previous bearish candle.Bearish Engulfing: Occurs after an uptrend or pullback, where a large bearish candle closes below the open of the previous bullish candle.Multi-Timeframe Strategy for GoldThe most effective way to trade these concepts is by using a top-down, multi-timeframe approach to establish context and refine entry.TimeframePurposeAction & ObservationHigher Timeframe (e.g., 4H, Daily)Establish Bias/ContextIdentify the overall trend and mark key high-probability zones such as major FVGs, Order Blocks, and previous swing highs/lows. This gives you the directional bias (e.g., only looking for long setups).Intermediate Timeframe (e.g., 1H, 15M)Confirm Price ActionWait for the price to retrace into the high-timeframe FVG or zone you marked. Look for a break of minor structure or a change in the state of delivery (CISD) to confirm the pullback is ending.Lower Timeframe (e.g., 5M, 1M)Pinpoint EntryOnce the price is in the FVG zone, look for a final entry trigger. This is where the engulfing candle becomes crucial. A Bullish Engulfing in a Bullish FVG is a high-probability entry signal.The Power of PatienceThe key to consistently profiting from this strategy, especially with a volatile asset like gold, is patience.Wait for Retracement: The most common mistake is chasing the price after the FVG forms. The FVG marks the imbalance that price is likely to revisit. The setup is not complete until price retraces back into the FVG zone.Wait for Confirmation: Do not enter simply because price has touched the FVG. You must wait for the engulfing candle (or another strong reversal pattern) on the lower timeframe to confirm that institutional money is stepping back in. This confirmation filters out low-quality setups and prevents you from entering prematurely.There is Always a Setup: By strictly adhering to your multi-timeframe rules, you will be filtering out the majority of low-probability trades. While this means you won't trade as often, it ensures that every setup you take has a strong, rule-based confluence. If the perfect setup doesn't appear today, one will be available tomorrow. Your patience is your edge.This video provides a step-by-step tutorial on integrating the Fair Value Gap strategy with multi-timeframe analysis.How to Actually Use the Fair Value Gap Strategy (Step-by-Step) | The Trader’s Edge

Why Risk–Reward Matters More Than Win Rate!!One of the biggest myths in trading is this:
“I need to win more trades to be profitable.”
✖️You don’t...
Some of the most profitable traders in the world win less than 50% of their trades.
So what’s the real edge?
👉 Risk–reward.
1️⃣ Win Rate Without Risk–Reward Is Meaningless
A trader who wins 70% of the time but risks 3 to make 1 is still bleeding slowly.
Meanwhile, a trader who wins only 40% of the time
but risks 1 to make 3 can grow consistently.🪜
Win rate tells you how often you’re right.
Risk–reward tells you how much it matters when you are.
2️⃣ Risk Defines the Trade Before Entry
Professionals don’t start with targets.
They start with invalidation.
They ask:
- Where is my idea wrong?
- Where does structure break?
- Where must I be out?
Only after risk is defined, do rewards become meaningful.🏆
If you don’t know where you’re wrong,
you don’t know what you’re trading.
3️⃣ Good Risk–Reward Creates Emotional Stability
When your risk is small and predefined:
- losses feel normal
- hesitation disappears
- overtrading drops
Why?
Because no single trade can hurt you badly❗️
Risk–reward doesn’t just protect your account.
It protects your mindset.
4️⃣ Risk–Reward Is What Builds Consistency
Consistency doesn’t come from winning streaks.
It comes from surviving losing streaks.📉
Proper risk–reward ensures:
- drawdowns stay shallow
- confidence stays intact
- discipline stays repeatable
That’s how traders last long enough to let probabilities work.
📚The Big Lesson
✔️You don’t need to be right more often.
✖️You need your winners to matter more than your losers.
When risk is controlled and reward is logical, trading stops feeling like gambling and starts feeling like execution.
⚠️ Disclaimer: This is not financial advice. Always do your own research and manage risk properly.
📚 Stick to your trading plan regarding entries, risk, and management.
Good luck! 🍀
All Strategies Are Good; If Managed Properly!
~Richard Nasr

Axis Bank | Gann Square of 9 Case Study (21 Oct 2024)This idea presents a chart-based case study showing how price respected a key geometric level derived from the Gann Square of 9 during an intraday session.
On 21 October 2024, Axis Bank opened with volatility and began declining from its first major pivot.
Using Gann’s price–angle principle, the session high was treated as the 0° reference point.
From this reference, two important intraday levels were identified using Square of 9 calculations:
• 1214 → 0° reference
• 1197 → 45° angle level
As per classical Gann observations, when price approaches a 45° level within the active session, it often acts as a point of balance between time and price.
In this case, Axis Bank reached the 1197 level well before the late-session time window, where price showed a clear reaction and short-term upside movement from that zone.
🔍 Key Observations from This Study
• Establish a clear 0° reference from a significant intraday pivot
• Derive angle-based levels using Square of 9 logic
• Observe time alignment along with price levels
• Geometric levels can help anticipate logical reaction zones, rather than guessing
This example demonstrates how price, time, and geometry can be studied together to understand intraday behavior in a structured manner.
Note:
This post is shared purely for educational and analytical discussion of chart behavior.
It is not a trade recommendation or financial advice.

Risk Control, Risk Assessment, Risk ManagementWhy do the professionals make consistently high incomes from trading stocks?
They always control and manage their risk. They use the candlestick patterns as support and resistance levels and allow the stock to "breathe" within a range they have determined is a natural price movement up and down within a tight consolidation, which is what the professionals prefer to trade.
Professionals do mitigate risk on huge-lot orders over 1 million - 5 million shares or higher. They may use Option Puts, e-minis, futures, or spots--whatever they decide for that specific stock trade they have entered and are holding with the intent of having HFTs gap or run the stock upward at market open.
Professionals calculate their risk versus the Run Gain Potential for that individual stock. This provides the Risk vs. Profit gain that can be estimated with a high degree of accuracy.
When you trade any stock, if the stop loss placement makes you nervous, do not tighten the stop loss order price.
Instead, find a lower risk stock with good support very close to your entry price.

This Week’s US Data (15-20 Dec): Stocks & Bitcoin1. Jobs report (NFP, unemployment, wages) 👷♂️
Very good / hawkish for Fed
NFP: > 250k new jobs.
Unemployment rate: ≤ 4.0%.
Average hourly earnings YoY: ≥ 4.0%.
Typical read: economy still strong, “higher for longer” rates; can pressure stocks short term and is usually negative for BTC as real yields/UST bid up.
Clearly bad / dovish for Fed
NFP: < 100k new jobs, or negative revision cluster.
Unemployment rate: ≥ 4.4–4.5%.
Wage growth YoY: ≤ 3.5%.
Typical read: cooling labor market, more cuts priced; generally supportive for equities and often bullish BTC via liquidity/risk-on narrative.
2. Retail sales 🛒
Good demand signal
Headline/control retail sales: ≥ +0.5% MoM and broad-based.
Read: consumer still spending, growth backdrop OK; modestly positive for cyclicals but can keep the Fed cautious, mixed for BTC.
Weak demand signal
Headline/control retail sales: ≤ 0.0% MoM or negative, especially if previous month revised down.
Read: demand softening, recession whispers; increases cut odds, usually net bullish indices if not catastrophic, mildly bullish BTC.
3. CPI / core CPI 🔥
Too hot
Headline CPI YoY: > 3.0–3.2%.
Core CPI YoY: > 3.0% or core monthly ≥ 0.3–0.4%.
Read: disinflation stalling; markets re‑price fewer cuts, UST yields pop, typically negative for high‑beta stocks and BTC.
Comfortably cool
Headline CPI YoY: ≤ 2.7–2.8%.
Core CPI YoY: ≤ 2.7–2.8%, monthly core around 0.2%.
Read: inflation close to “mission accomplished”; supportive for risk assets and usually good for BTC as real yields drift lower.
4. Core PCE 🔥
Hawkish
Core PCE YoY: ≥ 3.0% or re‑accelerating vs prior print.
Read: Fed’s preferred gauge still too high; bearish for duration, a headwind for growth stocks and BTC.
Conclusion for this week: markets are set up for reaction, not trend-building, and thin year-end liquidity means moves can overshoot in both directions.

Understand Asia Session & Conquer London SetupsAsia is the “setup session.” Price often builds a tight box, prints equal highs and lows, and leaves obvious resting liquidity. London loves to raid that liquidity because it’s easy fuel. But before we go to the concept of how to trade it's also good to know why it is created. We already know that FX markets are controlled by CLS Market maker. Do we know it 100% ? No, but they trade almost 7 Trillion daily volume which is almost entire daily FX volume. This company is aggregator the many other bigger ones, they are collecting the orders during the the Asia and processes continuous settlement, during the next day the liquidity is found on the markets. (Im not promoting or something like that, this is institutional player which 99.9% of use here will not have access) Thats where they destroy most less informed traders, not purposely but their work is so effective that small % of traders succeed in this game.
🧩 Simplicity of the concept
You don't trade in the Asia session, Let Asia build the trap , Let price raid one side. Wait for proof it’s done raiding Enter on the retrace, not in the raid and trade contininuation during the London. In the scalping version . You can trader just one side of Asia range to the other side. This requires precisions on lower timeframes. Im planning to explain this later in the next post. For now let's do continuation setups during the London Session.
📌 Asian Session
Low volatility & accumulation phase — the market usually consolidates inside a tight range after the previous New York close. If the Asia session is trending, London will be continuation setup.
📌 London Session
The highest-probability setups often occur during this session.
If Asia was tight range, London usually manipulates the Asian range sweeping stops above or below then reverses and starts the true daily move. London will be Reversal setup. Often sets the daily high or low of the day
❌ Don't overthink it you need to understand HTF Bias
I you dont have HTF Bias your win ration will decrease, you will be frustrated and than you will typically jump to another strategy, like you did it already many times.
⁉️ Always start with question - Where is the liquidity
Always follow the Daily / Weekly candle close. Yes Daily and Weekly !! Even when you are trading intraday. You intraday trades must be within HTF flow. IT means you will not have a trade every day if you want hight win rate. You must be patient.
📈 Continuation
If todays daily candle closed above previous days high and its still not reaching the key level, then liquidity is above todays high. Why ? Because people have intentions to sell highs to early, so and price will most likely go there. So we are bullish. Bullish Close 📈 Reversal
If todays candle wicked above previous day high, but closed below , then we can expect liquidity is below Previous days low. Why? Because mostl likely traders entered fake high break out they put SL below days low. It's signs of reversal. Yes that simple it is. For more details scroll down and find my posts about Daily Bias.
🧩 4 X Potential Frameworks
If you drill what I will show you bellow you will see it on the charts happening at least 2 times a week. If you apply this to the 3 pairs. You got 6 high probability setups . Add patience and risk management = You will conquer the forex trading
🧪 London Continuation Bearish setup
•Narrative: Asia did the manipulation → London does the continuation.
• Asia session already made a manipulation into a key level
• Price displaced away from that level
• CIOD / OB on M15 or H1 before London open • H1: Asia runs above the stops above H1 high into a key level
• It gets rejected and followed by order block and displacement
• At London open, price retraces into M15 premium key level and continues in the same direction
❌Invalidation: the manipulation high/low from Asia session
🧪 London Continuation Bullish setup
• Narrative: Asia did the manipulation → London does the continuation.
• Asia session already made a manipulation into a key level
• Price displaced away from that level
• CIOD / OB on M15 or H1 before London open • H1: Asia runs bellow the stops above H1 high into a key level
• It gets rejected and followed by order block and displacement
• At London open, price retraces into M15 discount key level and continues in the same direction
❌Invalidation: the manipulation high/low from Asia session
🧪 London Reversal Bearish setup
• Narrative: London performs the manipulation → price reverses.
• Asia session consolidates near a higher timeframe key level
• London open initiates the manipulation into the key level
• Price reject at the key level and created M15 order block • H1: Asia consolidates Bellow Key Level
• London opens, price runs Asia high into that Key Level
• M15 breaks down → Change in order flow → clean short setup
• Target: higher timeframe draw on liquidity (e.g., previous day low)
❌Invalidation: the London session high (manipulation point)
🧪 London Reversal Bullish setup
• Narrative: London performs the manipulation → price reverses.
• Asia session consolidates near a higher timeframe key level
• London open initiates the manipulation into the key level
• Price reject at the key level and created M15 order block • H1: Asia consolidates above the Key Level
• London opens, price runs Asia high into that Key Level
• M15 breaks up → Change in order flow → clean short setup
• Target: higher timeframe draw on liquidity (e.g., previous day low)
❌Invalidation: the London session low (manipulation point)
‼️ In trading, you make most money by making precisely best decisions and controlling your risk. Hence understanding the different probabilistic scenarios we can start focusing on quality over quantity by avoiding lower probability conditions. The aim is to improve our decision making process by knowing when it's better to trade and when not.
❌ Low Probability London Session Conditions
• After a series of 3 consecutive bullish daily candles - Avoid Longs.
• After a series of 3 consecutive bearish daily candles - Avoid Shorts.
• After FOMC event that produces an extreme range.
• Ahead of NFP and CPI data release
• Multiple high and medium impact news events.
• The Asian Range is has been trending and is larger than 40 pips.
• If the Asian Range is not visually consolidating.
• Absence of a candle range
✅ High Probability London Session Conditions
• The market has recently reacted off of Daily /H4 key level
• The Asian Range is visually a consolidating and smaller than 40 pips.
• Presence of a clean visual candle range
• Presence of a higher timeframe key level.
• Clean higher timeframe draw on liquidity.
✅ High Probability Intraday Setups
The highest importance is placed on the H TF Daily or 4h direction:
• Clean orderflow.
• Clean higher timeframe draw on liquidity and directional bias.
• Strong price based narrative.
• Strong time based narrative.
• 4h candle range
• 4h Key level.
• Key time
❌ Common mistakes (quick and painful)
Trading every day, even when Asia is messy and wide
Entering during the sweep instead of after displacement
Stop too tight inside noise instead of beyond the actual swept point
Ignoring higher timeframe bias and wondering why London runs you over
Not journaling screenshots of the sweep + confirmation + entry (then you “feel” like it works, but you don’t know)
---------------------------
I promised myself I’d become the person I once needed the most as a beginner. Below are links to a powerful lessons I shared on Tradingview. Hope it can help you avoid years of trial and error I went thru.
📊 Sharpen your trading Strategy
⚙️ 100% Mechanical System - Complete Strategy
🔁 Daily Bias – Continuation
🔄 Daily Bias – Reversal
🧱 Key Level – Order Block
📉 How to Buy Lows and Sell Highs
🎯 Dealing Range – Enter on pullbacks
💧 Liquidity – Basics to understand
🕒 Timeframe Alignments
🚫 Market Narratives – Avoid traps
🐢 Turtle Soup Master – High reward method
🧘 How to stop overcomplicating trading
🕰️ Day Trading Cheat Code – Sessions
🇬🇧 London Session Trading
🔍 SMT Divergence – Secret Smart Money signal
📐 Standard Deviations – Predict future targets
🎣 Stop Hunt Trading
🧠 Level Up your Mindset
🛕 Monk Mode – Transition from 9–5 to full-time trading
⚠️ Trading Enemies – Habits that destroy success
🔄 Trader’s Routine – Build discipline daily
💪 Get Funded - $20 000 Monthly Plan
🧪 Winning Trading Plan
🛡️ Risk Management
🏦 Risk Management for Prop Trading
📏 Risk in % or Fixed Position Size
🔐 Risk Per Trade – Keep consistency
Never stop learning
David Perk aka Dave FX Hunter ⚔️
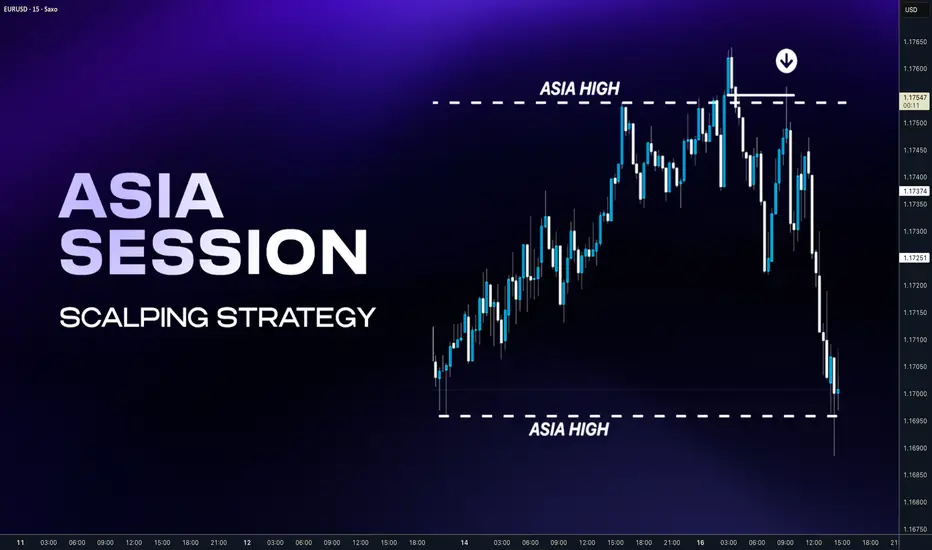
Derivatives Market Made EasyWhat Is the Derivatives Market?
A derivative is a financial contract whose value depends on the price movement of another asset, known as the underlying asset. This underlying asset can be stocks, stock indices, commodities (like gold or crude oil), currencies, interest rates, or even cryptocurrencies. Unlike the cash market, where investors buy or sell the actual asset, in the derivatives market traders deal with contracts linked to the asset’s price.
For example, instead of buying 100 shares of a company, a trader may buy a futures or options contract based on that company’s share price. The value of the derivative changes as the price of the underlying asset moves.
Why Do Derivatives Exist?
Derivatives serve three main purposes:
Hedging (Risk Management)
Derivatives help businesses and investors protect themselves against adverse price movements. For instance, a farmer can lock in a price for crops using futures contracts, reducing uncertainty. Similarly, an investor can use options to protect a stock portfolio from market falls.
Speculation (Profit Opportunities)
Traders use derivatives to profit from price movements without owning the underlying asset. Because derivatives allow leverage, even small price changes can lead to significant gains (or losses).
Price Discovery and Market Efficiency
Derivatives markets help determine future prices based on current information and expectations, improving transparency and efficiency in financial markets.
Key Types of Derivatives
The derivatives market mainly consists of four instruments, but futures and options are the most widely used.
1. Futures Contracts
A futures contract is an agreement to buy or sell an underlying asset at a fixed price on a specified future date. Both buyer and seller are obligated to fulfill the contract.
For example, if a trader believes that crude oil prices will rise, they may buy a crude oil futures contract. If prices rise, the trader profits; if prices fall, the trader incurs a loss. Futures are standardized contracts traded on exchanges and require margin deposits.
2. Options Contracts
Options give the buyer the right, but not the obligation, to buy or sell an asset at a predetermined price before or on a specific date.
Call Option: Right to buy the asset
Put Option: Right to sell the asset
The buyer pays a premium to the seller (writer) of the option. Options are popular because they limit risk for buyers while offering flexible strategies for different market conditions.
3. Forwards
Forward contracts are similar to futures but are customized agreements traded over-the-counter (OTC). They are mostly used by institutions and corporations for hedging.
4. Swaps
Swaps involve exchanging cash flows or financial instruments, such as interest rate swaps or currency swaps. These are mainly used by large financial institutions.
Understanding Leverage and Margin
One of the most important features of the derivatives market is leverage. Leverage allows traders to control a large contract value with a relatively small amount of capital, known as margin.
For example, instead of paying the full value of ₹10 lakh worth of shares, a trader may only need to deposit ₹1 lakh as margin to trade a derivatives contract. While leverage magnifies profits, it also magnifies losses, making risk management crucial.
Role of Exchanges and Regulation
Derivatives are traded on regulated exchanges such as NSE and BSE in India or CME and NYSE globally. Exchanges standardize contracts, ensure transparency, and reduce counterparty risk through clearing corporations. Regulatory bodies monitor these markets to protect investors and maintain stability.
Common Participants in the Derivatives Market
Hedgers: Use derivatives to reduce risk
Speculators: Seek profits from price movements
Arbitrageurs: Exploit price differences between markets
Each participant plays a role in providing liquidity and efficiency to the market.
Advantages of the Derivatives Market
Efficient risk management
Lower capital requirement due to leverage
Ability to profit in rising, falling, or sideways markets
High liquidity and transparency
Risks Involved in Derivatives Trading
Despite its benefits, the derivatives market carries risks:
High leverage can cause rapid losses
Requires strong discipline and knowledge
Market volatility can lead to margin calls
Emotional trading can result in poor decisions
Therefore, education and risk control are essential before entering derivatives trading.
Derivatives Market for Beginners
For beginners, it is advisable to start with basic instruments like index futures or simple options strategies. Understanding the underlying asset, contract specifications, and risk-reward profile is critical. Paper trading and small position sizes help build confidence and experience.
Conclusion
The derivatives market may appear complicated, but at its foundation, it is simply a tool for managing risk and taking advantage of price movements. By understanding basic concepts such as futures, options, leverage, and hedging, anyone can grasp how derivatives work. When used wisely and responsibly, derivatives can be powerful financial instruments. However, they demand discipline, knowledge, and proper risk management. With the right approach, the derivatives market becomes not only easy to understand but also a valuable part of the modern financial system.

Cross-Border Payments: The Future of Global Money MovementUnderstanding Cross-Border Payments
At its core, a cross-border payment occurs when the payer and the recipient are located in different countries and the transaction involves at least two different currencies or financial systems. Examples include an Indian exporter receiving payment from a US buyer, a migrant worker sending money to family back home, or a multinational company paying overseas suppliers.
Unlike domestic payments, cross-border payments must navigate differences in currencies, banking regulations, time zones, compliance standards, and settlement systems. This makes them slower, costlier, and more complicated than local transactions.
How Cross-Border Payments Work
Traditional cross-border payments are typically processed through correspondent banking networks. In this system, banks maintain relationships with foreign banks (correspondent banks) to facilitate international transfers. When a payment is initiated, it may pass through multiple intermediary banks before reaching the final beneficiary. Each intermediary charges a fee and adds processing time.
The SWIFT (Society for Worldwide Interbank Financial Telecommunication) network plays a major role by providing secure messaging between banks. However, SWIFT itself does not move money; it only sends payment instructions. Actual fund settlement happens through bank accounts held across borders.
In recent years, alternative mechanisms have emerged, including fintech platforms, digital wallets, and blockchain-based systems, which aim to simplify and speed up cross-border transfers.
Key Participants in Cross-Border Payments
Several entities are involved in the cross-border payment ecosystem:
Banks and Financial Institutions: Provide traditional wire transfers and trade finance services.
Payment Service Providers (PSPs): Companies like PayPal, Wise, and Stripe offer faster and more transparent international payments.
Central Banks: Regulate currency flows and oversee payment systems.
Clearing and Settlement Systems: Ensure final transfer of funds between institutions.
Businesses and Individuals: End users such as exporters, importers, freelancers, students, and migrant workers.
Costs and Fees in Cross-Border Payments
One of the biggest challenges in cross-border payments is cost. Fees may include:
Transfer fees charged by banks or PSPs
Currency conversion or foreign exchange (FX) margins
Intermediary bank charges
Compliance and documentation costs
For small-value transactions like remittances, these costs can be disproportionately high. Reducing fees has become a global priority, especially for developing economies where remittances are a major source of income.
Speed and Transparency Issues
Traditional cross-border payments can take anywhere from one to five business days to settle. Delays occur due to manual processing, time zone differences, compliance checks, and multiple intermediaries. Additionally, senders often lack transparency on where their money is during the transfer process and what total fees will be deducted.
Modern digital payment platforms are addressing these issues by offering near real-time transfers, upfront fee disclosure, and end-to-end tracking.
Regulatory and Compliance Challenges
Cross-border payments are subject to strict regulatory requirements, including anti-money laundering (AML), combating the financing of terrorism (CFT), and know-your-customer (KYC) rules. Each country has its own regulatory framework, which can create friction and increase compliance costs.
Sanctions, capital controls, and geopolitical tensions further complicate cross-border transactions. Financial institutions must continuously monitor regulatory changes to avoid penalties and ensure smooth operations.
Role of Technology in Cross-Border Payments
Technology is transforming the cross-border payments landscape. Fintech innovations are reducing reliance on correspondent banking and improving efficiency. Key technological trends include:
Blockchain and Distributed Ledger Technology (DLT): Enables faster settlement and reduced intermediaries.
Application Programming Interfaces (APIs): Allow seamless integration between payment systems.
Real-Time Payment Networks: Enable instant or near-instant transfers across borders.
Artificial Intelligence (AI): Enhances fraud detection and compliance monitoring.
These innovations are making cross-border payments more accessible, especially for small businesses and individuals.
Cross-Border Payments and Global Trade
International trade depends heavily on efficient cross-border payment systems. Exporters need timely payments to manage cash flows, while importers seek secure and cost-effective settlement options. Trade finance instruments such as letters of credit, bank guarantees, and documentary collections are closely linked to cross-border payment mechanisms.
Efficient payment systems reduce transaction risks, improve trust between trading partners, and support global supply chains.
Importance of Cross-Border Remittances
Remittances are one of the most significant components of cross-border payments, particularly for emerging economies. Millions of migrant workers send money home regularly to support families, education, healthcare, and housing. These flows contribute significantly to national income and economic stability.
Improving the affordability and speed of remittance services can have a direct positive impact on financial inclusion and poverty reduction.
The Future of Cross-Border Payments
The future of cross-border payments is moving toward greater speed, lower cost, and enhanced transparency. Central bank digital currencies (CBDCs), global payment interoperability, and standardized compliance frameworks are expected to play a major role.
Collaboration between banks, fintech firms, regulators, and international organizations will be crucial in building efficient global payment infrastructure. As technology evolves, cross-border payments are likely to become as seamless as domestic transactions.
Conclusion
Cross-border payments are a vital pillar of the global financial system, enabling trade, investment, and personal financial connections across nations. While traditional systems face challenges related to cost, speed, and complexity, technological innovation and regulatory cooperation are driving meaningful improvements. As the world becomes more interconnected, efficient and inclusive cross-border payment systems will be essential for sustainable global economic growth.
