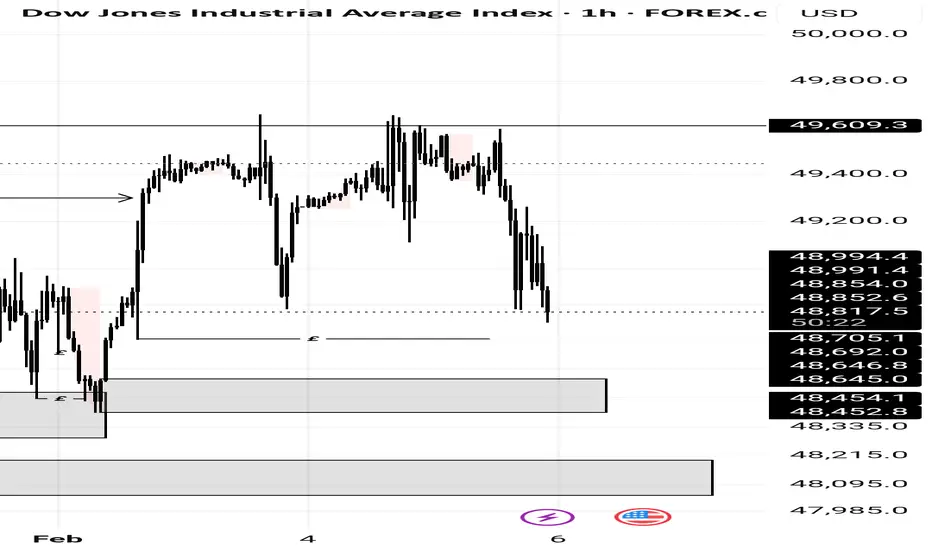
Dow Jones Wave Analysis – 5 February 2026
- Dow Jones reversed from level 49500.00
- Likely to fall to support level 48500.00
Dow Jones index recently reversed from the resistance zone between the resistance level 49500.00 (upper border of the sideways price range inside which the index has been trading from January) and the upper daily Bollinger Band.
The downward reversal from the resistance zone is currently forming the daily Evening Starr reversal pattern strong sell signal for Dow Jones.
Dow Jones index can be expected to fall toward the next support level 48500.00 (lower border of the active sideways price range).
Community ideas

Bitcoin short to $62000 to $59000Just opened a new short on #bitcoin
just now.
🛑sl: $70860
🎯tp1: $62000
🎯full exit: $59000
💰2.7 to 4RR
Manage risk- DO NOT OVER-LEVERAGE if following along.
CRYPTOCAP:BTC

BTC - My highest conviction tradeBTCUSD (1D) — Bear flag breakdown + void magnets (volume profile)
Same story, cleaner setup: structure says lower until proven otherwise.
What’s on the chart:
Big sell impulse (flag pole) → sideways grind (bear flag) → breakdown
The volume profile is showing clear low-volume “voids” below price. These zones tend to act like magnets until they’re “filled” / price finds acceptance.
________________________________________
The map
Breakdown zone = line in the sand
If BTC stays below the bear-flag breakdown / retest area, sellers control the tape.
Bulls need a reclaim + hold to kill the breakdown thesis.
Void target #1: ~74.4k
Next major low-volume pocket.
MUST HAVE CAPITULATION VOLUME TO CONFIRM PIVOT
Expect a fast move into it, then either:
bounce + chop (acceptance work), or
slice through if risk-off momentum stays strong.
“If it wants to really scare everyone” zone: ~53.3k
Macro horizontal support + rising trendline confluence
That’s the generational / long-term add area on this map.
________________________________________
Scenarios
Bear base-case:
Breakdown holds → 74.4k void fill → if no quick reclaim, continuation risk toward 53.3k confluence.
Bull invalidation:
Reclaim the flag / breakdown level and start closing back above resistance → breakdown becomes a bear trap.
________________________________________
Not financial advice. Just sharing structure + VP logic.
#BTC #Bitcoin #BTCUSD #Crypto #PriceAction #VolumeProfile #BearFlag #TradingView #Liquidity

Gold - Preparing the final blow off top!💰Gold ( OANDA:XAUUSD ) will rally a final +20%:
🔎Analysis summary:
Just in January alone, Gold is up another +25% so far. Looking at this very bullish parabolic rally, Gold remains super strong and is still not done with the bullrun. Until Gold retests the ultimate resistance trendline, it can easily rally another +20% from the current levels.
📝Levels to watch:
$6,000
SwingTraderPhil
SwingTrading.Simplified. | Investing.Simplified. | #LONGTERMVISION

BTC Broke Descending Resistance, Consolidation Before Next Leg U1) Market structure (1hr BTCUSD)
Price was in a clear intraday downtrend (lower highs + lower lows).
You then got a break of descending resistance (trendline break).
After the break, price stopped selling off and started basing/consolidating instead of instantly rejecting.
That behavior is usually reversal continuation behavior, not fresh weakness.
2) What consolidation is telling you
Current range looks like a post-breakout compression zone (re-accumulation on lower TF).
This is the market deciding value before the next impulse.
If bulls were weak, you’d typically see an immediate breakdown back under the broken line, not sideways hold.
3) Momentum read (from your indicators)
RSI ~57 and above 50: momentum bias is bullish, not overheated.
Stoch ~88/87 (overbought zone): short-term stretched, but in a bullish continuation phase, stoch can stay pinned high while price grinds up.
Net: momentum supports upside, but entries should still be structure-based, not FOMO-based.
4) Key levels to watch
Bullish continuation levels
Range high / trigger: ~64.8k–65.0k
A clean 5m close above this with hold = continuation signal.
Upside targets:
TP1: ~65.8k–66.1k
TP2: ~66.8k–67.3k
TP3: ~69.5k–70.2k (your drawn objective zone)
Support / hold levels
Near support: ~64.0k–63.8k
Deeper support/invalidation edge: ~63.4k–63.2k
5) Trade thesis (your idea, tightened)
Your thesis is:
“Descending resistance already broke. We’re now consolidating above the break zone, and as long as support holds, price is likely setting up for the next leg higher.”
That is technically sound.
6) Invalidation (important)
This bullish thesis weakens hard if:
Price loses the consolidation base, and
Accepts back below ~63.4k/63.2k with bearish closes.
If that happens, odds shift to a false breakout and possible revisit lower liquidity.
7) Execution blueprint
Aggressive long: inside consolidation support with tight invalidation.
Conservative long: wait for confirmed breakout close above range high, then buy retest/hold.
Bad trade location: middle of the range with no trigger.

This Volatility Period: February 6th - 8th
Hello, fellow traders!
Follow us to get the latest information quickly.
Have a great day!
-------------------------------------
(BTCUSDT 1M Chart)
The price fell from the critical 69,000 - 73,499.86 range.
We need to see if it finds support near the previous high of 57694.27 to 61299.80.
I believe the price range it cannot return to is below the 42283.58 to 43823.59 range.
-
(1D chart)
This period of volatility is expected to last from February 6th to 8th.
Therefore, the key question is how far it can rebound.
We need to see if it can rise to the critical 69000 to 73499.86 range.
If not, we need to see if it can rise above the left Fibonacci level of 0.618 (65760.59).
The next period of volatility will be around February 17th (February 16th-18th), so the key question is where the price will begin its sideways movement after this period of volatility.
The 57694.27-61299.80 range represents the previous high point, the first significant uptrend, and thus holds some significance.
The M-Signal indicator on the 1D chart is still forming at 87944.84, so we should also monitor whether it re-forms after this period of volatility.
This is because an uptrend begins when it meets the minimum DOM (-60) or HA-Low indicator.
-
Thank you for reading to the end.
I wish you successful trading.
--------------------------------------------------
- This is an explanation of the big picture.
(3-year bull market, 1-year bear market pattern)
I will explain in more detail when the bear market begins.
------------------------------------------------------

I called everything occurring on bitcoin right now!bitcoin is currently trading at 63,000$ and we saw this coming from 120,000$. Please see our previous posts and the linked ideas below.
what more can we expect ? we can expect bitcoin to continue its bearish price action to our next target of 53,531$.
our final bottom target is 45kish as can be seen on the chart.

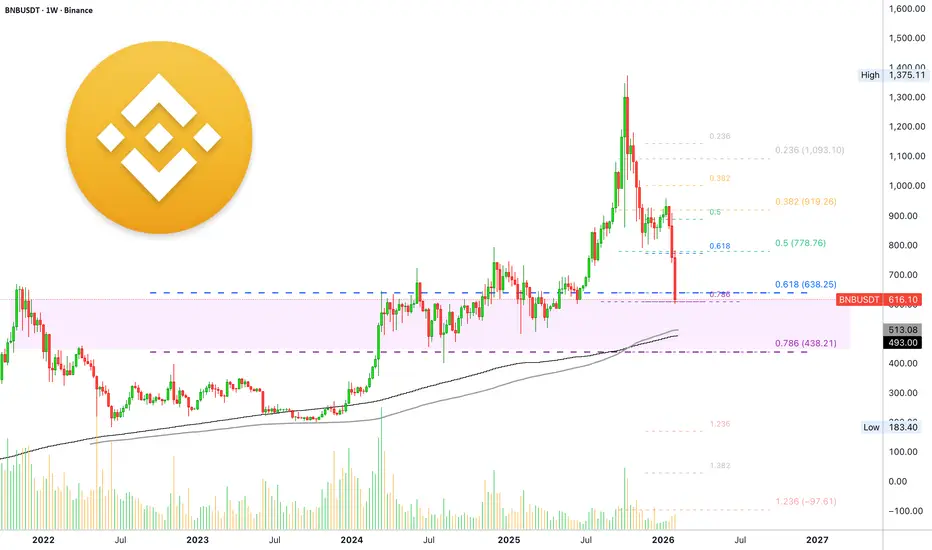
Binance Coin —Global TradFi crash & Crypto safe haven statusHere we have two sets of numbers working as support levels; mid-term and long-term. Based on half of the bullish cycle, starting August 2024, and also the full bullish cycle, starting June 2022.
First, notice how Binance Coin hit bottom June 2022. A long-term higher low happened around October 2023. While prices were low for a long time, technically, the chart always remained bullish after the bear market bottom. We can expect similar developments in 2026 and going forward.
We sure get a bottom, some bullish action then back down but once the bottom is in, it is in for good. It is still very early in the year though, there is plenty of room for horrible things later on.
The Cryptocurrency market will be a safe haven once the world starts to crash, the traditional financial markets. This is the main reason why everything is so wild right now. Crypto needs to go down first and fast so that it can be at bottom prices when people sell TradFi so that money can flow from stocks, banks and governments toward Crypto.
Remember, we are not just looking at the usual market cycles but an evolving humanity. Finance is different now. Money is different now, it is free, open and virtual, it was the biggest monopoly for millennia. The money monopoly is over now.
Binance Coin technical analysis focused on support levels
The 0.786 mid-term was $608 and this level is being lost as I write. The 0.618 level of the broader cycle, multiple years of data, is $638 and this level is also lost. This opens up the range marked on the chart as the next support zone.
Notice how in the past once support was reached the market never continued lower, it went sideways for years then up (after June 2022).
The low August 2024 was $400. This level becomes relevant for the current bearish cycle.
MA200 reads $493 and EMA233 $513. The 0.786 Fib. retracement level for the broader cycle sits at $438. So this is the range, between $400 and $500. If not long-term, support should be find here at least in the short-term.
Summary
BNB keeps going down to settle at the above mentioned levels. Here it becomes tricky. Past action calls for another down-wave but this isn't necessary as the pattern is different now. So it can happen that the accumulation period at bottoms price starts when this crash ends.
Another support zone that can be activated sits between $275 - $350, we need more time for this as it is still too early to know more.
If there is a strong reaction once support is reached, then we might be spared from seeing much lower. But, on the other hand, if there is no strong bullish reaction, then more pain is expected through 2026.
The good news is that we already have four months of sustained bearish action. A big portion of the bearish cycle is already in. This is a blow off top by the way. The way Bitcoin is behaving, is also a blow off top. Maybe we can look back to 2018 to know what to expect. :)
The previous bear market (2022) produced a total of -72% from top to bottom. This time around (2026) we are looking at -56% so far. A price tag of $400, the lower end of the above mentioned range, would give us a total of -71%.
With each passing cycle, bear markets tend to become smaller. It is possible that BNB's bottom will show up around the range mentioned above.
Thanks a lot for your continued support.
Namaste.
Bearish ABC Extension toward 127.2% Target | High RR SetupOverview
Following a significant impulsive leg lower, we are seeing a textbook ABC corrective structure play out. After a temporary relief rally into a established supply zone, the market has broken its corrective trend, signaling a continuation of the primary bearish trend.
Technical Breakdown
The Impulse (Leg A): A strong bearish move established the initial momentum.
The Retracement (Leg B): Price entered a yellow corrective channel, retracing approximately 50% to 61.8% of the initial drop. This is a classic "sell the rip" zone for institutional players.
The Breakdown: The recent candle close below the yellow channel confirms that the corrective phase is over and the third leg (Leg C) is now active.
The Target (Point C): We are projecting an exhaustion point at the 127.2% Fibonacci extension (4,099.2). The 127.2% level is a high-probability target as it often clears the liquidity below the previous structural low at (A).
Trade Parameters
Entry: Current Market Price / Retest of the channel break.
Stop-Loss (SL): 5,119.0 (Invalidation occurs if price breaks back above the Swing High at B).
Take-Profit (TP): 4,099.2 (127.2% Fib Extension).
Risk/Reward Ratio: 1/5
Conclusion
The bear flag breakdown combined with the Fibonacci confluence makes this a high-conviction setup. I will be monitoring volume on the approach to 4,100 to look for signs of absorption and profit-taking.

MCD Wave Analysis – 5 February 2026
- MCD reversed from major resistance level 325.00
- Likely to fall to support level 316.00
MCD recently reversed from the resistance zone between the multi-month resistance level 325.00 (former yearly high from the start of 2025) and the upper daily Bollinger Band.
The downward reversal from this resistance zone stopped the previous impulse waves 3 and (3).
Given the strength of the resistance level 325.00 and the bearish divergence on the weekly Stochastic, MCD can be expected to fall toward the next support level 316.00.

BTCUSDT Strong Support ZoneBTCUSDT clear chart showing the weekly strong support zone based on fibonacci clusters .
Good LUck

Is Bitcoin Forming the Next Cycle Low?Bitcoin is currently approaching a zone that historically aligns with major cycle lows, highlighted by the marked reactions in 2018 and 2022. Each of these areas formed after extended bearish corrections and ultimately led to the start of a new bullish expansion phase.
One of the most important confluences visible on the chart is the Weekly RSI dropping into oversold territory. Historically, whenever RSI has reached or dropped near the 30 level on the weekly timeframe, Bitcoin has formed macro bottoms shortly after. These oversold conditions typically signal seller exhaustion and long-term accumulation opportunities.
At present, BTC is once again showing a similar structure:
- Price is correcting after a strong bullish cycle
- Weekly RSI is entering oversold levels
- Market structure is beginning to resemble previous cycle bottom formations
If historical behavior repeats, this region could potentially act as a 2026 cycle low zone, where long-term buyers step in and momentum gradually shifts back to the upside. However, confirmation through stabilization, higher lows, and momentum reversal would strengthen the bullish outlook.
Key Observations:
- Previous cycle lows formed when weekly RSI approached oversold levels
- Strong historical pattern connecting RSI extremes with macro reversals
- Current price action mirrors prior bear market bottom structures
Traders and investors should monitor price behavior closely around this region. A strong reclaim of momentum could signal the early stages of a new long-term uptrend, while continued weakness may delay the cycle bottom formation.
Cheers
Hexa


TON Toncoin potential SelloffTelegram CEO Pavel Durov has been charged for failing to prevent extremist and illegal content on the messaging platform and placed under judicial supervision, according to the Paris prosecutor's office on August 28.
Durov must report to the police twice a week and is barred from leaving France, the prosecutor's office stated on X.
Parisian investigative judges have also ordered the Russian-born Telegram co-founder to post 5 million euros in bail.
Meanwhile, TON Toncoin is currently in a bearish falling wedge pattern, with a new price target of $3.9.


DOW JONESUS30 keeps breaking new highs
With SMA serving has strong support in the higher timeframes Daily-H4 to the lowest timeframe H1.
Also the fact that the price is respecting structure by:
1. Breaking of the previous high : price createda hew high and by breaking it gives confirmation of bullish continuation.
2. Price retrace and obyed the 50%-60% Fibonnacci level
3. Liquidity to the Up side have been created.

USDCAD SHORTMarket structure bearish on HTFs DW
Entry at Daily and Weekly AOi
Weekly Rejection At AOi
Weekly Previous Structure Point
Daily Rejection At AOi
Around Psychological Level 1.37000
Touching EMA H4
H4 Candlestick rejection
TP: WHO KNOWS!
Entry 90% || TPT 120%
REMEMBER : Trading is a Game Of Probability
: Manage Your Risk
: Be Patient
: Every Moment Is Unique
: Rinse, Wash, Repeat!
: Christ is King.

Is 16000 - 19000 Possible for BTC??BTC Analysis
CMP 66200.71 (05-02-2026)
Hit the Target of Cup & Handle around 120000 - 123000 & then crashed.
Now it may bounce back from 61000 - 63000 towards 80000.
However, breaking the important Support zone (61000 - 63000)
may drop the price further around 48000 & then around 33000.
For long term investment, the most attractive buying range is
around 16000 - 19000 (if it comes).

US30The market has respected and followed a series of demands leading to buys. Swept an equal high and is heading down now for a more buy in the line of the previous buys. Tho there rest a demand below have 3 zones of equal lows which if the most current demand fails, it will head for the demand below

$ETH / Ethereum - Don't Try and Catch KnivesUpdated ETH chart and thoughts:
I will wait until our weekly close to remove the demand/support weekly area near $2800 for further invalidation. I will then add a new supply/resistance area near $3000.
Areas of interest for a bounce/reversal are in green.
Not calling anything until I see slowed selling pressure. Don’t try and catch knives out here hoping for v shape reversal. A foundational bottom takes time to form.
There will be opportunities to buy and add more.

Pull Back is RequiredAMZN Sell Setup - GETTEX:AMZ
Bearish Momentum on Daily Chart
Instrument: AMZN
Timeframe: Daily
Direction: Sell
Confidence: 75%
Setup Overview:
AMZN is showing bearish signals after a recent pullback. MACD has a bearish crossover, and RSI is overbought at 61.25, indicating potential for a downward move. VIX is rising, and 10-year yields are increasing, adding to market pressure. Social sentiment on X is mixed, but news sentiment leans bearish.
Trade Details:
Entry Price: $198.82
Profit Target: $182.23 (~5% downside)
Stop Loss: $205.61 (2:1 risk-reward ratio)
Position Size: 4% of portfolio
Expected Move: -5%
Key Indicators:
MACD: Bearish crossover
RSI: Overbought at 61.25
Market Context: Rising VIX, increasing 10-year yields
Follow for Best AI Signals on the market

NZDUSD BEARISH BREAKOUT|SHORT|
✅NZDUSD strong bearish displacement breaks below the prior supply PD array, confirming market structure shift. Expect a shallow retracement into the breakout zone before continuation toward sell-side liquidity. Time Frame 2H.
SHORT🔥
✅Like and subscribe to never miss a new idea!✅
