GBPUSD: breakout setup toward 1.3940🛠 Technical Analysis: On the H1 chart, GBPUSD remains in a strong bullish structure after the “global bullish signal,” with price continuing to print higher highs and higher lows. The pair is now consolidating just below the key resistance band around 1.3843–1.3850, suggesting a potential squeeze before the next directional move. An ascending support trendline is holding the pullbacks, keeping the short-term momentum constructive. Price is trading above the SMA 50, while SMA 100 and SMA 200 stay well below, confirming trend strength. A clean breakout and hold above the resistance zone would likely trigger continuation toward the next upside objective near 1.3939. If the breakout fails, a retest of the trendline and the nearest support zone around 1.3680 becomes the first level to watch for buyers to defend.
———————————————
❗️ Trade Parameters (BUY)
———————————————
➡️ Entry Point: Buy on a confirmed breakout and hold above 1.38431–1.38500
🎯 Take Profit: 1.39391
🔴 Stop Loss: 1.37788
⚠️ Disclaimer: This is a potential trade idea based on current analysis; market conditions and price direction are subject to change based on news factors and volatility.
Community ideas

The Day Ahead data-heavy session aheadMarkets head into a data-heavy session with the focus on US activity and trade, Eurozone confidence, and a Riksbank rate decision, all landing alongside a blockbuster earnings slate.
Macro & Data
In the US, initial jobless claims will be the key real-time read on labour market momentum, while factory orders, wholesale sales, and the November trade balance help shape Q4 growth tracking.
Europe sees a confidence check via Eurozone January economic sentiment and December M3, with Italy’s industrial sales and wages adding colour on domestic demand.
Japan’s consumer confidence offers a read on household sentiment, while Canada’s trade data and Sweden’s Q4 GDP indicator round out the global picture.
Central Banks
Riksbank decision is the headline risk in Europe, with markets watching tone and guidance as closely as the rate call itself.
ECB’s Cipollone speaking may add nuance on the policy outlook, especially around financial conditions and transmission.
Earnings
A mega-cap and cyclicals-heavy lineup: Apple will dominate sentiment, while Visa and Mastercard give a pulse on global spending.
Semis are in focus with Samsung Electronics, SK hynix, KLA, and Keyence.
Industrials and defensives feature strongly (Caterpillar, Honeywell, ABB, Lockheed Martin, Parker-Hannifin), alongside healthcare (Roche, Thermo Fisher, Stryker, Sanofi).
Financials include Blackstone, ING, Lloyds, with consumer/media names like Comcast and Altria also reporting.
Rates & Supply
US 7-year Treasury auction will test demand amid ongoing volatility in the belly of the curve.
Bottom line: Expect earnings-driven equity moves, with rates and FX sensitive to US jobs data and the Riksbank. Volatility could pick up into the US close as Apple reports.
This communication is for informational purposes only and should not be viewed as any form of recommendation as to a particular course of action or as investment advice. It is not intended as an offer or solicitation for the purchase or sale of any financial instrument or as an official confirmation of any transaction. Opinions, estimates and assumptions expressed herein are made as of the date of this communication and are subject to change without notice. This communication has been prepared based upon information, including market prices, data and other information, believed to be reliable; however, Trade Nation does not warrant its completeness or accuracy. All market prices and market data contained in or attached to this communication are indicative and subject to change without notice.

Report 29/1/26Macro–Geopolitical Report
Event focus: Renewed USD selloff (“Sell America” undertone) after Trump waved off dollar weakness, speculation around USDJPY policy signaling, and a Fed that held rates steady while offering little urgency to restart cuts.
What happened, in plain terms
A sharp leg lower in the U.S. dollar has become the macro headline because it’s no longer being treated as a simple “rate-differential” move; markets are increasingly framing it as a confidence and policy-risk move. In the WSJ framing, shocks and signs of a slowing economy triggered a “Sell America” impulse—U.S. equities and bonds stabilized, but the currency stayed heavy, reflecting anxiety that a debt-burdened U.S. is undermining the global order that supports its own growth.
The catalyst was political signaling: Trump said he wasn’t concerned by a weakening dollar (“No, I think it’s great”), reinforcing a market narrative that the administration is tolerant of depreciation as a competitiveness tool.
This coincided with renewed tariff threats toward Europe and unusual Treasury-related steps that fueled speculation Washington might want a stronger yen versus the dollar—an idea Treasury Secretary Scott Bessent publicly rejected (“absolutely not”), while reiterating a “strong dollar policy.”
What the tape says
The WSJ Dollar Index is sitting around 94.02 (about -1.98% YTD), underscoring that the move is large enough to reprice hedging costs, global asset returns, and inflation expectations at the margin.
In the same market snapshot, EURUSD ~1.1956 and USDJPY ~153.42 illustrate the two key channels: (1) broad USD softness, and (2) heightened sensitivity of USDJPY to policy rumors.
Crucially, the dollar weakness is not happening in a classic “risk-off” way where Treasuries rally hard and equities dump. Around the Fed decision, major stock indexes were “little changed,” and the 10-year Treasury yield edged up to ~4.25%.
That combination—currency down while rates don’t collapse—keeps the market’s attention on risk premium (policy uncertainty, fiscal trajectory, and foreign demand for U.S. assets), not just growth.
Central bank layer: Fed on hold, but not a clean dovish pivot
The Fed held the policy rate in a 3.5%–3.75% range on a 10–2 vote and signaled limited urgency to cut again after the prior contentious reductions. Powell’s messaging emphasized being “well positioned,” implying the bar for immediate easing is not low unless labor-market weakness re-emerges or inflation progress becomes convincing.
For FX, this matters because the near-term USD path is being pulled by two opposing forces: a still-restrictive (or at least not-eager-to-ease) Fed that would normally support USD, versus a political/fiscal/policy uncertainty premium that is now pushing in the opposite direction.
A key tell in the WSJ coverage is that many on Wall Street still expect easing to resume in 2026—meaning the market is increasingly comfortable selling USD rallies if the policy narrative stays noisy.
Strategic interpretation: why this is not “just” a dollar move
A weaker dollar can be benign when it reflects synchronized global growth and improving conditions abroad. The more destabilizing version is when it reflects foreign investors demanding a higher premium to hold U.S. assets—especially if both the currency and bonds wobble together during stress, which challenges the “haven” assumption. WSJ’s commentary explicitly raises the risk that attacks on Fed independence, tariff volatility, and unpredictable foreign policy are testing the “exorbitant privilege” dynamic.
This is where geopolitics bleeds into macro. Trade-war threats with Europe amplify the probability of retaliation, investment delays, and supply-chain re-routing.
Meanwhile, domestic political volatility (including shutdown risk around major funding packages) adds a governance-risk premium that global allocators do price—especially when deficits are already large and refinancing needs are structural.
Fiscal and political implications
If the administration is perceived as tolerant of USD weakness, the fiscal channel becomes more complicated. A cheaper currency can help tradables and manufacturing optics, but it also raises the imported inflation impulse and can increase the “political cost” of living expenses (energy, consumer goods, travel). WSJ notes that overseas exporters are already feeling it: a Polish furniture producer cited a ~12% USD drop versus PLN (combined with tariffs) making price points harder to hit for U.S. buyers.
On the capital-account side, any narrative that foreign reserve managers or large pensions are less comfortable holding Treasuries (even at the margin) forces the U.S. to pay in some mix of: higher yields, weaker currency, or weaker risk assets. That’s the “triangle” markets are probing right now, and it’s why the dollar move is being interpreted as a prestige/policy signal rather than a routine fluctuation.
Forward-looking scenarios
The base case is orderly depreciation: USD remains under pressure but not in free fall, because U.S. markets are still the deepest pool of liquidity and global risk appetite hasn’t collapsed. This is consistent with the view that it’s more “investing less in America” than outright selling.
In that world, the dollar trend persists, hedging costs for foreign investors drift, and equity leadership rotates toward firms with foreign revenues and real-asset sensitivity.
The risk case is disorderly repricing: if tariff escalation with Europe becomes concrete, or if policy steps are interpreted as FX management-by-rumor (especially around USDJPY), the market can quickly shift from “lower USD helps earnings” to “higher U.S. risk premium hurts multiples.” The stress signature would be: USD down and long-end yields up and equities failing to rally on weaker currency—i.e., a classic confidence shock.
Asset-by-asset implications
XAUUSD (Gold). A structurally weaker USD is a direct tailwind for gold, but the more powerful driver here is confidence/credibility. If markets interpret policy volatility as erosion of reserve-currency “buoyancy,” gold benefits as a non-sovereign hedge.
The main offset is if real yields rise because investors demand more term premium; that can cap upside. Net: bias constructive on dips while USD trend is negative and policy uncertainty remains elevated.
S&P 500. Near-term, USD weakness can mechanically lift reported earnings for multinationals and support risk appetite, which is why equity indexes can stay resilient even as FX slips.
But the medium-term signal matters more: if the dollar decline is read as a risk premium move, multiples become vulnerable even if EPS translation improves. The market staying “little changed” around the Fed while USD narratives dominate tells you equities are waiting for confirmation—either a benign “soft landing + global catch-up” story or a harsher “policy shock” story.
USDJPY. This pair is the policy-rumor pressure valve. Speculation that Treasury actions could be interpreted as favoring yen strength, plus explicit denials from Bessent, creates a setup where USDJPY can gap on headlines even without a big rates move. With USDJPY around 153, the balance is: structural USD softness versus episodic risk-on rebounds.
Tactically, headline-driven volatility risk is high; strategically, sustained USD weakness increases the probability of a grind lower in USDJPY unless U.S. yields reassert dominance.
DXY / broad USD. With the WSJ Dollar Index near 94 and framed as the lowest since 2022 in the coverage, the market is telling you it’s comfortable challenging the old “America exceptionalism” premium. The key inflection is whether overseas growth and policy stimulus keep surprising to the upside (supporting non-USD assets) while U.S. politics inject uncertainty. If yes, rallies get sold. If no—if U.S. growth re-accelerates and tariff threats fade—USD can stabilize quickly because positioning can unwind.
Crude Oil. A weaker dollar is typically supportive for commodities on pricing mechanics, but oil is dominated by demand expectations and geopolitics. Trade-war escalation is a clear demand-side risk; an orderly USD decline with stable growth is supportive. Net: oil’s reaction function becomes two-factor: USD down helps, but global growth fears (and risk-off) can overpower.
Dow Jones. Compared with the S&P 500, the Dow’s heavier industrial/old-economy composition makes it more sensitive to trade policy and input costs. If USD weakness is paired with higher tariffs, margins can get squeezed even as exporters gain competitiveness. The fact the Dow was essentially flat (~49,015, +0.02%) in the snapshot is consistent with a market that hasn’t decided whether this is “good weak USD” (earnings tailwind) or “bad weak USD” (confidence premium).

PYTHUSDT 1D#PYTH has broken above the descending resistance and the daily SMA50 and is currently retesting the broken trendline. If the retest holds and a successful bounce occurs, the potential upside targets are:
🎯 $0.0717
🎯 $0.0833
🎯 $0.0926
🎯 $0.1019
🎯 $0.1152
🎯 $0.1321
If the retest fails and price drops back below the trendline, it may revisit the following support levels:
$0.0545
$0.0470
⚠️ Always apply tight stop-losses and maintain strict risk management.

How to Identify Market Highs & Lows - The Foundation of TradingHow to Identify a High and a Low - Trading Foundation
Educational video covering one of the most critical skills in trading: the ability to correctly identify market highs and lows. Master this, and market structure becomes clear.
📚 Why This Matters:
Price = Trader Perception
Understanding highs and lows isn't just technical—it's psychological:
At a High:
Traders perceive price is expensive → Take profits → Ask for discount (pullback)
At a Low:
Traders perceive price is cheap → Take profits on shorts → Ask for discount (rally)
The Opportunity:
If we can clearly identify true highs and lows, we can anticipate these turning points and position ourselves advantageously.
This is the foundation of all market structure analysis.
📊 The Simple Rules:
How a HIGH is Formed:
Rule: A high is formed when a Higher High (HH) creates a minimum of 2 Lower Lows (LL)
What This Means:
Price makes a new high (HH)
Then creates at least 2 consecutive lower lows
This confirms the high is established and price is moving away
Visual Pattern: HH (High formed)
/ \
/ \
/ LL1
/\
/ LL2
How a LOW is Formed:
Rule: A low is formed when a Lower Low (LL) creates a minimum of 2 Higher Highs (HH)
What This Means:
Price makes a new low (LL)
Then creates at least 2 consecutive higher highs
This confirms the low is established and price is moving away
Visual Pattern:
HH2
/\
/ HH1
/
LL (Low formed)
When a High is Broken:
Scenario:
High is formed (HH + 2 LLs) ✓
Price rallies back and breaks ABOVE that high
Then shifts to creating a Momentum Low
What This Tells Us:
Sellers have stepped in at the high. Despite breaking higher, price couldn't sustain and reversed to make a momentum low = bears in control.
Trading Implication: Potential reversal or distribution zone
When a Low is Broken:
Scenario:
Low is formed (LL + 2 HHs) ✓
Price drops back and breaks BELOW that low
Then shifts to creating a Momentum High
What This Tells Us:
Buyers have stepped in at the low. Despite breaking lower, price couldn't sustain and reversed to make a momentum high = bulls in control.
Trading Implication: Potential reversal or accumulation zone
📚 Key Takeaways:
✅ HIGH: HH followed by minimum 2 LLs
✅ LOW: LL followed by minimum 2 HHs
✅ Minimum 2 swings required for confirmation (not 1)
✅ Break + momentum shift = highest probability signals
✅ This is objective - no guessing, just structure
✅ Foundation skill - master this before complex strategies
This is the foundation. Everything else in trading builds on this simple but powerful concept.
👍 Boost if you found this educational
👤 Follow for more trading fundamentals
💬 Can you identify highs and lows now? Practice and share!

EURUSD — Possible BUY Setup 💶💶💶🔥 EURUSD — Possible BUY Setup🔤🔤
Expert Market Analysis
Powered by FXWMarkets
📌 Investment Thesis & Key Drivers
The EURUSD pair remains in a strong multi‑month uptrend, powered mainly by broad USD weakness and shifting expectations around global central bank policy.
Although the pair is extremely overbought, the macro pressure against the USD continues to support the bullish direction.
➡️ BUY Bias — but only on a pullback OR a confirmed breakout above 1.2000.
📊 Rating Summary
Metric Rating
Action ⭐ BUY (Pullback or Breakout Confirmation)
Confidence 65%
Timeframe Short‑Term (Days–Weeks)
Risk Level 🔥 High
Setup Quality 70/100
🔑 Why EURUSD Still Looks Bullish
💵 1. Macro USD Weakness
DXY slipping lower
“Fed uncertainty” dominating sentiment
USD weakness remains the main fuel for EURUSD strength
📈 2. Technical Dominance
Price well above all major MAs
SMA‑5: 1.196
SMA‑200: 1.166
Trend remains parabolic and powerful
🎯 3. Critical Resistance Test
Price consolidating just below 1.2000
A clean break → next leg toward 1.2083
⚠️ 4. Overbought Risk
Daily RSI = 76.052 → extremely overbought
High probability of a sharp pullback
📊 Technical Analysis
Score: 75/100
Verdict: 🔥 Bullish (but extended)
📈 Trend Structure
Strong uptrend on Daily & Weekly
Current price: 1.19536
Above SMA‑5 (1.196) and SMA‑10 (1.184)
🔥 Key Levels
Support 1: 1.1910
Support 2: 1.1800
Resistance: 1.2000 (major barrier)
📉 Momentum Indicators
Indicator Daily 4H Interpretation
RSI 76.05 59.72 Daily overbought; 4H cooling
MACD +0.004 -0.001 Daily accelerating; 4H slowing
ADX 53.10 46.59 Very strong trend
🧭 Technical Verdict
Short‑term cooling + strong long‑term trend =
➡️ Better entry on a dip
➡️ Breakout above 1.2000 = continuation
🌍 Fundamental / Macro Analysis
Score: 80/100
Verdict: ⭐ Strongly Positive
🔹 USD Weakness = Main Driver
DXY sliding toward 96
Market doubts Fed tightening
Anti‑USD sentiment dominating
🔹 ECB Context
Market “testing upside” ahead of ECB
USD weakness outweighs ECB concerns
🔹 Risk Context
EURUSD holding near 4‑year highs despite policy pushback → strong conviction.
🧭 Fundamental Verdict
Macro environment heavily favors EURUSD upside until the Fed shifts tone.
📰 Market Sentiment & Flow
Score: 65/100
Verdict: 👍 Bullish (but cautious)
🔥 Sentiment Highlights
Market watching 1.2000 closely
Fresh buyers stepping in above 1.1950
Some USD profit‑taking, but bullish conviction remains
🧭 Sentiment Verdict
Bullish, but hesitation is normal near a major psychological level.
⚠️ Risk Factors (FXWMarkets)
🏦 1. Overbought Condition
RSI 76 → risk of 100–200 pip correction
Possible dip toward 1.1850
🏛️ 2. Central Bank Jawboning
ECB could push back against EUR strength
Fed could sound more hawkish
➡️ Both can trigger sharp reversals
📉 3. Leverage Risk
High leverage + sharp pullbacks = dangerous
➡️ Use minimal leverage
🧩 Dimensional Integration — Final Verdict
Dimension Score Verdict
Technical 75 🔥 Bullish (Extended)
Fundamental 80 ⭐ Strongly Positive
Sentiment 65 👍 Bullish (Testing Resistance)
⭐ Overall Score: 74/100 → Conditional BUY
Direction is up — but entry must be strategic due to overbought conditions.
🎯 FXWMarkets Action Plan — Conditional BUY
🟡 Scenario 1: Buy the Dip (Preferred)
Wait for retracement into support:
Entry Zone: 1.1910 – 1.1930
Cleans out weak hands
Resets RSI for next leg up
🔥 Scenario 2: Buy the Breakout (Confirmation)
Enter only if price clears 1.2000 decisively:
Entry Trigger: Above 1.2005
Requires strong daily close
🛡️ Risk Management Example (Entry at 1.1920)
Stop Loss: 1.1890 (‑30 pips)
TP1: 1.2000 (R/R ≈ 2.6:1)
TP2: 1.2080 (R/R ≈ 5.3:1)
⚠️ Key Reminders for Retail Traders (FXWMarkets)
Leverage kills — use minimal leverage
Stops are non‑negotiable
Watch DXY — EURUSD strength depends on continued USD weakness

GBPUSD H1 Outlook: Weak High AboveGBPUSD H1 Outlook: Weak High Above, Range Distribution Under Supply, Key Drop Zone at 1.3670 (Fibonacci + EMA + RSI)
GBPUSD on H1 (FXCM) is still in a broader bullish sequence from the late-Jan rally, but the current price action is signaling distribution under a major supply box. Price is trading around 1.3804, sitting inside a consolidation zone just below the marked Weak High near 1.3860–1.3870. This structure often leads to a liquidity sweep above the range, then a controlled rotation lower into the nearest demand.
Today’s plan is simple: sell rallies inside/near supply, and only buy after price reaches demand with confirmation.
Market Structure Read (H1)
The move into the top box was a strong bullish impulse.
Since then, the candles have printed sideways compression with repeated rejections near the upper boundary.
A Weak High overhead suggests liquidity is still available above, which increases the probability of a stop-sweep before the next leg.
Key idea: While price remains capped below the supply ceiling, the risk favors a pullback toward the nearest demand zone.
Key Resistance (Sell Zones)
R1: 1.3835–1.3855
Upper range band. Expect wick rejections and failed breakouts.
R2: 1.3860–1.3870 (Weak High liquidity)
Main sweep zone. If price spikes here and closes back below, it becomes the best short trigger.
Key Support (Buy Zones)
S1: 1.3800–1.3780
Intraday support. If it breaks cleanly with H1 closes, downside opens quickly.
S2: 1.3685–1.3665 (Primary demand zone)
This is the most important level on your chart (blue band). Best area to look for a trend pullback buy.
S3: 1.3520–1.3500
Deeper support if the pullback expands beyond the first demand.
Fibonacci Levels (Practical Map)
Apply Fibonacci to the latest impulse leg into the top box (from the breakout base near the mid-1.36s up to the 1.386 area). The most useful retracement reactions typically sit at:
38.2%: first shallow pullback area (often aligns near the 1.378 region)
50%: fair value retrace (often around the 1.375–1.374 area)
61.8%: deeper discount zone, frequently aligning with 1.3685–1.3665 demand
This is why the 1.3685–1.3665 band is the “high-confluence” level: demand + 61.8% behavior.
EMA + RSI Filters (Avoid Low-Quality Entries)
EMA (suggested: EMA20/EMA50 on H1)
If price stays below EMA20 during rebounds, rallies tend to be sellable.
EMA50 is the trend health line: holding above it supports the “pullback then continue” thesis; losing it increases risk of deeper drop.
RSI (14)
Watch for bearish divergence if price retests 1.3855–1.3870 with weaker RSI.
For buys, RSI holding the 40–50 area and turning up at demand is a strong continuation cue.
Trade Setups (Entry, Stop Loss, Targets)
Setup A: Short From Supply (Preferred While Under Weak High)
Trigger
Price retests 1.3835–1.3855 and prints rejection (H1/M15 bearish engulfing, long upper wick), or a sweep into 1.3860–1.3870 then closes back below.
Stop Loss
Above 1.3875–1.3890 (above the sweep high to avoid being wicked out).
Targets
TP1: 1.3800–1.3780
TP2: 1.3720–1.3700
TP3: 1.3685–1.3665 (main objective)
Setup B: Buy The Dip at Demand (Best Risk-Reward Long)
Trigger
Price reaches 1.3685–1.3665 and shows bullish confirmation: strong rejection wick, bullish engulfing, or break of a minor swing high on M15.
Stop Loss
Below 1.3650 (beneath the demand base).
Targets
TP1: 1.3720–1.3740
TP2: 1.3780–1.3800
TP3: 1.3835–1.3855
Setup C: Breakout Long (Only With Confirmation)
Trigger
H1 closes above 1.3870 and then retests 1.3855–1.3870 as support.
Stop Loss
Below the retest low.
Targets
Trail by EMA20 or new higher-high structure.
Summary
GBPUSD H1 is consolidating under a clear supply box with a Weak High above. The highest-probability flow is:
Sell rallies into 1.3835–1.3870
Look for buys only at 1.3685–1.3665 with confirmation (Fibonacci + demand alignment)

BankNifty levels - Jan 30, 2026Utilizing the support and resistance levels of BankNifty, along with the 5-minute timeframe candlesticks and VWAP, can enhance the precision of trade entries and exits on or near these levels. It is crucial to recognize that these levels are not static, and they undergo alterations as market dynamics evolve.
The dashed lines on the chart indicate the reaction levels, serving as additional points of significance. Furthermore, take note of the response at the levels of the High, Low, and Close values from the day prior.
We trust that this information proves valuable to you.
* If you found the idea appealing, kindly tap the Boost icon located below the chart. We encourage you to share your thoughts and comments regarding it.
Wishing you successful trading endeavors!

GBPCAD sell opportunity Big Picture (4H)
Overall bias: Still bullish, but corrective / pullback phase right now.
Price already broke out of the falling channel (black lines) → that was your bullish continuation signal.
After breakout, price impulsed hard up into a major supply zone (purple zone at the top).
What price is doing now
Price rejected hard from that upper purple supply (clear wicks + bearish candles).
Currently pulling back into:
A previous demand / flip zone (that small purple box you marked)
And sitting inside a premium retracement area of the last bullish leg.
This is healthy bullish behavior, not weakness.
Key Levels That Matter
Resistance (sell pressure):
🔴 ~1.8770–1.8800 (strong supply, caused rejection)
Support (buy interest):
🟦 ~1.8648 (very important — structure support)
🟦 ~1.8601 (next demand)
🟦 ~1.8537 (last bullish defense)
Trade Logic (Smart Money view)
Best scenarios:
✅ Bullish continuation (higher probability)
Price holds above 1.8600
Forms 4H / 1H bullish confirmation (engulfing, strong close, BOS)
Targets:
First TP: 1.8720
Final TP: 1.8770–1.8800
This would be a buy-the-dip continuation move.
⚠️ Deeper pullback (still bullish)
If 1.8600 breaks clean, price likely taps:
1.8537 demand
That level is a high-quality buy zone if structure holds.
❌ Bearish shift (only if this happens)
Clean 4H close below 1.8537
Then bullish structure is invalidated → deeper correction.
Breakout → impulse → pullback → continuation setup
If you trade this on your channel, I’d title it something like:
“GBPCAD Pullback After Breakout — Smart Money Setup”
This is not a random sell zone, it’s:
Breakout → impulse → pullback → continuation setup
If you trade this on your channel, I’d title it something like:
“GBPCAD Pullback After Breakout — Smart Money Setup

ASTER Update🚨📊 ASTER Update
A new red resistance zone has formed 🔴.
Until price breaks out above this zone,
selling pressure remains in control.
This level is key to watch 👀,
waiting for confirmation before any bias shift.

USDJPY Short Term Sell IdeaH4 - Strong bearish momentum.
No opposite signs.
Currently it looks like a pullback is happening.
Expecting bearish continuation until the two Fibonacci resistance zones hold.
If you enjoy this idea, don’t forget to LIKE 👍, FOLLOW ✅, SHARE 🙌, and COMMENT ✍! Drop your thoughts and charts below to keep the discussion going. Your support helps keep this content free and reach more people! 🚀
--------------------------------------------------------------------------------------------------------

UK100/FTSE100 - time for destroyTeam, UK100 next week interest rate decision.
Unemployment figure is on BAD,
inflation is high,
so it may not cut any rate
Time to short at 20216-20220
Will add more between 20245-20265
STOP LOSS at 20315
Target 1 at 10182-10148 - take partial - the market been supporting around 18140 ranges last few weeks,
once it break, we will see below 10100
Target 2 at 10115-10085
LETS GO

THE BRUTAL TRUTH ABOUT GOLD Stop listening to the "price targets." They are all BULLSHIT. 🚫
The current move in Gold is a once-in-history event. Nobody knows where the ceiling is because there is no ceiling in a system that's breaking.
📍 THE NUMBERS: $4k? $8k? $10k? It's all on the table.
📍 THE STRATEGY: If you’re holding, DO NOT LET GO. If you’re out, find your entry NOW.
THE WARNING: ⚠️
This isn't a "bull market" celebration. It’s a warning. The aggressive buying tells us that the whales think SOMETHING BIG is coming. This isn't about local skirmishes ( war between Iran and US , or Greenland )—it’s about a global shift that changes everything. 📉🌍
We’ve lived through enough "historic events" from Corona to wars. We all hope for peace, but GOLD is screaming that the storm isn't over.
Protect yourself. The numbers don't lie. 💎🙌
#GOLD #XAUUSD #MARKETALERT #THEBIGONE #FINANCE2026 #HOLD

The bear The bear in me has woken up.
Imo nothing short term looks good
Long term we are over sold yet still selling off no big moves to digg us out of the rut
Beginning of the end

CADJPY Potential Sell Setup – Liquidity Gap Reversal IdeaI hope everyone is having a productive day. CADJPY is presenting a potential selling opportunity as price action is gradually moving toward a visible liquidity imbalance. There is a high probability that the market may fill this gap before showing a corrective move or possible reversal. The projected target zone is near 110, however traders are encouraged to manage their own take-profit levels based on personal strategy and disciplined risk management.
Trade responsibly, stay patient, and always protect your capital. If this analysis adds value to your trading, feel free to like, comment, and follow for future market insights.

$DAX Weak, But Looking for Gap CloseSPX rallied to new ATH but DAX has yet close the gap from 2 weeks ago. Looking for this to happen.

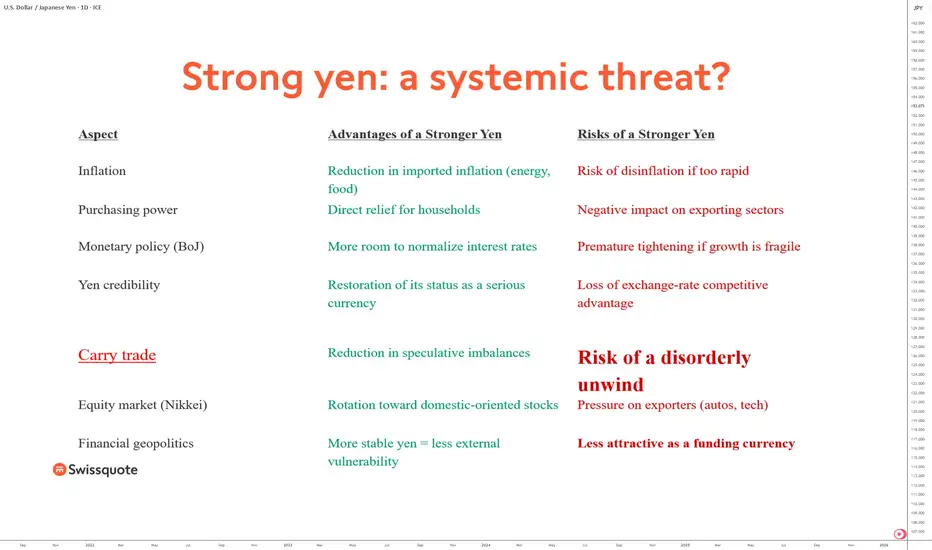
Yen rebound (JPY): a systemic threat?The Japanese yen is close to its lowest level in 40 years and has been the weakest currency in the FX market for several years. However, since the end of January 2026, it has shown a bullish impulse that could mark the beginning of a longer-term upward phase. Could such a regime shift in the yen’s trend represent a threat to Japan, the foreign exchange market, and global finance in general?
First, it is important to keep in mind that the recent rebound in the yen (JPY)—that is, the decline in USD/JPY since last Friday—does not yet change the yen’s underlying trend. The yen remains in a broader downtrend. However, if this underlying trend were to reverse from bearish to a new long-term bullish trend, then significant risks for global finance could indeed emerge. These risks are not driven by the yen rebounding per se, but rather by the speed and momentum of any potential appreciation of the Japanese currency.
The main systemic risk would stem from the unwinding of yen carry trade positions that are still outstanding. At the same time, it should not be overlooked that a yen rebound can also have positive effects, particularly for the Japanese economy, which is seeking to combat inflation.
Here is where the systemic risk to global finance could arise:
• If the yen rebounds too quickly (speed is the key factor), there could be a full unwinding of the approximately USD 200 billion in remaining yen carry trade positions, potentially triggering a global market sell-off
• If the yen rebounds sharply while Japanese interest rates continue to rise, a major source of global funding would disappear
• If the yen rebounds too strongly and too quickly, Japanese institutional investors may
repatriate capital invested abroad into domestic assets, triggering selling pressure on global equity markets
• From a technical perspective, USD/JPY must not fall below the 140 JPY support level
These risks must nevertheless be nuanced and placed within a broader macroeconomic context. A persistently weak yen has certainly supported the competitiveness of Japanese exports and boosted the profits of large listed companies, but it has also imported significant inflation, particularly in energy and food. In this context, a controlled rebound in the yen could instead be viewed as a factor of macroeconomic stabilization for Japan.
A stronger yen would help reduce imported inflation, improve the purchasing power of Japanese households, and restore some credibility to the Bank of Japan’s (BoJ) monetary policy, which has long been perceived as ultra-accommodative and isolated compared with other major central banks. It would also give the BoJ greater room to gradually normalize its interest rate policy without triggering an inflationary shock.
In summary, a yen rebound is not, in itself, a systemic threat. It only becomes potentially dangerous if it is too rapid, too violent, and leads to a sudden end of the yen carry trade. Under a central scenario of gradual normalization, a stronger yen could instead help reduce some of the imbalances accumulated over recent years, both in Japan and globally.
DISCLAIMER:
This content is intended for individuals who are familiar with financial markets and instruments and is for information purposes only. The presented idea (including market commentary, market data and observations) is not a work product of any research department of Swissquote or its affiliates. This material is intended to highlight market action and does not constitute investment, legal or tax advice. If you are a retail investor or lack experience in trading complex financial products, it is advisable to seek professional advice from licensed advisor before making any financial decisions.
This content is not intended to manipulate the market or encourage any specific financial behavior.
Swissquote makes no representation or warranty as to the quality, completeness, accuracy, comprehensiveness or non-infringement of such content. The views expressed are those of the consultant and are provided for educational purposes only. Any information provided relating to a product or market should not be construed as recommending an investment strategy or transaction. Past performance is not a guarantee of future results.
Swissquote and its employees and representatives shall in no event be held liable for any damages or losses arising directly or indirectly from decisions made on the basis of this content.
The use of any third-party brands or trademarks is for information only and does not imply endorsement by Swissquote, or that the trademark owner has authorised Swissquote to promote its products or services.
Swissquote is the marketing brand for the activities of Swissquote Bank Ltd (Switzerland) regulated by FINMA, Swissquote Capital Markets Limited regulated by CySEC (Cyprus), Swissquote Bank Europe SA (Luxembourg) regulated by the CSSF, Swissquote Ltd (UK) regulated by the FCA, Swissquote Financial Services (Malta) Ltd regulated by the Malta Financial Services Authority, Swissquote MEA Ltd. (UAE) regulated by the Dubai Financial Services Authority, Swissquote Pte Ltd (Singapore) regulated by the Monetary Authority of Singapore, Swissquote Asia Limited (Hong Kong) licensed by the Hong Kong Securities and Futures Commission (SFC) and Swissquote South Africa (Pty) Ltd supervised by the FSCA.
Products and services of Swissquote are only intended for those permitted to receive them under local law.
All investments carry a degree of risk. The risk of loss in trading or holding financial instruments can be substantial. The value of financial instruments, including but not limited to stocks, bonds, cryptocurrencies, and other assets, can fluctuate both upwards and downwards. There is a significant risk of financial loss when buying, selling, holding, staking, or investing in these instruments. SQBE makes no recommendations regarding any specific investment, transaction, or the use of any particular investment strategy.
CFDs are complex instruments and come with a high risk of losing money rapidly due to leverage. The vast majority of retail client accounts suffer capital losses when trading in CFDs. You should consider whether you understand how CFDs work and whether you can afford to take the high risk of losing your money.
Digital Assets are unregulated in most countries and consumer protection rules may not apply. As highly volatile speculative investments, Digital Assets are not suitable for investors without a high-risk tolerance. Make sure you understand each Digital Asset before you trade.
Cryptocurrencies are not considered legal tender in some jurisdictions and are subject to regulatory uncertainties.
The use of Internet-based systems can involve high risks, including, but not limited to, fraud, cyber-attacks, network and communication failures, as well as identity theft and phishing attacks related to crypto-assets.
prossible wave 3 projection on SMCIelliot wave fib retracement and on the wave 3 to hit target. around 38 to 39 area. took a long positions and off the daily parellel line

GOLD 5418-5422 LOOKS TO CORRECTION IF 5385-5400 FAILS GOLD 5418-5422 LOOKS TO CORRECTION IF 5385-5400 FAILS
SWITCH TO 15MIN FOR PRICEACTION AND SNIPER ENTRY
Geopolitical Tensions
US President Donald Trump's insistence on acquiring Greenland, including threats of force and tariffs on opposing European nations, has sparked US-Europe friction. French President Macron's rebukes and potential suspension of US-EU trade deals have weakened the dollar, boosting gold's appeal to foreign buyers.
Economic Factors
A softer US dollar makes gold cheaper globally, while expectations of steady Federal Reserve rates—despite labor improvements—favor non-yielding assets like gold. Central banks in China and India continue aggressive gold buying, adding structural support.
Future Outlook
WHAT IS GOLD ???
Gold (Au) is a chemical element and dense, malleable transition metal prized for its lustrous yellow hue, exceptional conductivity, and resistance to corrosion.
History as Store of Value
Gold has served as a store of value for over 6,000 years, from ancient Egyptian tombs (c. 4000 BCE) symbolizing immortality to Lydian coins (600 BCE) enabling standardized trade across empires like Rome (aureus) and Byzantium (solidus, stable 700+ years). The 19th-century gold standard anchored global currencies until 20th-century abandonments, yet gold retains purchasing power
Tier 1 Status Clarification
Gold classifies as a Tier 1 asset under Basel III banking rules , with 0% risk weighting for physical bullion, equivalent to cash for capital reserves, enhancing bank balance sheets amid fiat volatility. This elevates it from prior Tier 3 status, affirming its role as "money again.
HOW DOES THE DOLLAR INDEX AFFECT THE PRICE ACTION AND DIRECTIONAL BIAS ??
The US Dollar Index (DXY) exhibits a strong inverse relationship with global gold prices, where a stronger dollar typically depresses gold values and a weaker dollar boosts them.
Core Mechanism
Gold trades in US dollars worldwide, so dollar strength raises gold's cost for non-US buyers, curbing demand and lowering prices. A weaker dollar reduces this barrier, making gold cheaper and spurring purchases from international investors.
Correlation Strength
Historical data shows a negative correlation coefficient of -0.40 to -0.80, meaning 40-80% of gold's movements often align inversely with DXY changes. Interest rate differentials amplify this: Fed hikes strengthen the dollar and hurt non-yielding gold, while cuts weaken it and favor gold.
Influencing Factors
Geopolitical risks or inflation can override the link temporarily, but dollar dynamics remain the primary driver in most cycles. For instance, recent dollar weakness from de-dollarization trends has fueled gold rallies.
the brics nation are busing buying GOLD.this is the year of GOLD as the new money backed by physical GOLD ,this is why all BRICS CENTRAL BANKS are stocking the yellow bullion.
#GOLD #XAUUSD

PRECISION WIRESPrecision Wires India Ltd is a mid‑cap electricals company incorporated in 1989. It is India’s largest manufacturer of winding wires and conductors, catering to power, automotive, and industrial sectors.
Promoter: The founding family continues to lead the company, building it into a recognized specialty wire manufacturer with global reach.
FY22–FY25 Snapshot
Sales – ₹3,033 Cr → ₹3,302 Cr → ₹4,015 Cr → ₹4,355 Cr
Net Profit – ₹118 Cr → ₹142 Cr → ₹176 Cr → ₹205 Cr
Operating Performance – Moderate → Strong → Very Strong → Excellent
Dividend Yield – 0.8% → 1.0% → 1.2% → 1.4%
Equity Capital – ₹12 Cr (constant)
Total Debt – ₹420 Cr → ₹390 Cr → ₹365 Cr → ₹340 Cr (steady deleveraging)
Fixed Assets – ₹1,120 Cr → ₹1,180 Cr → ₹1,240 Cr → ₹1,310 Cr
EPS – ₹9.8 → ₹11.8 → ₹14.6 → ₹17.0
Institutional Interest & Ownership Trends
Promoter holding: ~58%, reflecting strong family control.
FIIs/DIIs: Limited but gradually rising exposure as earnings scale.
Public float: ~42%, with delivery volumes showing accumulation by long‑term investors.
Strategic Moves & Innovations
Expansion in specialty winding wires for EVs, renewable energy, and industrial motors.
Investment in capacity upgrades and backward integration for cost efficiency.
Diversification into export markets, strengthening global presence.
Focus on quality certifications to serve premium clients in automotive and power sectors.
Cash Flow & Balance Sheet Strength
Operating cash flows strengthened in FY25, supported by margin expansion.
Free cash flow positive, reinvested into modernization and R&D.
Debt reduced steadily, improving balance sheet resilience.
Strong asset base with manufacturing facilities in Silvassa and other industrial hubs.
Risk Factors
Dependence on copper prices, which affect margins.
Competition from global and domestic wire manufacturers.
Cyclical demand linked to industrial and power sector investments.
Export exposure sensitive to global economic cycles.
Investor Takeaway
Precision Wires India Ltd. demonstrates steady revenue growth, margin expansion, and deleveraging, supported by demand from EVs, renewables, and industrial sectors. With strong fundamentals and rising institutional interest, it is well‑positioned for sustained growth, though investors should monitor copper price volatility and sector cyclicality.

GBPUSD Challenges 1.38 resistance Ahead of FOMCFrom a longer-term perspective, GBPUSD is challenging the upper boundary of the consolidation range that has extended between July 2023 and January 2026, just below the 1.38 mark. This structure sits above a broader trend extending from the 2007 highs, positioning the pair toward a longer-term bullish bias should the 1.38 level clear.
The next levels in focus following a confirmed breakout stand near 1.40 and 1.4250, aligning with the 2021 highs as initial upside targets.
On the downside, should the DXY reassert bullish momentum by reclaiming the 97 and 98 levels, GBPUSD may rotate back into consolidation, exposing support levels at 1.35, 1.33, and 1.31 before another directional breakout materializes.
While Trump’s lack of concern continues to fuel extended drawdown risks for the dollar, contrarian indicators amid extreme market sentiment may signal the potential for a short-term rebound, pending confirmation from the upcoming FOMC tone.
- Razan Hilal

Is bitcoin really that much fun?Head and shoulders complete. See ya later Saylor, see ya later strategy.

XOM mid-term TAExxon is strictly bullish on daily and weekly time frames, as much as CVX but XOM even more stronger on monthly time frame. XOM has broken through the final resistance recently and looks promising for an uptrend continuation.
