BTC - Are the bulls looking for a liquidity grab?Market Context
Bitcoin is holding strong after bouncing from a higher support zone and is now pressing into an area packed with liquidity. The recent bullish price action has carved out multiple fair value gaps on the way up, each serving as confirmation of demand and strengthening the bullish structure. Above current price lies a major cluster of buy-side liquidity — a magnet for price.
Fair Value Gaps & Confirmations
On the way up, price created several bullish fair value gaps that have each been respected as support. The first, second, and now third retests into these imbalances show that demand continues to step in, absorbing supply and building pressure upward. Adding to that, a bullish inversion fair value gap (IFVG) has formed, giving extra confirmation that buyers are in control.
Liquidity Target Above
The most obvious draw for price is the heavy buy-side liquidity resting above recent highs. With so many stops positioned there, the market is incentivized to push higher and sweep that zone. The path toward it could involve another retest into one of the fair value gaps below before expansion takes place, or a direct continuation straight into the liquidity pocket.
Final Thoughts
This structure is showing textbook bullish strength: stacked fair value gaps, IFVG confirmation, and a clear liquidity pool overhead. Unless the market breaks back below the deeper support zone, the expectation remains a run into buy-side liquidity.
If this breakdown sharpened your view, a like is appreciated — and I’d love to hear from you: do you expect a retest first, or do we shoot straight into liquidity?
Community ideas

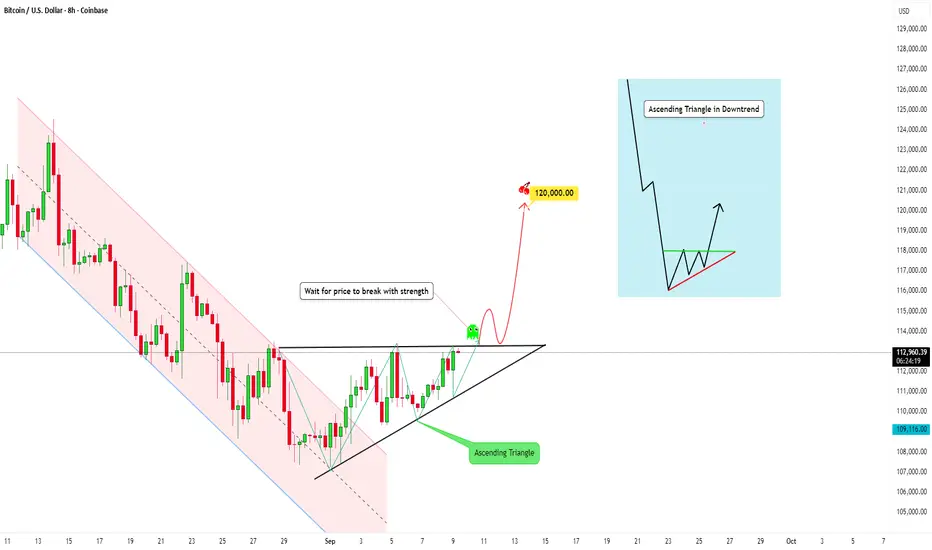
BTC has formed an Ascending Triangle in a DowntrendWhat is Happening Here?
If we take a look at Bitcoin, it's pretty interesting right now: we can observe an ascending triangle just formed. But this pattern took shape after a sharp drop in price.
An ascending triangle is a bullish continuation pattern:
- The resistance line stays horizontal (flat top).
- The support line is rising, creating higher lows.
So what does this mean?
This indicates that buyers are gradually pushing prices higher while sellers are consistently defending the resistance level.
And often with this pattern, the buying pressure overwhelms the sellers, causing a breakout to the upside.
🔹 Breakout expectation:
- Wait for breakout confirmation always! (strong candle close above resistance with volume), and/or on a retest of the broken resistance (now acting as support).
- With this pattern, if it breaks above strongly, the target can typically be measured by taking the height of the triangle and adding it to the breakout level.
🔹 Risk Factors:
- False breakouts can occur (price temporarily breaks resistance but falls back inside).
- If the pattern fails and price breaks below the rising trendline, it may signal bearish weakness.
✅ The reliability of the pattern increases on higher timeframes and with strong breakout volume.
In summary
An ascending triangle shows the following: Buyers are showing strength with rising lows, while resistance is being pressured repeatedly. A confirmed breakout above resistance could drive price toward a psychological target. Waiting for a strong breakout and possibly a retest helps reduce false signal risk.
Not financial advice, just sharing my thoughts on the charts.
Trade safely 😊
EURUSDHello Hello Traders! 👋
What are your thoughts on EURUSD?
EUR/USD has been trapped in a sideways range for the past few weeks, showing choppy back-and-forth movements.
However, the recent break above the descending trendline suggests that a potential bullish breakout could be underway.
After some short-term consolidation, the pair could gain bullish momentum and head toward the next resistance levels.
Thursday’s U.S. CPI data will be a key catalyst that may drive volatility and determine the pair's next direction.
Don’t forget to like and share your thoughts in the comments! ❤️

AUD/USD - Bullish Channel (10.09.2025) The AUD/USD pair on the M30 timeframe presents a Potential Buying Opportunity due to a recent Formation of a Bullish Channel Pattern.
This suggests a shift in momentum towards the upside and a higher likelihood of further advances in the coming hours.
Possible Long Trade:
Entry: Consider Entering A Long Position around Trendline Of The Pattern.
Target Levels:
1st Resistance – 0.6636
2nd Resistance – 0.6658
🎁 Please hit the like button and
🎁 Leave a comment to support for My Post !
Your likes and comments are incredibly motivating and will encourage me to share more analysis with you.
Best Regards, KABHI_TA_TRADING
Thank you.
Disclosure: I am part of Trade Nation's Influencer program and receive a monthly fee for using their TradingView charts in my analysis.

GOLD: Israeli Airstrike Hits Hamas leaders in QatarGOLD: Israeli Airstrike Hits Hamas leaders in Qatar
🚨 Breaking NEWS:
Several blasts heard in Qatar’s capital after Israeli airstrike on Hamas leadership
The Israel Defence Forces (IDF) said it had carried out a targeted attack on Hamas officials, shortly after the militant group claimed responsibility for an attack on a bus stop in Jerusalem that killed six people.
------------------------------------------
The previous time Israel, Iran and the US started the conflict and GOLD fell and did not rise at a time when everyone thought it would explode.
The price is rising inside an ascending channel. A price reaction has already started. If it breaks out of the channel, then it may fall further as shown in the chart.
It may repeat the same pattern as last time. Drop at a moment that everyone is waiting for 4000.
Someone else may close the profits made so far.
Maybe the news we had today was news that someone else knew in advance. This could be a strong reason why GOLD rose for no reason in the previous days.
⚠️It is better if you avoid trading gold
⚠️I don't want you to sell GOLD, but is better if you know that also this scenario is possible if the price breaks down from the channel
You may find more details in the chart!
Thank you and Good Luck!
❤️PS: Please support with a like or comment if you find this analysis useful for your trading day❤️

GOLD → Consolidation before continued growth FX:XAUUSD is undergoing a correction amid revised unemployment data, but this has not disrupted the overall technical situation. The market is still anticipating an aggressive reduction in interest rates...
The price resumed its growth on Wednesday amid escalating geopolitical tensions and a weakening dollar ahead of the release of US inflation data (PPI). The price is correcting after a record high of $3675, but retains the potential for further growth.
The escalation of the situation in Eastern Europe and the Middle East is increasing demand for safe assets. Expectations of Fed policy easing and a revision of employment data are weighing on the USD.
PPI inflation data: Today's release may temporarily support the USD if the figures exceed forecasts, but the overall trend remains bearish for the dollar.
PPI data is ahead, which may cause short-term volatility, but the long-term bullish trend remains intact.
Support levels: 3640, 3628
Resistance levels: 3657, 3675
Technically, I expect to see a correction from local resistance to the 3645-3640 area, from which growth may continue. A breakout of 3657 could trigger a continuation of the momentum.
Best regards, R. Linda!

Lingrid | GOLD Price Deceleration: Short-Term Retracement The price perfectly fulfilled my previous idea . OANDA:XAUUSD has reached a fresh all-time high within the upward channel but is now showing price deceleration near the 3,660 resistance zone, suggesting exhaustion. Price action is forming smaller candles in the profit-taking area, indicating weakening bullish momentum. A rejection here could trigger a corrective move toward 3,590, with deeper downside potential toward 3,470 if sellers sustain control. The broader structure highlights a possible correction unfolding following A-B-C movement from this overextended zone.
💡 Risks:
A softer US CPI could reignite bullish flows and invalidate the sell scenario.
Renewed geopolitical tensions may increase safe-haven demand and push gold higher.
A dovish Federal Reserve shift could restore strong buying pressure and reverse any correction.
If this idea resonates with you or you have your own opinion, traders, hit the comments. I’m excited to read your thoughts!

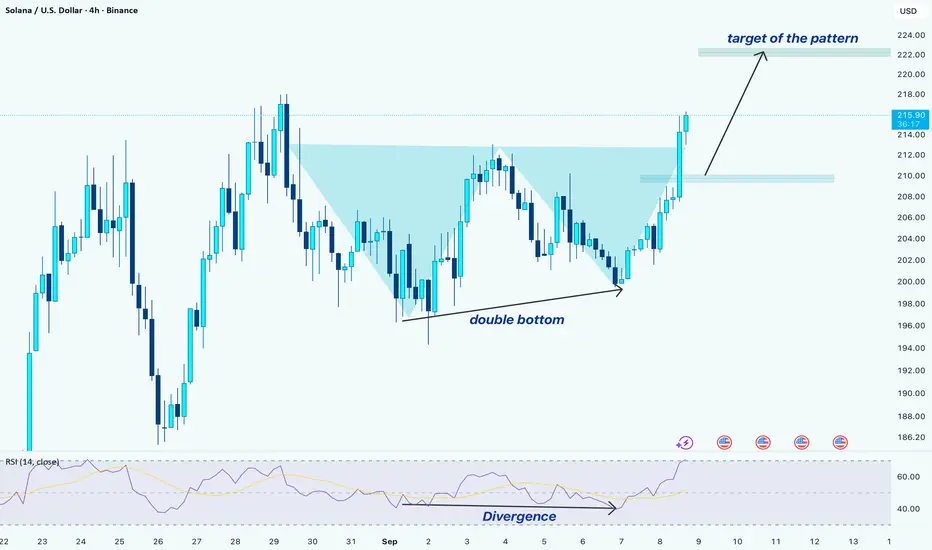
SOL/USDT –> Double Bottom Breakout with Bullish DivergenceHello guys!
Solana has completed a double bottom pattern and broken above the neckline, signaling bullish momentum. Here’s the breakdown:
1-Pattern Formation
A clear double bottom has formed around the $200 zone.
The neckline breakout happened at ~$213–214, confirming the reversal.
2- Momentum Confirmation
Bullish divergence on RSI supported the double bottom.
While price made equal lows, RSI showed higher lows → early sign of trend reversal.
3-Entry Options
Market entry
Pullback entry: Around the $210 area, in case of a retest of the neckline zone.
5- Target
The projected move from the pattern points to $222.
This also aligns with the next resistance area.
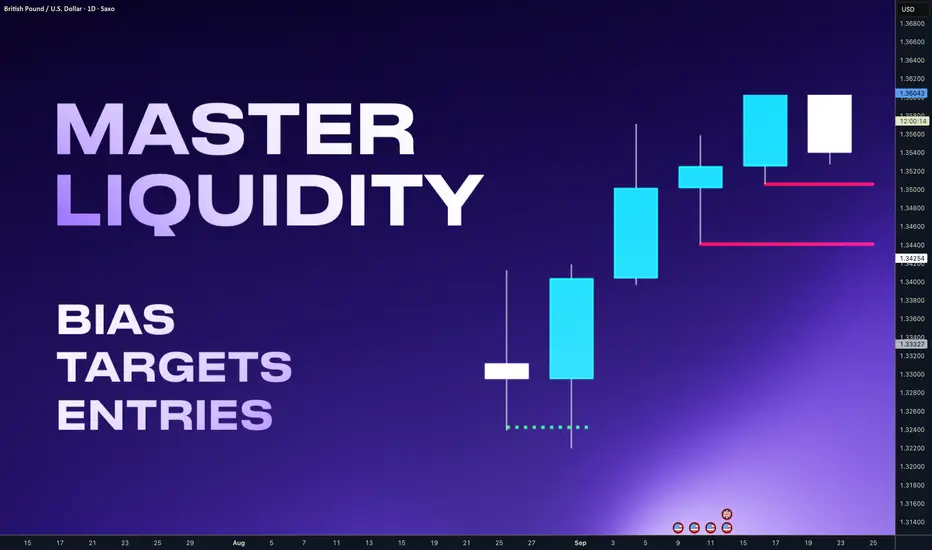
Liquidity in Trading: The Basics You Must Understand👉 If you can’t identify liquidity, you become the liquidity.
It's not an indicator, It's not a pattern. It's not a theory.
It's how the markets actually move.
Every trader has seen it happen: you take a position at the “obvious” level, only to get stopped out by a quick wick — and then the market runs exactly where you expected. That wasn’t bad luck. That was liquidity.
In this post, you’ll learn few main forms of liquidity that move markets and how to avoid being stop hunted and actually use such a phenomena for your advantage.
Don't be a liquidity
Price doesn’t move randomly inside ranges. It hunts liquidity at the edges.
• Retail trap: Traders pile orders right at the range high/low.
• Smart money: Hunt's edges of range before starting the move.
Wait for the sweep of those levels. The stop runs happen first, the real move comes after.
⚠️ If a pivot level gets tapped multiple times, it's on purpose. Smart money are creating illusion of strong support / Resistance.
Les informed traders trades patterns like : Double bottom, Double top and they put the stop losses above the range - This creates a Liquidity cluster which smart money needs to execute their orders. They will come for it before the real move happen.
How to enter continuation
Even in strong trends, price doesn’t move in straight lines.
• Consolidation → Expansion: Liquidity builds during pullbacks or sideways pauses, then gets released in a sharp move.
• Retracement → Expansion: don’t chase the first pullback. Wait for at least 50% pullbacks. Not earlier. Best setup is when it has all like the one below.
Double top as liquidity, range, 50% pullback , stop hunt
• Double tops and Triple tops are engendered liquidity if you see it expect price go thru that levels
The win isn’t catching the exact bottom. It’s catching a clean entry with strong Trend continuation - low timeframe reversal and with right timeframe allignements.
So here is again GBPUSD example where we had the weekly range, stop hunt to 50% of the swing.
After stop hunt occurs you wait for. H4 OB being created in other words engulf of last bulky down candle and clean close above. Then you can enter with SL below the stop hunted lows, not only that traders was liquidated there but also another group of traders entered shorts and they will be now liquidated above that double top and its your target.
Importance of key level
Even when smart money moves price to the highs where it seems there is not key level always look left price mostly stop just right above or below the key level. Ranges for some time makes false move in the direction which sucks traders in to to a trade and then they hit key level and go that direction.
If the move is not going from key level it's a trap. We can use many types of levels, but here is a tip for the forex Whole, quarter, half levels are strong. If your order block, supply / demand occurs or classic support occurs around that level it will have higher probability and its not because of psychological level. It's because these levels are what institutions are trading.
Stop hunts are not your enemy — unless you ignore it. The market makers hunts liquidity before it moves. By starting thinking about the markets this was way you will recognize and will be able to visualize future movements.
Summary
Big challenge is waiting patiently for the stop hunt to happen. And yes sometimes price moves without a stop hunt and you will miss a move. But it's always better not to be in a trade you want to be than being In trade you dont want to be.
Shift from being the exit liquidity to being the trader who patiently waits, confirms, and executes with precision.
🩸 Spot the trap. 🩸 Wait for the sweep. 🩸 Trade with intention.
Dont trust me and fact check this on your chart for your confidence. It's only way to start to see markets differently.
David Perk aka Dave FX Hunter
Gold Pushing Higher!Price pushed in a clear ascending channel. It broke above the most recent resistance, then came back to retest the level. Classic break and retest.
Price rejected off that level, which turned it into new support. That’s a good signal to go long, targeting the top of the projected channel.

GOLD → As prices continue to rise, so do the risks...FX:XAUUSD continues to rise, setting new highs. New ATH 3659. Focus on current consolidation, as the structure remains bullish...
Gold hit a new record high, surpassing $3,650, amid a weakening dollar and growing expectations of aggressive Fed policy easing. However, overbought conditions and profit-taking risks may limit further growth.
The USD is at 7-week lows due to fears of stagflation and deteriorating employment data. The probability of a rate cut on September 17 is 89.4% (25 bps), with a chance of 50 bps. Markets are expecting more than two cuts in 2024.
Risks for gold: “Sell the fact”: If the NFP revision turns out to be weak (as expected), investors may start to take profits.
Technically, gold remains bullish, but a near-term correction is likely due to technical factors and a possible reaction to the data. The long-term trend remains bullish thanks to a weak USD and the Fed's dovish policy.
Resistance levels: 3657, 3675, 3700
Support levels: 3636, 3628, 3620
Gold is consolidating. At the moment, the fundamental background is stable, and no news is expected today except for those that are impossible to predict (comments, rumors, etc.). Before further growth, gold may test the support area and the liquidity hidden behind it.
Best regards, R. Linda!

Trading Psychology 101: Master Your Mind Before the MarketWhen people first start trading, most of their attention goes to entries, indicators, and strategies. It feels like the secret to success must be hidden in the charts.
Over time, traders realize something uncomfortable: the biggest challenge isn’t the market—it’s themselves.
You can learn technical analysis, understand risk management, and even copy profitable strategies. Yet, if fear, greed, or impatience take over, the outcome will be inconsistent.
Research suggests that trading performance depends far more on mindset than on technical skill alone.
Here are a few patterns almost every trader will recognize:
Entering too quickly because of FOMO.
Closing winners too early out of fear they will reverse.
Holding on to losers, hoping they will turn around.
Ignoring rules after a streak of good trades because of overconfidence.
Each one might feel harmless in the moment, but over time they erode consistency.
Imagine two traders using the exact same strategy with a 60% win rate.
Trader A lets emotions dictate actions. They cut winners short, stretch losers, and end up losing money.
Trader B follows rules calmly. Losses are accepted, winners are allowed to run. Over the same number of trades, this trader ends profitable.
The system is identical, but psychology makes all the difference.
5. The Real Lesson
Markets are unpredictable. Strategies are never perfect. What you can control is how you respond.
Strong psychology allows you to execute consistently and let probabilities play out. Without it, even the best system will eventually fail.
6. Benefits of a Solid Mindset
Building psychological strength in trading gives you:
Patience to wait for quality setups.
1. Discipline to stick with your plan.
2. Resilience to handle losing streaks.
3. Consistency across weeks and months.
4. Mental clarity to make rational decisions under stress.
Bitcoin Halving Approaches Fear?? or Greed??Do you believe Bitcoin will repeat its historical halving pattern, or could this time be different?
Which emotion do you think dominates the market now fear of correction or greed for new highs?
Among TradingView’s tools (Fear & Greed Index, Volume Profile, 200-day MA, Fibonacci), which one do you personally trust the most during halving cycles?
Hello✌️
Spend 2 minutes ⏰ reading this educational material.
🎯 Analytical Insight on Ethereum:
Ahead of the upcoming Bitcoin halving, a notable pullback appears likely 📉. Ethereum has broken below its descending channel, indicating bearish momentum. A potential drop of around 15% could target the $3,800 level ⚡.
Now , let's dive into the educational section,
Bitcoin Halving Approaches: Fear of Correction or Greed for Records?
What is halving? Every four years, the block reward for Bitcoin miners gets cut in half. This event means new supply becomes more limited over time. History has shown that after each halving, Bitcoin usually enters a new bullish cycle. But before the real move starts, the market often goes through sharp volatility, creating both fear and greed at extreme levels.
This time the same question repeats itself: will Bitcoin break into new all-time highs after the halving, or will a heavy correction surprise everyone before that happens?
🧠 Psychology of Fear and Greed
Around halving, traders get stuck between two opposite feelings. On one side, the fear of losing money in a possible correction. On the other side, the fear of missing out on massive gains. This psychological battle often causes rushed entries and early exits.
🐋 The Role of Whales
Whales perfectly understand how collective emotions work. At moments of extreme hope or extreme panic, they place heavy orders to flip the market in the opposite direction. Right before halving, this psychological game intensifies more than usual.
⏳ Halving History
Looking back at the three previous halvings, a similar pattern stands out: short-term corrections around the event, followed by a powerful long-term rally. This repetitive history fuels greed and drives many traders to ignore risk management completely.
📊 TradingView Tools
To avoid being trapped by emotions, having the right tools is essential. TradingView provides several key indicators:
The Fear & Greed Index measures overall sentiment. When it shows extreme greed, that’s usually a moment to be cautious.
The Volume Profile highlights price ranges with the highest trading activity. Around halving, these levels often turn into psychological support and resistance zones.
The 200-day Moving Average remains one of the strongest trend indicators, respected in all previous halving cycles.
Even a simple Fibonacci retracement can reveal zones where the biggest emotional battles happen, especially near the golden 0.618 level.
🔑 Conclusion
Bitcoin halving is more of a psychological event than a purely technical one. Charts and indicators provide guidance, but in the end, your mindset determines success or failure. History favors those who resisted collective emotions and followed structured plans.
Three Golden Advices :
Always review Bitcoin’s halving history before making big decisions.
Never forget risk and capital management, especially when greed is high.
Let TradingView tools guide your analysis, not the noise of the crowd.
✨ Need a little love!
We pour love into every post your support keeps us inspired! 💛 Don’t be shy, we’d love to hear from you on comments. Big thanks , Mad Whale 🐋
📜Please make sure to do your own research before investing, and review the disclaimer provided at the end of each post.

Another bullish move goldThis is a Gold Spot vs U.S. Dollar (XAU/USD) chart on the 1-hour timeframe from OANDA. At the current moment, the gold price is trading around $3,657.19, showing a gain of +21.345 points (+0.59%).
The chart highlights a bullish momentum, with the price consistently forming higher highs and higher lows since September 7th. Buyers are dominating, pushing the market upward after breaking through consolidation zones.
Key support levels can be seen around:
$3,655.97
$3,646.27
$3,628.16
$3,578.10
These levels serve as potential zones where buyers may step in again if the price pulls back.
The projection on the chart shows a bullish continuation setup. After a short retracement, the market is expected to resume its upward movement, aiming toward the new high zone at $3,708. This suggests traders are anticipating further upside momentum if gold maintains its current bullish strength.

PPI Shock Pushes Bitcoin Higher – Fake Pump Before Drop?Bitcoin ( BINANCE:BTCUSDT ) has been making high momentum Sharpe moves over the last few days , which has made it a little difficult to trade, which is why I am still sticking to my previous analysis , and this analysis is an update of targets and even new entry points .
Bitcoin is currently moving near the Resistance zone($114,720-$113,580) , Reversal Zone(PRZ) , Cumulative Short Liquidation Leverage($114,510-$113,771) , Monthly Pivot Point , and Resistance lines = a set of Resistances
A few minutes ago, the US Core PPI m/m and PPI m/m data were released, which triggered a pump in Bitcoin . In my view, we should wait for Bitcoin to digest this shock and then continue its real trend .
Do you agree with me?
In terms of Elliott Wave theory , it seems that Bitcoin has completed microwave 5 of microwave C of the main wave Y , and we can expect a downtrend .
I expect Bitcoin to drop again to at least $111,600(First Target) .
Second Target: $110,883
Third Target: $110,000 and more dumps.
Stop Loss(SL): $114,923(Worst)
CME Gap: $117,235-$113,800
Cumulative Long Liquidation Leverage: $110,822-$109,752
Note: Be sure to follow capital management and do not take risks.
Please respect each other's ideas and express them politely if you agree or disagree.
Bitcoin Analysis (BTCUSDT), 1-hour time frame.
Be sure to follow the updated ideas.
Do not forget to put a Stop loss for your positions (For every position you want to open).
Please follow your strategy and updates; this is just my Idea, and I will gladly see your ideas in this post.
Please do not forget the ✅' like '✅ button 🙏😊 & Share it with your friends; thanks, and Trade safe.

Gold Promises New Highs👋Hello everyone, what are your thoughts on OANDA:XAUUSD ?
Today, gold continues to hold a strong bullish trend, currently trading around 3,630 USD with a short-term pullback serving as momentum for the next move.
The key support zone is located around 3,600 – 3,580 USD. If this level holds, the upside remains open with the first psychological target at 3,700 USD. Two major indicators to watch are PPI (Sept 10) and CPI (Sept 11), which could act as the next catalysts for XAUUSD. Keep a close eye to catch trading opportunities.
Scalping Strategy – Optimal Profit Management
✔️ TP1 or 30 Pips: Close bad entry and move SL to entry
✔️ TP2 or 50–70 Pips: Close half of remaining profit, move SL to TP1
✔️ TP3: Close all
From my personal perspective, the main trend remains bullish. Pullbacks only serve as opportunities for safer long entries. And you—what do you think about gold’s trend?

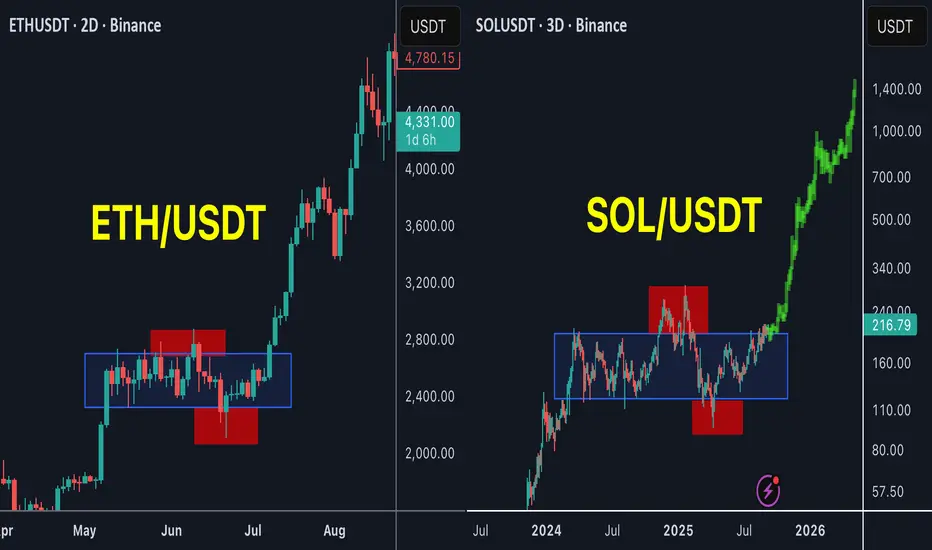
SOL is the next ETH !SOL / USDT
SOL is forming the same pattern as ETH before the huge breakout in past few weeks
Accumulation with 2 major stoploss hunt for bulls and bears and now is trying to breakout the accumulation zone
History show high success rate of this pattern
Will SOL be the next ETH ?
Best of wishes
Gold 30Min Engaged ( Buy And sell Entry Detected )Time Frame: 30-Minute Warfare
Entry Protocol: Only after volume-verified breakout
🩸Bearish After Break : 3635
🩸Bullish Reversal : 3595
➗ Hanzo Protocol: Volume-Tiered Entry Authority
➕ Zone Activated: Dynamic market pressure detected.
The level isn’t just price — it’s a memory of where they moved size.
Volume is rising beneath the surface — not noise, but preparation.
🔥 Tactical Note:
We wait for the energy signature — when volume betrays intention.
The trap gets set. The weak follow. We execute.

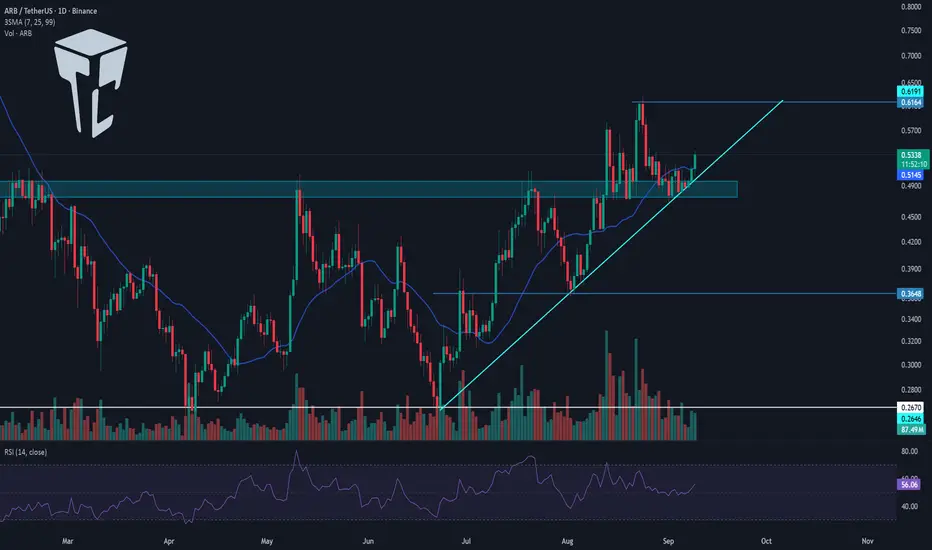
TradersCity Pro | ARB Set for Pump After Pullback to Support👋 Welcome to TradersCity Pro!
In this analysis, I want to review the ARB coin for you. One of the most popular Ethereum Layer 2s, with a market cap of $2.83 billion, currently ranked 43rd on CoinMarketCap.
📅Daily timeframe
On the daily chart, this coin has been in an uptrend along with a trendline and has managed to break through an important resistance zone.
🔔 At the moment, the price is in a correction and pullback phase toward that zone. It reacted to the trendline and bounced upward. The RSI oscillator has also bounced from the 50 level, and if it continues upward, it has room to bring more bullish momentum into this coin.
✔️ The last two candles we had were strong green candles with high volume, showing buyer strength. If today’s candle can hold above the SMA25, the price can move toward 0.6164.
📊 The main bullish move will start after breaking the 0.6164 zone, but the area where support was confirmed is already a very important PRZ. It’s not a bad idea to look for long triggers from this support area on lower timeframes.
⌛️ 4-hour timeframe
On the 4-hour chart, the first long trigger we had — the breakout of 0.5146 — was activated, and the price has so far made a short leg up to 0.5376.
🔍 The 0.5376 zone can be the next long trigger. The negative point here is that the price is in the middle of a bullish leg. These kinds of triggers usually have a lower win rate because they rely on market momentum, and whenever that momentum fades, the chance of getting stopped out rises sharply.
💥 On the other hand, RSI is entering the Overbought zone, which is a strong momentum signal and could help this bullish move continue.
💼 My suggestion: if you already have long positions on this coin or others, it’s not very logical to open a new one here, since this trigger is considered risky. But if you don’t have a position, entering on a breakout of 0.5376 isn’t bad, as RSI entering Overbought could trigger a sharp move upward.
⚠️ Just keep in mind: this trigger belongs to the risky setups, so you should manage your risk on this coin more carefully than on others.
📝 Final Thoughts
Stay calm, trade wisely, and let's capture the market's best opportunities!
This analysis reflects our opinions and is not financial advice.
Share your thoughts in the comments, and don’t forget to share this analysis with your friends! ❤️
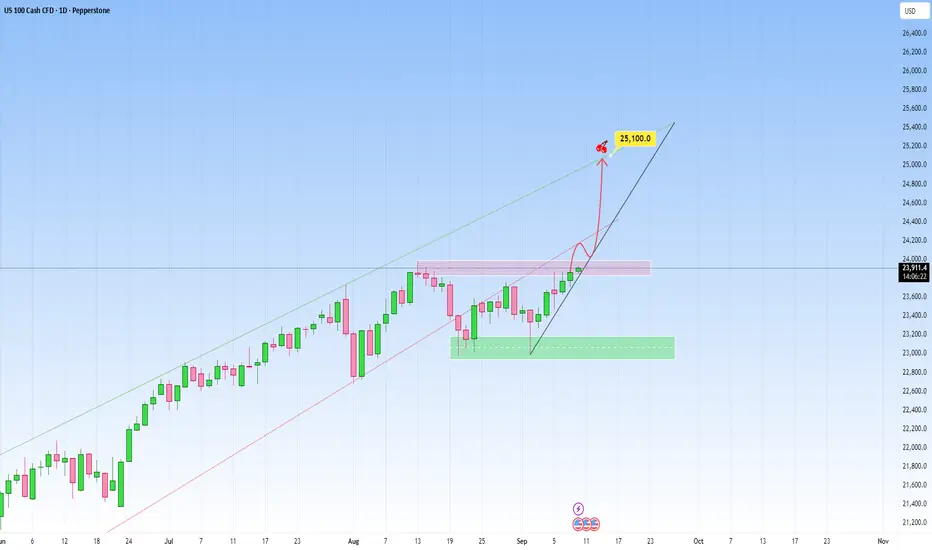
NAS100 Outlook: Recent rise has been steady!Market context on NAS100 remains bullish clearly. The most recent move saw a steady recovery, heading towards the upper boundary of the newly projected channel. And this right here is another great opportunity to get involved.
The market is likely in the early stages of a new impulsive leg to the upside right here.
We could also have short-term consolidation or pullback, then a continuation toward the upper boundary but I believe the latter is more plausible.
My target will be at 25,100.
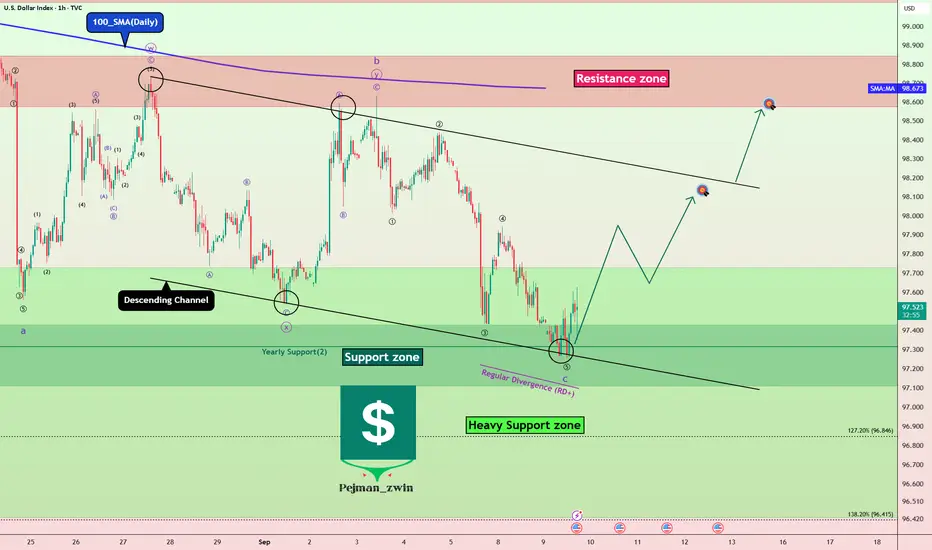
DXY at Major Support – Dollar Ready to Rebound?Today, I want to analyze the DXY index ( TVC:DXY ) for you. First, I must say that this week, US indexes can have an impact on the DXY index trend .
US indexes to be released this week:
Core PPI m/m: Tomorrow
PPI m/m: Tomorrow
Core CPI m/m: Thursday
CPI m/m: Thursday
CPI y/y: Thursday
Unemployment Claims: Thursday
Prelim UoM Consumer Sentiment: Friday
Prelim UoM Inflation Expectations: Friday
The DXY Index is currently moving near the Support zone($97.989-$97.834) , Yearly Support(2) , and the lower line of the descending channel .
In terms of Elliott Wave theory , it seems that the DXY index has managed to complete microwave 5 of the main wave C . The corrective structure is of the Zigzag Correction(ABC/5-3-5) type.
Also, we can see the Regular Divergence (RD+) between consecutive valleys .
I expect the DXY index to rise to at least $98.07(First Target) before the US indexes are announced.
Second Target: $98.56
Stop Loss(SL): $96.997
Note: With the DXY index rising, we can expect a correction in Gold( OANDA:XAUUSD ), Bitcoin( BINANCE:BTCUSDT ), and major Forex pairs (dollar strength).
Please respect each other's ideas and express them politely if you agree or disagree.
U.S. Dollar Index Analyze (DXYUSD), 1-hour time frame.
Be sure to follow the updated ideas.
Do not forget to put a Stop loss for your positions (For every position you want to open).
Please follow your strategy and updates; this is just my Idea, and I will gladly see your ideas in this post.
Please do not forget the ✅' like '✅ button 🙏😊 & Share it with your friends; thanks, and Trade safe.
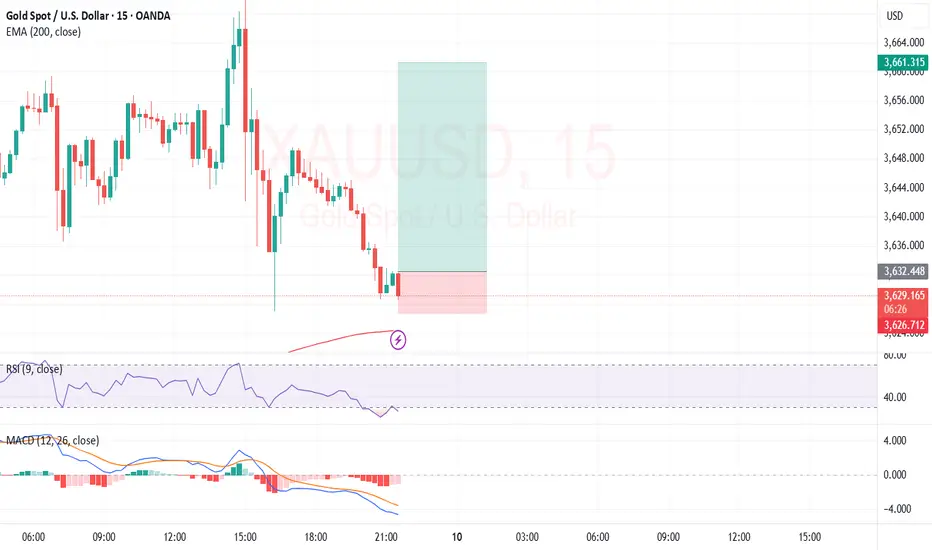
RSI + Morningstar-V + EMA DefendRSI coming up from a low of c.20%, variation Morningstar candle pattern printed. With the MACD starting to turn a bit, not as much as I would like, but bearish histo bars getting smaller. Also if price is going to respect EMA 200 this is it. If not we will be looking for bears later.
News still saying - record highs etc.
Put TP at end of FVG. SL below structure.
Nice 1:5 if it goes all the way.
Not A+ setup but pretty good.
US100 - New Highs are coming!Market Context
The US100 is trading within a strong bullish structure after bouncing from a well-defined support zone. Price has been respecting key levels on the way up, forming fair value gaps (FVGs) that act as stepping stones for continuation. The overall picture points to a market that is building momentum for a potential liquidity grab higher.
Support Zone & Initial Rally
The chart shows a strong support zone at the lows, which provided the foundation for the current bullish impulse. Once price tapped into this area, buyers stepped in aggressively, leaving behind multiple bullish imbalances on the way up. This confirms that institutional interest is present at these levels.
Fair Value Gaps & Structural Strength
On the rally, price created overlapping FVGs, including a bullish fair value gap and an inversion fair value gap (IFVG). Importantly, candles never closed below the primary FVG — reinforcing its validity as strong demand. This means that even if price retraces, these areas will be closely watched for re-entries.
Liquidity Grab & Next Move
Above current price action lies a clear buy-side liquidity (BSL) level. The market is likely to target this zone, either directly from current levels or after a retest into the stacked FVGs. A liquidity sweep above the highs would be the natural continuation of the bullish structure, unlocking the potential for new short-term highs.
Final Thoughts
The US100 is showing a textbook bullish setup: strong support, healthy retracements, and unmitigated FVGs acting as demand. As long as the lower support holds, the expectation remains for a run into the BSL above.
If this analysis brought value, drop a like — and let me know: are you waiting for the retest, or do you think the market runs the highs straight away?
