Complete system for Day & Swing TradersHey whats up traders,
Today Im going reveal simple but effective way to analyze and trade any markets - Stocks, Indices, Forex and Crypto. This thing works on everything because it's based on liquidity manipulations.
It's 100% mechanical structured aproach with fixed targets and defined. So unlike traders who trade various patterns and have on charts different patterns and diagonal subjective lines, you can backtest it and measure its and yours execution performance to get your statistical data for Risk Reward and Winning Ratio.
‼️Once you obtain such data from data sample large enough you will also solve biggest trading problems - FEAR, GREED and OVERTRADING. Why ?
📊 Because if you know you win rate is 60 - 70 % trades with RR 2.3 with aprox. 4 trades in a month per instrument, why would you then do following?
Try to look for trade every day when there is not your setup.
Fear open next trade after few losses?
Open huge gamble trade if you know 30% of trades can be loss
Try to hold for unrealistic target if you know most of your trades hit 2.5 RR
Try to pass prop challenge in one trade ?
... and many more psychological and undisciplined mistakes which discretional pattern traders without EDGE and statistical data about their strategy are doing.
🧠 Having mechanical system with backtested data is your EDGE.
💪 That is what makes you DISCIPLINED TRADER.
🧩 Basic Concept
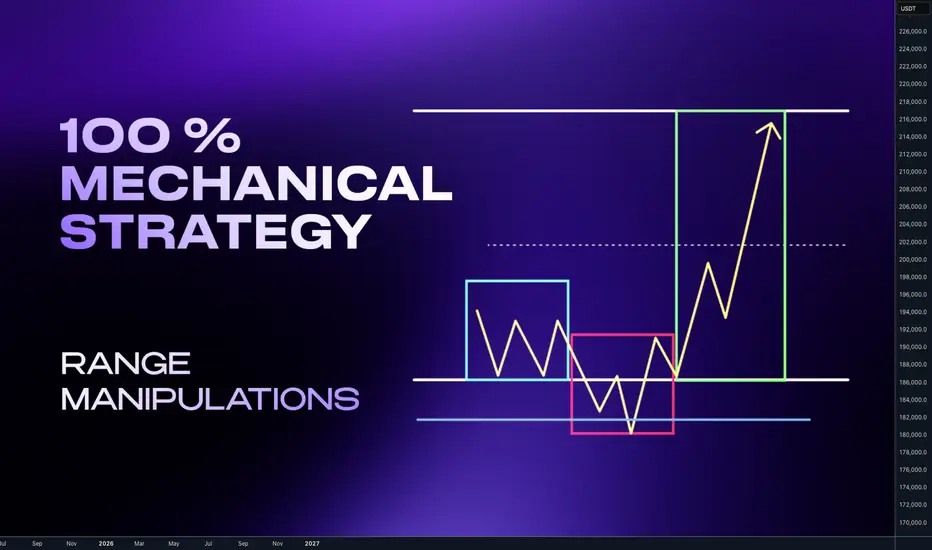
Im looking for the fake break out of the range. Whether we call it manipulation or Stop hunt. It really doesn't matter. The idea is that once big candle is created it creates fomo and break out traders are entering continuation. I trade against them.
📍Bullish continuation setups
Model 1 - Entry after manipulation - 50% target
Model 2 - Entry on pullback on level between 61.8 - 80% pullback
📍Bearish Continuation setups
Model 1 - Entry after manipulation - 50% target
Model 2 - Entry on pullback on level between 61.8 - 80% pullback
🧩 Manipulation phase
is key for this concept. Without it happening, institutional move cant happen. Why ? Market makers are not looking to stop hunt our stop losses. They dont care about your or mine stop losses even if we trade 100 lots. Most of the brokers are B-Book anyway. But they are seeking the liquidity and they are placed above the highs and lows. You dont even need to read order book or book map to know it. To understand liqudity better read this post below
Now you understand after the liquidity was swept. Big players have guns loaded and the move can start. This is what we want to participate. But !! What I have just shown you are patterns. Without adding them in to the right context with the market they will not have highest winning ratio. You must be selective. Basically you want to:
📍Down Trend - Trade Stop hunts above the highs
📍Up Trend - Trade Stop Hunt below the lows
In other words we want be buying lows and selling highs. 🧪 How to do it I explained in this post below 📍 Top- Down analysis
Before we go to the refined entries we must understand top down analysis and what to look for on the charts. Never start with LTF. You always must go with top Down analysis.
🧩 TOP Down analysis
HTF Timeframe for the trend
ITF - Timeframe - Ranges and Key Levels
LTF - Timeframe Profiling and entries
Once we analyze the trend define our range on our timeframe we are looking for manipulation before we go to entries remember this:
🧪Range is mostly created close the key level. If any candle close above the range - Its makes it invalid.
🧪We want see and trade wicks above the range, there you are looking for LTF entry.
📍 Bearish Scenario - (ITF view ) Price should not have candle close above the range on the same timeframe otherwise setup is invalidated and new range created. 📍 Bearish Scenario - (LTF view) - price (yellow has structured movements and should be crating AMD profiles on the edge of the range. We need to drop to LTF to read the structure. 📍 Bullish Scenario ITF view - Price should not have candle close below the range on the same timeframe otherwise setup is invalidated and new range created. 📍 Bullish Scenario - (LTF view) - price (yellow) has structured movements and should be crating AMD profiles on the edge of the range. We need to drop to LTF to read the structure. ‼️Note that Im always referring to the key level. It's called key level , because it's key for the success of the setup. Without it it will work only sometimes. This element must be part of the setup. I personally like the Order Block in other word Supply / Demand zone.
🧪 I have explained Order block in the post below Before we go to trade setup let's clarify timeframes again. Price is fractal you can basically trade this on any timeframes, but you still need to keep structure of 3 Timeframes.
🧩 Timeframe Alignments
🧪Short Term Trading
Trend - Monthly - Directional draw on liquidity
RangeS - Weekly - Stop hunts
AMD Profiles / Entries - H4/H1
🧪Swing Trading
Trend - Weekly - Directional draw on liquidity
Range - Daily - Stop hunts
AMD Profiles / Entries - H1/M15
🧪Day trading
Trend - Daily - Directional draw on liquidity
Range - H4 - Stop Hunts
AMD Profiles / Entries - M15/ M5
🧪Scalping
Trend - H4 - Directional draw on liquidity
Range - H1 - Stop hunts
AMD Profiles / Entries - M5/M1
🔥I recommend to trade daily and weekly ranges. Im not saying Day trading and Scalping is impossible. But Im sure none of us started trading for being isolated nerd behind the PC whole day stressing yourself about every minute. You want live social live and enjoy the freedom which trading can give you and mainly Daily and weekly ranges are higher probability.
🧩 AMD- Accumulation Manipulation Distribution
This is happening on the markets over and over. Everyone who trades profitably use it and if not they are not continuous about using it but they use it is what is necessary to move the market. And we want see It on the Edge of the range with confluence of the key level.
Community ideas
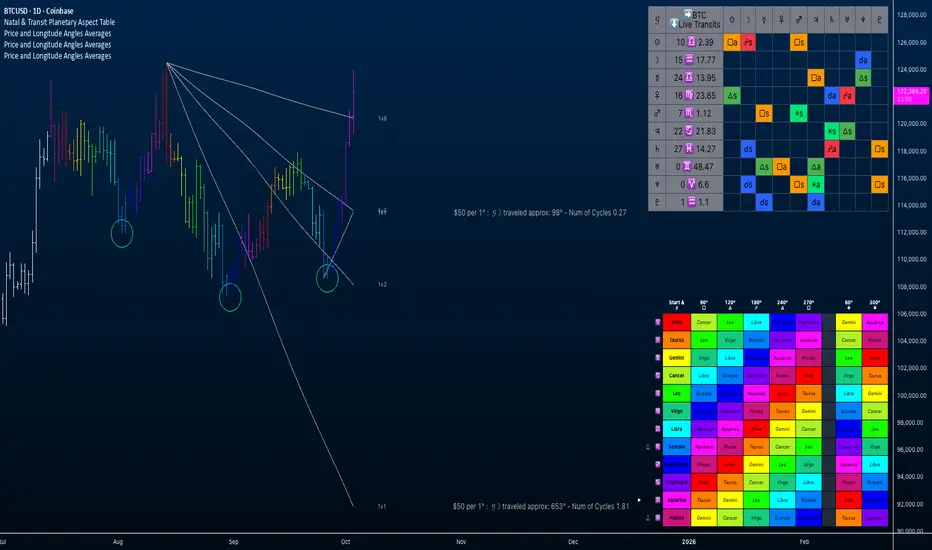
Bitcoin - Lunar Cycles and Price & Longitude AnglesEducational Idea
This chart integrates lunar cycles with price and longitude angles to illustrate how Bitcoin reacts to cyclical patterns. The purpose is educational: to show how these tools can be organized and analyzed, not to recommend taking long or short positions.
1. Bar Coloring by Lunar Cycle
* All bars begin as **white**.
* Once you anchor the price–longitude angles, the bars are colored based on the Moon’s longitude (0°–360°).
* In the indicator settings, you can toggle “Show/Hide Orbital Color” to switch this on or off.
*The colors correspond to the Longitude Relationship Table , specifically the first column , where the anchor sign is indicated alongside the start/conjunction symbol.
* This enables you to visually track the current bar alignment with the Moon’s progression through the zodiac.
* The table is read from the anchored bar, which establishes the starting reference.
* The white pointer tracks the Moon’s progression in relation to the anchor.
How to Read the Longitude Relationship Table
Anchor Sign (first column): Wherever you set your anchor bar, the anchor emoji will appear here next to the zodiac sign along this column.
Reading Across: Move across the row of that anchor sign to see the angular relationships it forms with other signs.
Color-Coding: Each aspect is color-coded to match the bar coloring (same scheme as the orbital coloring).
Example:
If the anchor is at Aries (♈︎) →
Cancer (♋︎, light green) is a 90° square from Aries.
Leo (♌︎, orange) is a 120° trine from Aries.
And so forth across the row.
This adds a layer of analysis that will be discussed in the future.
Observations:
* Over the last three swing lows, Bitcoin has dipped during the Scorpio → Sagittarius ingress. (Light blue to Dark Blue)
* Several pivot highs have appeared near the Pisces → Aries ingress.
* At present, the Moon is in Aquarius , placing us between these repeating zones.
---
2. Price–Longitude Angles
* $50/degree Moon angles from the all-time high (ATH) with price breaking over the 1 x 8 angle.
* A new fan anchored from the September 25th low, offering a second active set of angles.
---
3. How to Read the Natal vs Transit Aspect Table
Columns (across the top): Bitcoin’s natal planet positions from the Jan 3, 2009 first trade chart.
Rows (down the side): Current transit planet positions.
Cells (where row + column meet): Show the aspect between the transit planet and the natal planet.
Example: Today, Venus (transit row) is applying a conjunction to Bitcoin’s natal Saturn (column) — this is displayed as a blue cell with the conjunction symbol (☌a).
To read the table: follow left to right across the row of the current transit planet, and compare against the natal planet columns.
---
Takeaway
* The Moon’s cycle(~27–28 days) has coincided closely with recent highs and lows.
* Anchored price–longitude angles give additional structure, tying price back to both historic (ATH) and more recent (Sept 25) pivots.
* Bar coloring provides a direct visual cue for where the price sits in relation to the Moon’s orbital cycle, guided by the longitude relationship table.
* These methods are not directional calls — they’re tools for understanding cyclical context in the market.
Stop Losses: The Good, The Bad and The UglyLet’s be honest — few things trigger more emotion in trading than a stop loss being hit.
But not all stop losses are created equal.
Even though the title says “The Good, the Bad, and the Ugly”, let’s start with the Bad — because that’s where most traders get stuck.
________________________________________
🚫 The Bad Stop Loss
The bad stop loss is the arbitrary one.
You know the type:
“I trade with a 50-pip stop loss.”
“My stop is always 1% below entry.”
No matter what the chart looks like.
No matter what the volatility of the asset is.
No matter if you’re trading Gold, EurUsd, or Nasdaq.
This kind of stop loss doesn’t respect market structure or context — it’s just a random number.
You might get lucky a few times, but over the long run, it’s a losing game.
If your stop loss doesn’t make sense on the chart, then it doesn’t make sense in the market either.
There’s no nuance here — it’s bad, period.
________________________________________
✅ The Good Stop Loss
The good stop loss is strategic.
It’s placed based on structure, volatility, and logic — not habit or emotion.
You define it after you’ve studied:
• Where invalidation occurs on your idea
• The volatility range of the asset
• The natural “breathing room” of the market
When this kind of stop loss is hit, it’s not a tragedy.
It’s information.
It means your prediction was wrong.
You expected the market to go up, but it went down — simple as that.
No panic. No revenge trading.
You step away, clear your mind, and wait until the next day.
Then, you redo your analysis without bias.
If the new structure confirms that the market has truly flipped direction — then, and only then, you can trade the opposite way.
That’s professionalism.
That’s how you stay consistent.
________________________________________
😬 The Ugly Stop Loss
Now, this one hurts.
The ugly stop loss is the good stop loss that gets hit… and then the market reverses immediately.
You were right — but your stop was just a little too tight.
That’s the emotional pain every trader knows.
But here’s the key:
This situation only counts as ugly if your original stop loss was good — meaning, logical and based on structure.
If it was arbitrary, then it’s not ugly — it’s just bad.
So, what do we do when a good stop loss turns ugly?
We do exactly the same thing:
• Wait until the next day.
• Reanalyze the chart with fresh eyes.
• If the setup is still valid, re-enter in the original direction.
It’s rare for both the first and second stop to be “hunted.”
Patience gives you clarity — and clarity gives you edge.
________________________________________
💭 Final Thoughts
Stop losses aren’t just a risk tool — they’re a psychological mirror.
They reveal whether you trade with emotion or with structure.
The bad stop loss shows a lack of respect for the market.
The good stop loss shows discipline and logic.
The ugly one shows that even good decisions can lead to short-term pain.
But pain is not failure — it’s feedback.
So the next time your stop gets hit, don’t see it as punishment.
See it as a test of your ability to stay rational when the market challenges you.
Because in the long run, consistency doesn’t come from winning every trade.
It comes from handling the losing ones correctly. ⚖️

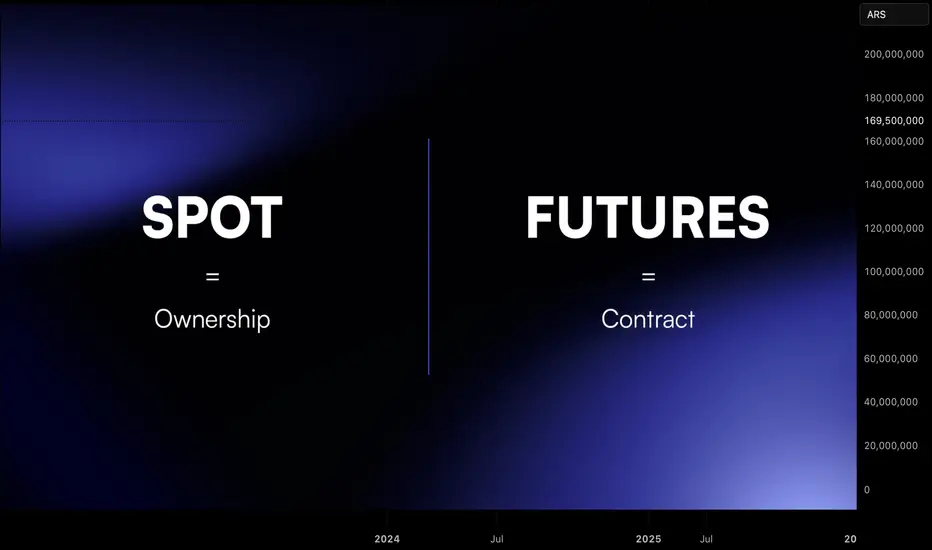
Futures vs Spot: What Traders Need to Know1. Introduction
In crypto, two of the most common ways to trade are spot markets and futures markets.
Both can be profitable, but they operate differently and knowing the differences is critical for survival.
Spot trading is straightforward: you buy the asset, you own it.
Futures trading is more complex: you speculate on the asset’s price without actually owning it.
This guide explains the differences, benefits, and risks of each so you can decide which suits your style.
2. What Is Spot Trading?
Spot trading is simple. You buy the asset, you own it.
There is no leverage. You pay the full price.
Profit and loss move one-to-one with the asset’s price.
Pros
Simple to understand.
No liquidation risk.
Can benefit from staking or long-term custody.
Cons
Limited upside with small capital.
Cannot profit when the market falls.
3. What Is Futures Trading?
Futures are contracts. You do not own the asset, only exposure to its price.
They allow leverage, often up to 10x or more.
You can go long to profit from rising markets or short to profit from falling ones.
Contracts can have expiry dates or be perpetual.
Pros
Flexibility to trade both directions.
Efficient capital use with leverage.
Useful for hedging spot positions.
Cons
Liquidation risk.
Complex funding fees on perpetuals.
Temptation to overtrade.
4. Key Differences: Spot vs Futures
Spot = You own the asset.
Futures = You own a contract.
Spot = No leverage.
Futures = High leverage possible.
Spot = Profits only when price rises.
Futures = Profits when price rises or falls.
Spot = Best for beginners and investors.
Futures = Best for experienced traders and hedgers.
Spot = simplicity. Futures = flexibility, but higher risk.
5. Why Futures Can Be Risky
Leverage is attractive, but it cuts both ways:
A 10 percent drop with 10x leverage equals a 100 percent account loss.
Liquidations close positions automatically if collateral is too low.
6. When to Use Spot vs Futures
Use spot if you want to own crypto long-term.
Use spot if you prefer simplicity and no liquidation stress.
Use futures if you want to hedge your holdings.
Use futures if you need market exposure with limited capital.
Use futures only if you have strict discipline and risk control.
7. Combining Spot and Futures
Many professionals use both:
Hold spot ETH as a long-term investment.
Use futures shorts to hedge during downturns.
This balances long-term conviction with short-term protection.
Think of it like insurance: futures protect spot positions when markets get volatile.
8. Risk Management Is the Deciding Factor
Whether you trade spot or futures, risk management decides survival:
In spot: limit allocation per asset.
In futures: control leverage, set stop losses, and manage liquidation risk.
In both: size positions by account % risk.
Without a risk plan, futures become gambling and even spot can lead to poor results.
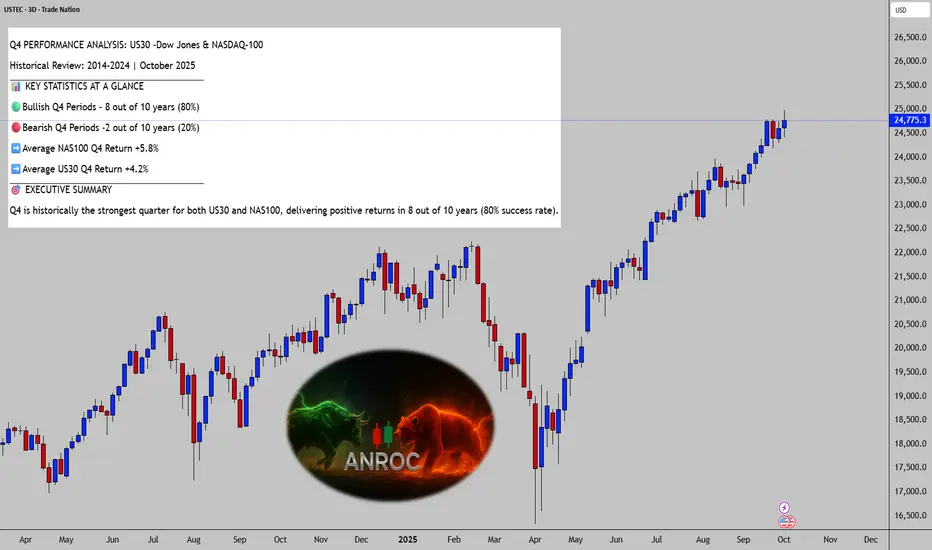
10 Year Q4 Performance Review - NAS100 & US30📊Q4 PERFORMANCE ANALYSIS: US30 & NAS100
═══════════════════════════════════════════════
Historical Review 2014-2024 | October 2025
KEY STATISTICS AT A GLANCE
──────────────────────────────────────
• Bullish Q4 Periods: 8 out of 10 years (80%)
• Bearish Q4 Periods: 2 out of 10 years (20%)
• Average NAS100 Q4 Return: +5.8%
• Average US30 Q4 Return: +4.2%
━━━━━━━━━━━━━━━━━━━━━━━━━━━━━━━━━━━━━━━━━━
EXECUTIVE SUMMARY
──────────────────────────────────────
Q4 is historically the strongest quarter for both US30 and NAS100, delivering positive returns in 8 out of 10 years (80% success rate).
Key Findings:
──────────────────────────────────────
• The NASDAQ-100 consistently outperforms the Dow Jones by an average of +1.6%
• Technology sector leadership drives superior Q4 momentum in NAS100
• Only two bearish Q4 periods: 2018 (Fed tightening) and 2015 (rate hike fears)
• Both bearish periods were driven by central bank policy concerns
━━━━━━━━━━━━━━━━━━━━━━━━━━━━━━━━━━━━━━━━━━━
↕️PERFORMANCE COMPARISON
US30 (Dow Jones Industrial Average)
──────────────────────────────────────
• Bullish Q4s: 8 out of 10 years
• Average Q4 Return: +4.2%
• Best Q4: +15.4% (2022)
• Worst Q4: -11.3% (2018)
NAS100 (NASDAQ-100)
──────────────────────────────────────
• Bullish Q4s: 8 out of 10 years
• Average Q4 Return: +5.8%
• Best Q4: +15.5% (2020)
• Worst Q4: -15.1% (2018)
━━━━━━━━━━━━━━━━━━━━━━━━━━━━━━━━━━━━━━━━━━━
YEAR-BY-YEAR BREAKDOWN
──────────────────────────────────────
Q4 2024 - BULLISH ✅
──────────────────────────────────────
• US30: +6.2%
• NAS100: +8.1%
• Key Driver: AI optimism & Fed rate cuts, post-election rally momentum
Q4 2023 - BULLISH ✅ (STRONGEST QUARTER)
──────────────────────────────────────
• US30: +12.5%
• NAS100: +14.2%
• Key Driver: Inflation cooling significantly, Fed pivot expectations, one of strongest Q4s in history
Q4 2022 - BULLISH ✅
──────────────────────────────────────
• US30: +15.4%
• NAS100: +2.2%
• Key Driver: Relief rally from oversold conditions, peak inflation fears subsiding
Q4 2021 - BULLISH ✅
──────────────────────────────────────
• US30: +5.4%
• NAS100: +8.3%
• Key Driver: Economic reopening momentum, strong corporate earnings
Q4 2020 - BULLISH ✅
──────────────────────────────────────
• US30: +10.2%
• NAS100: +15.5%
• Key Driver: COVID vaccine announcements, massive fiscal stimulus, tech sector leadership
Q4 2019 - BULLISH ✅
──────────────────────────────────────
• US30: +5.7%
• NAS100: +12.2%
• Key Driver: US-China trade deal optimism, accommodative Fed policy
Q4 2018 - BEARISH ❌ (WORST QUARTER)
──────────────────────────────────────
• US30: -11.3%
• NAS100: -15.1%
• Key Driver: Aggressive Fed tightening, trade war escalation, worst December since Great Depression
Q4 2017 - BULLISH ✅
──────────────────────────────────────
• US30: +10.3%
• NAS100: +9.8%
• Key Driver: Tax Cuts and Jobs Act, strong global growth
Q4 2016 - BULLISH ✅
──────────────────────────────────────
• US30: +8.7%
• NAS100: +1.3%
• Key Driver: Trump election rally, infrastructure spending expectations
Q4 2015 - BEARISH ❌
──────────────────────────────────────
• US30: -1.7%
• NAS100: -2.1%
• Key Driver: First Fed rate hike since 2006, China slowdown concerns
Q4 2014 - BULLISH ✅
──────────────────────────────────────
• US30: +4.8%
• NAS100: +8.2%
• Key Driver: Oil price decline benefiting consumers, ECB stimulus expectations
━━━━━━━━━━━━━━━━━━━━━━━━━━━━━━━━━━━━━━━━━━━
WHY Q4 IS HISTORICALLY BULLISH
──────────────────────────────────────
📊Six Key Seasonal Factors:
1. Santa Claus Rally
──────────────────────────────────────
• Traditional year-end optimism and positive sentiment
• Portfolio positioning for new year creates buying pressure
2. Holiday Shopping Season
──────────────────────────────────────
• Positive retail sales impact consumer stocks
• Strong economic activity indicators boost market confidence
3. Tax-Loss Harvesting
──────────────────────────────────────
• Creates buying opportunities in early Q4
• Strategic positioning by investors leads to increased volume
4. Window Dressing
──────────────────────────────────────
• Fund managers position portfolios for year-end reports
• Institutional buying pressure supports prices
5. Bonus Season
──────────────────────────────────────
• Wall Street bonuses drive investment activity
• Increased capital deployment in December
6. New Year Capital Inflows
──────────────────────────────────────
• Fresh investment allocations from pension funds and institutions
• Renewed market optimism for upcoming year
━━━━━━━━━━━━━━━━━━━━━━━━━━━━━━━━━━━━━━━━━━
🚨CRITICAL RISK LESSONS➡️
The 2018 Exception: Fed Policy Override
──────────────────────────────────────
Q4 2018 demonstrated that central bank policy errors can completely override seasonal patterns.
• The Federal Reserve's aggressive rate hiking into slowing growth triggered an 11-15% decline in both indices
• Trade war escalation compounded market concerns
• Critical reminder that macro policy is paramount and can overwhelm even the strongest seasonal tendencies
• Key Lesson: Always monitor Federal Reserve policy - aggressive tightening into economic weakness is the primary risk factor
🟧The 2015 Warning: Rate Hike Anxiety
──────────────────────────────────────
The first rate normalization in nearly a decade created mild bearish pressure in Q4 2015.
• Market anxiety about Fed policy transition combined with China economic slowdown fears
• Emerging market currency crises added pressure
• While less severe than 2018, shows that even minor negative Q4s are typically policy-driven
• Key Lesson: Major policy transitions create uncertainty that can disrupt seasonal patterns
━━━━━━━━━━━━━━━━━━━━━━━━━━━━━━━━━━━━━━━━━━━
PROBABILITY METRICS
──────────────────────────────────────
• Positive Q4 Probability: 80%
• Q4 Return Greater Than 5% Probability: 60%
• Q4 Return Greater Than 10% Probability: 30%
• Negative Q4 Probability: 20%
• Median Q4 Return for US30: +5.6%
• Median Q4 Return for NAS100: +8.2%
━━━━━━━━━━━━━━━━━━━━━━━━━━━━━━━━━━━━━━━━━━
✅STRATEGIC TRADING IMPLICATIONS
For Long-Term Investors
──────────────────────────────────────
The 80%-win rate strongly favors staying invested through Q4. Historical data supports maintaining core positions despite volatility.
Action Items:
──────────────────────────────────────
• Maintain long positions through year-end
• Use October dips for adding exposure
• Avoid panic selling during temporary pullbacks
• Focus on 80% probability of positive returns
🎯For Active Traders
──────────────────────────────────────
Position for the Santa Claus rally into December.
NAS100 offers higher upside potential with +1.6% average outperformance over US30.
Action Items:
──────────────────────────────────────
• Build positions in late October/early November
• Favor NAS100 for higher growth potential
• Watch Fed commentary and rate decisions closely
• Take profits in late December during peak rally
🚨Risk Management Protocol
──────────────────────────────────────
Respect the 20% failure rate demonstrated in 2018 and 2015.
Implement stop-losses to protect against policy-driven reversals.
Action Items:
──────────────────────────────────────
• Set stop-losses at 5-7% below entry
• Monitor Fed policy statements weekly
• Don't over-leverage despite high win rate
• Be prepared to exit if policy turns aggressive
━━━━━━━━━━━━━━━━━━━━━━━━━━━━━━━━━━━━━━━━━━━
💡KEY INSIGHTS & PATTERNS
NAS100 Outperformance Dominance
──────────────────────────────────────
• NASDAQ-100 outperformed US30 in 7 out of 10 Q4 periods (70% of the time)
• Technology leadership consistently drives momentum during year-end rallies
• Average outperformance of +1.6% makes NAS100 the superior choice for growth-oriented Q4 positioning
Volatility Evolution
──────────────────────────────────────
• Recent years show significantly increased Q4 volatility compared to 2014-2019
• Lower volatility periods: 2014, 2015, 2016, 2017, 2019, 2021
• Higher volatility periods: 2018, 2020, 2022, 2023, 2024
• Macro uncertainty and policy shifts driving larger price swings
Monthly Breakdown Patterns
──────────────────────────────────────
• October:
Mixed performance, often volatile - historical "October effect" creates nervousness but also buying opportunities
• November:
Typically, the strongest month of Q4 - Thanksgiving week rally is common, lowest volatility of the quarter
• December:
Generally positive, especially second half - Santa Claus rally peaks in final two weeks, year-end window dressing drives gains
━━━━━━━━━━━━━━━━━━━━━━━━━━━━━━━━━━━━━━━━━━━
🆗NAS100 VS US30: WHICH TO TRADE?
Choose NAS100 If:
──────────────────────────────────────
• Seeking maximum upside potential (+5.8% average vs +4.2%)
• Technology sector exposure aligns with market trends
• Comfortable with higher volatility
• Trading shorter-term for quick gains
• Focused on growth over value
Choose US30 If:
──────────────────────────────────────
• Seeking more stable, defensive positioning
• Prefer blue-chip industrial exposure
• Lower volatility tolerance
• Longer-term holding period
• Economic reopening themes more important
✅Optimal Strategy:
──────────────────────────────────────
• Split allocation 60% NAS100 / 40% US30 to capture NAS100 upside while maintaining US30 stability
━━━━━━━━━━━━━━━━━━━━━━━━━━━━━━━━━━━━━━━━━━━
THE VERDICT
──────────────────────────────────────
📊🟢Q4 has been PREDOMINANTLY BULLISH with an 80% success rate over the past decade.
🏅The Five Critical Takeaways:
──────────────────────────────────────
• Historical Edge Exists: 80% win rate provides clear statistical advantage for bullish positioning
• NAS100 is Superior: Average return of +5.8% vs +4.2% for US30 makes NASDAQ-100 the better choice
• Seasonality Creates Support: Six structural factors (Santa Rally, bonuses, window dressing, etc.) provide fundamental buying pressure
• Fed Policy is the Wildcard: 2018 demonstrates central bank mistakes can override all seasonal patterns - this is the primary risk
• Risk Management is Essential: 20% failure rate means stops and position sizing remain critical despite favorable odds
Strategic Conclusion:
──────────────────────────────────────
Leverage the statistical edge while maintaining robust risk management protocols.
Q4 offers one of the most reliable bullish periods in the calendar year, but investors must remain vigilant for Federal Reserve policy mistakes that can completely override seasonal patterns.
The combination of year-end fund flows, holiday optimism, and institutional window dressing creates a structurally supportive environment that has delivered consistent results for the past decade.
Bottom Line:
──────────────────────────────────────
• Be bullish but not reckless
• The odds favor upside, but the 2018 exception proves nothing is guaranteed
━━━━━━━━━━━━━━━━━━━━━━━━━━━━━━━━━━━━━━━━━━
✅🎯CURRENT OUTLOOK FOR Q4 2025
──────────────────────────────────────
Bullish Catalysts
──────────────────────────────────────
• Historical 80% win rate provides statistical edge
• Potential Fed easing cycle continuation into year-end
• Year-end positioning and institutional fund flows
• Technology sector AI innovation momentum continuing
• Strong YTD performance creates positive momentum
Bearish Risks
──────────────────────────────────────
• Elevated valuations following strong year-to-date gains
• Geopolitical uncertainties remain elevated
• Potential Federal Reserve policy pivot or hawkish surprises
• Economic growth deceleration signals emerging
• October seasonal volatility could trigger profit-taking
Most Likely Scenario
──────────────────────────────────────
• Based on historical patterns and current conditions, Q4 2025 has approximately 70-80% probability of positive returns
• Key monitoring points: Fed policy statements, inflation data releases, and October volatility levels
• If October sees a pullback, it likely represents a buying opportunity for year-end rally
━━━━━━━━━━━━━━━━━━━━━━━━━━━━━━━━━━━━━━━━━━
Analysis Period:
──────────────────────────────────────
• Q4 2014 through Q4 2024 (10 complete years)
Calculation Method:
──────────────────────────────────────
• Quarterly returns calculated from September 30 closing price to December 31 closing price each year
• Total return basis including dividends where applicable
Data Sources:
──────────────────────────────────────
• Federal Reserve Economic Data (FRED)
• Major financial data providers and exchanges
• Historical index data verified across multiple sources
• All percentages rounded to one decimal place for clarity
Quality Control:
──────────────────────────────────────
• All data cross-referenced with at least two independent sources to ensure accuracy
• Any discrepancies investigated and resolved before inclusion
━━━━━━━━━━━━━━━━━━━━━━━━━━━━━━━━━━━━━━━━━━
⚠️IMPORTANT DISCLAIMERS
Past Performance Warning:
──────────────────────────────────────
• Past performance does not guarantee future results
• The 80% historical win rate does not ensure Q4 2025 will be positive
Not Financial Advice:
──────────────────────────────────────
• This analysis is for informational and educational purposes only
• It should not be construed as investment advice, financial advice, trading advice, or a recommendation to buy or sell any security
Risk Disclosure:
──────────────────────────────────────
• Trading and investing involve substantial risk of loss
• All investors should conduct their own research and consult with qualified financial advisors before making investment decisions
No Guarantees:
──────────────────────────────────────
• While historical patterns provide valuable context, markets can and do behave unpredictably
• The 2018 Q4 collapse demonstrates that even strong seasonal patterns can fail
Use At Your Own Risk:
──────────────────────────────────────
• Any trading or investment decisions made based on this analysis are solely the responsibility of the individual trader/investor
━━━━━━━━━━━━━━━━━━━━━━━━━━━━━━━━━━━━━━━━━━
FINAL THOUGHTS
──────────────────────────────────────
Q4 has proven to be one of the most reliable bullish periods in the market calendar. The combination of seasonal factors, institutional positioning, and year-end optimism creates a powerful tailwind that has delivered positive returns 80% of the time over the past decade.
However, the 2018 exception serves as a sobering reminder that Federal Reserve policy errors can override even the strongest seasonal patterns. Aggressive monetary tightening into slowing growth represents the primary risk factor that traders must monitor vigilantly.
For those willing to respect both the opportunity and the risk, Q4 offers one of the best risk-reward setups of the calendar year. Position accordingly, manage risk diligently, and let the probabilities work in your favor.
The market rewards preparation. This analysis provides the preparation. Execution is up to you.
━━━━━━━━━━━━━━━━━━━━━━━━━━━━━━━━━━━━━━━━━━━
Report Prepared: October 2025
Analysis Coverage: 10 Years of Q4 Performance Data
Indices Analyzed: US30 (Dow Jones) & NAS100 (NASDAQ-100)
🎯Primary Finding: Q4 is 80% bullish with NAS100 outperforming
━━━━━━━━━━━━━━━━━━━━━━━━━━━━━━━━━━━━━━━━━━━
End of Report
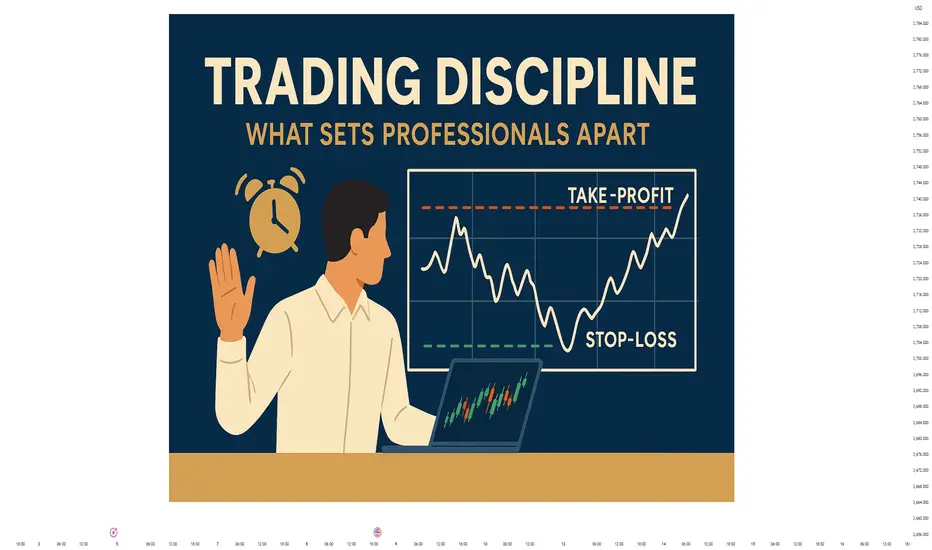
Trading Discipline – The Defining Edge of Professional TradersIn Forex and Gold trading, there is one truth every trader eventually learns: discipline matters more than strategy.
A simple system executed with discipline can deliver consistent results.
A brilliant system without discipline will collapse under pressure.
🧠 Stop-loss & Take-profit – Your Survival Tools
Stop-loss: Not surrender, but capital protection.
Take-profit: Not prediction, but securing gains before greed erodes them.
👉 Rule of pros: Set SL/TP before entering a trade – and never move them out of fear or hope.
📊 Case Study: Discipline vs Emotion
Undisciplined trader: Moves stop-loss further when price goes against him. Small loss turns into account damage.
Disciplined trader: Keeps stop-loss intact, loses 1%. Over 20 trades, system edge delivers net profits.
➡️ Lose small to win big.
🚀 Habits That Build Discipline
Have a trading plan: Entry rules – SL – TP – risk – time frame.
Use alerts: Reduce stress, stop staring at charts.
Walk away after entry: Don’t let emotions interfere.
Fixed risk: 1–2% per trade, no exceptions.
Keep a trading journal: Track not only results but emotions behind decisions.
🏆 Why Discipline Separates Pros from Amateurs
Amateurs let the market control them.
Professionals control themselves.
In the long run, success doesn’t come from one “perfect trade” but from hundreds of disciplined executions.
📈 Conclusion
The market is uncontrollable. But you can control yourself.
Discipline is the edge that:
Protects your capital.
Stabilizes your mindset.
Turns strategy into consistent results.
👉 Have you ever broken your stop-loss or take-profit rules? What did it teach you about discipline?
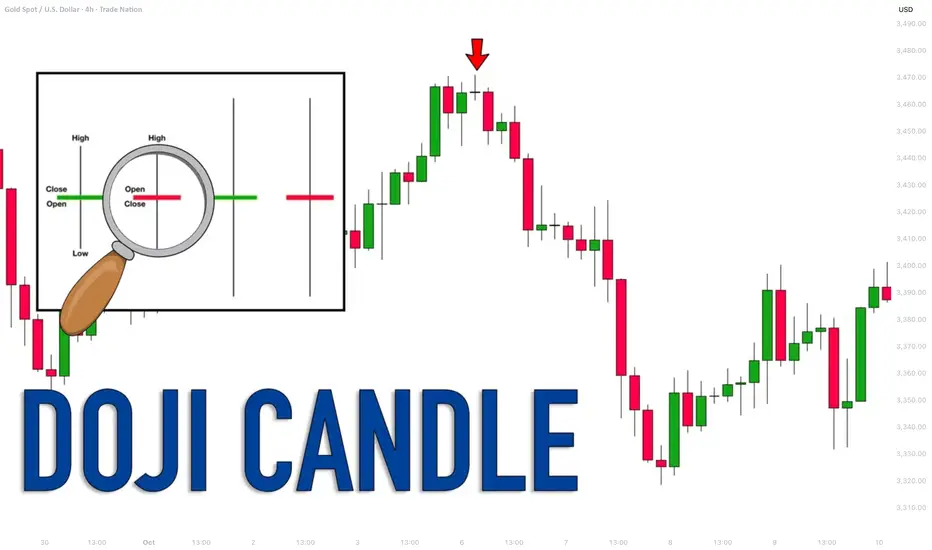
Learn Profitable Doji Candle Trading Strategy (GOLD, FOREX)
In the today's post, I will share my Doji Candle trading strategy.
This strategy combines the elements of multiple time frame analysis, price action and key levels.
Step 1
Analyze key levels on a daily time frame.
Identify vertical and horizontal supports and resistances.
Here are the key structures that I spotted on AUDUSD.
Step 2
Look for a formation Doji Candle on a key structure.
This rule is crucially important: we will trade only the Doji candles that are formed on key levels.
From key supports , we will look for buying , and we will look for shorting from key resistances .
Look at this Doji Candle that was formed on a key daily support on AUDUSD.
Step 3
Look for a horizontal range on a 4h/1h time frames.
Doji Candle signifies indecision . Quite often, you will notice the horizontal ranges on lower time frames when this candlestick is formed.
Here is a horizontal range that was formed on a 4H time frame on AUDUSD after a formation of Doji.
Step 4
Look for a breakout of the range.
To sell from a key resistance, we will need a bearish breakout of the support of the range. That will be our bearish confirmation.
To buy from a key support, we will need a bullish breakout of the resistance of the range. It will be our bullish signal.
Here is a confirmed breakout of the resistance of the range with a 4H candle close above. That is our bullish confirmation on AUDUSD.
Step 5
Buy aggressively or on a retest.
After you spotted a confirmed breakout of the range, open a trading position aggressively or on a retest.
Personally, I prefer trading on a retest.
If you sell, a stop loss should be above the high of the range and your target should be the closest key daily support.
If you buy, your stop loss should be below the low of the range and a take profit will be on the closest daily resistance.
On AUDUSD, a long position was opened on a retest. Stop loss is lying below the lows. Take profit is the closest resistance.
Here is how this great strategy works!
Always patiently wait for a confirmation! That is your key to successful trading Doji Candle.
❤️Please, support my work with like, thank you!❤️
I am part of Trade Nation's Influencer program and receive a monthly fee for using their TradingView charts in my analysis.
Order Blocks: Where Smart Money Leaves Its Footprints“The market doesn’t move randomly.
Every big push leaves a shadow — a clue of who was in control.”
That clue is what traders call an Order Block .
What is an Order Block?
An Order Block (OB) is the last bullish or bearish candle before a strong impulsive move in the opposite direction.
Think of it as the area where institutions placed their orders to fuel that move.
In an uptrend , look for the last down candle before a strong rally.
In a downtrend , look for the last up candle before a sharp drop.
These zones often act like magnets — price revisits them to “retest” before continuing.
Why Do Order Blocks Matter?
They reveal where the big money entered.
They create high-probability zones for entries.
They help traders avoid chasing moves at highs or lows.
How to Spot an Order Block
Identify a strong impulsive move (long-bodied candles, clear displacement).
Mark the last opposite candle before that move.
Wait for price to return to that zone.
Look for LTF confirmation — a ChoCH, BOS, or rejection wick.
Align with higher timeframe bias (H4/H1) for best results.
Example
Refer to the XAUUSD M15 chart above:
Gold formed a strong bullish rally, leaving behind a bullish order block zone at 3764.5 – 3757.5 .
When price retraced into this OB, it tapped liquidity from the stop area, then gave LTF confirmation (micro structure shift).
This long setup delivered an impressive 1:8 RR rally for disciplined traders who waited for the OB mitigation and entry confirmation.
Smart money doesn’t chase price — it waits for the market to come back home.
But here’s the secret most traders miss:
Order blocks alone are never the full story.
They work best when combined with liquidity sweeps, structure shifts, and precise timing .
That’s where the deeper edge lies — and it’s what separates surface-level knowledge from mastery.
📘 Shared by @ChartIsMirror

Trading : Lesson 3 -> Solid StructureIn this lesson we discuss the concept of solid structure, its benifits for stop loss placement and to avoid engaging with solid structure in terms of take profit levels.

TA Never Fails, But Traders Often Do
Why Technical Analysis Doesn’t Fail, and How to Make It Work for You
Has it ever happened to you that your system or technical analysis gives you the perfect signal… and the trade still goes wrong? And then, other times, with the exact same pattern, everything clicks magically and you end up with textbook profits, the kind proudly posted on social media.
Every trader has felt that same confusion at some point. At some stage in their career, every trader has questioned whether technical analysis really works. And if that question still lingers unanswered in your mind, this post is for you.
Here, I’ll walk you through why technical analysis sometimes seems to work like magic and other times fails miserably, and, more importantly, how understanding its true role can turn it into a tool that meaningfully strengthens your trading
Understanding the Real Role and Reach of Technical Analysis
At its core, technical analysis (TA) studies past price and volume behavior. But here’s the key point many overlook: expecting it to predict the future with certainty is like assuming that because something happened under certain conditions once, it will play out exactly the same way again. That’s rarely true.
When you rely on a chart pattern or setup, what you’re really hoping for is that the market environment hasn’t changed much. But markets don’t stay still. They are dynamic, adaptive, and constantly shifting. That’s why sometimes the “perfect” signal delivers textbook profits… and other times it collapses into a loss.
I’m sure you can relate: you spot the perfect setup, take the trade with full confidence, everything looks aligned, and then Powell makes a comment, volatility spikes, and your stop is hit in seconds. Did technical analysis fail? Not really. The conditions changed, and the past environment could not be reproduced.
From this perspective, TA stops being a deterministic tool (“if price breaks support, the market will fall”) and becomes a probabilistic one (“if price breaks support, there’s a certain probability the market will fall”). This isn’t a weakness, it’s an honest recognition of the uncertainty that governs financial markets and their ever changing nature.
When we strip away the myths and put technical analysis in its rightful place, it becomes clear: at best, TA allows us to frame probabilities, never certainties. It’s not a crystal ball, it’s a framework for making informed probabilistic assessments in a world that will always remain uncertain.
Where the True Power of TA Really Lies
Take the classic example: “if price breaks support, the market has a higher probability of falling than of rising.” That statement doesn’t promise certainty, but if it turns out that, say, 60% of the time the market does fall after breaking support, then you’ve uncovered something valuable: an edge.
And here’s where trading shifts from chasing luck to building consistency. If out of every 10 trades, 6 follow through in your favor, then all you really need is solid risk management, for example, keeping a minimum 1:1 risk to reward ratio. Do that, and over the long run you don’t just “sometimes win,” you run a system with a positive expectancy.
Once you’ve found that edge, the real trick is repetition. And this isn’t just motivational talk, it’s math. Statistics has a law (and in science, a law means tested truth) that guarantees the more you repeat your process, the closer your actual results will move toward that expected 60/40 edge. With discipline and patience, the math will always pull you back toward being a long term winner.
This also means you don’t second guess yourself the next time the market breaks support just because the last time it didn’t work out (thanks, Powell). You keep playing your probabilistic edge. The outcome of a single trade is irrelevant, what matters is the process repeated over time. I wrote about this earlier, and it’s worth remembering: consistency in applying your edge always beats obsessing over one result.
TA as a Compass, Not a Crystal Ball
The smartest and most effective use of technical analysis is not to predict exact prices, but to build a probabilistic edge.
TA only becomes truly powerful when it’s integrated into a system with positive expectancy, not when it’s treated like an oracle. It’s not about guessing where the next tick will land, but about shaping a repeatable process that, over time, compounds into long term gains.
Seen in this light, TA stops being a magic wand and instead becomes a compass, a steady guide to help you navigate with consistency. You don’t need to know the exact shape of every curve in the road. What you need is a reliable compass and a clear map that, with enough repetition, will get you to your destination.
How to Make TA Not Fail You
The key takeaway is simple: the problem isn’t that technical analysis “fails,” but how we interpret it and what we expect from it. Demanding certainty only leads to frustration and blinds us to its real value.
Used probabilistically and as part of a structured system, TA becomes a valuable ally. So the next time that ‘perfect setup’ fails, don’t waste energy asking what went wrong. You already know, it’s just uncertainty doing its job. Don’t let it shake your confidence, and don’t let Powell, or anything else, ruin your day. Instead, focus on the next repetition, because that’s where your edge truly lives.
The market doesn’t owe you certainty. But with an edge and discipline, probability will reward you with consistency, and that’s what compounds into real results
________
👉 If you’d like to dig deeper into this mindset shift, check out my earlier post on True Laser Vision, where I explain why projecting the value of your account is infinitely more powerful than trying to project the price of an asset. And if you’d like a more structured walk through these ideas, visit my profile, you’ll find plenty of posts where I break down how probability, expectancy, and discipline can catapult your trading to the next level. Follow along if you want to keep sharpening these skills
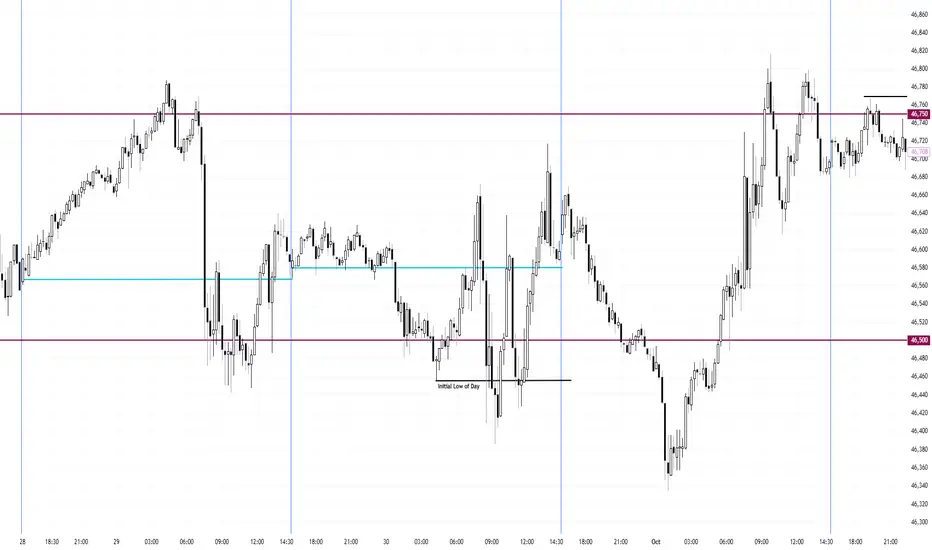
Daytrading Setup NY High of Day Dump Buy Low of Day TutorialOne of my favorite setups that I love to trade is the range day's New York High of Day dump buying Low of Day. This setup does not require ANY "top down" analysis and only requires the 15-minute chart. All you need is to wait a couple hours after NY opened and run its course.
By waiting, you accomplish a few things
1. Avoid getting faked out
2. Get to see the day's ATR
3. Ability to calculate the day's position size better
4. Buy near the low of day, targeting the full daily range
Below is the setup and the ideal entry point. One thing I have learned over the years is to never chase giant candles. The market will always give the best entry with the smallest possible candle.
Step One: 30 minutes before the open of New York
Mark the Daily Opening Price
Find and mark the initial low of day
Since you want to be buying the low of day, don't worry too much about the initial high of day. You are looking for the New York's high of day.
Initial HOD/LOD = Highs and Lows placed before NY
New York HOD/LOD = Highs and Lows made by NY
Step Two: Let NY open and do its thing. You are waiting for the NY HOD to be put in place.
How do you know when NY has put in it's High of Day? You wait for a swing point.
Step Three: Mark NY's High of Day
Step Four: Wait until price dumps down and takes out the initial Low of Day. You want to be buying as close to the lows as you can. Never get caught buying the highs of day.
Step Five: Mark the new NY Low of Day
Step Six: Wait for your entry
How will you know what the specific entry will be to enter? You won't 100% but what will help guide you is to not enter on giant bars.
Step Seven: Plan and Execute the trade
There are many variations of this setup and it is up to you to study and recognize the small differences. The market is not going to make it easy for you.
Two biggest tips is one, buy near the NY low of day and two, never chase giant candles. Wait for small bull candles near the low.
Another tip. If your high of day target has not been hit before NY closes, the best course of action is to set up a Good till Canceled bracket order and hold overnight until target hit. Taking small, partial profits will blow your account. You need full winners. The edge holding overnight is too good to close your trade at the NY close. Hold overnight.
Global Market Participants: Players Shaping the World Economy1. Understanding Global Market Participants
A market participant refers to any individual, institution, or entity that engages in buying, selling, or investing in financial instruments such as stocks, bonds, currencies, derivatives, or commodities. Their participation drives market activity, facilitates capital allocation, and ensures continuous price formation through demand and supply.
Global market participants can broadly be divided into institutional participants and non-institutional (retail) participants. Institutional participants dominate the market due to their large capital base and sophisticated strategies, while retail participants add diversity and depth.
2. Categories of Global Market Participants
a) Central Banks
Central banks are the most influential entities in the financial world. They control a nation's monetary policy, manage foreign exchange reserves, and stabilize the currency and financial system. Examples include the U.S. Federal Reserve, European Central Bank (ECB), Bank of Japan (BoJ), and Reserve Bank of India (RBI).
Key functions:
Setting benchmark interest rates.
Controlling money supply to influence inflation and growth.
Managing exchange rate stability.
Acting as a lender of last resort during crises.
Regulating the banking sector.
Central banks’ decisions can cause global ripple effects. For instance, a rate hike by the U.S. Fed can strengthen the U.S. dollar, attract global capital inflows, and pressure emerging market currencies.
b) Commercial Banks
Commercial banks are vital intermediaries between savers and borrowers. They accept deposits, provide loans, and participate actively in money markets, foreign exchange markets, and credit markets.
Their roles include:
Facilitating trade finance and foreign exchange transactions.
Managing corporate treasury operations.
Participating in interbank lending.
Investing in sovereign bonds and other assets.
Commercial banks also engage in proprietary trading and market-making, providing liquidity to the market.
c) Investment Banks
Investment banks specialize in capital market operations, helping companies raise funds through IPOs, bond issuances, or private placements. They also provide advisory services for mergers and acquisitions (M&A), portfolio management, and structured finance.
Major global players like Goldman Sachs, Morgan Stanley, and J.P. Morgan play crucial roles in shaping global capital flows.
Core functions:
Underwriting securities.
Advising on mergers and acquisitions.
Asset securitization.
Providing derivatives and risk management solutions.
Investment banks are considered the "architects" of global finance, linking capital seekers and investors across continents.
d) Institutional Investors
Institutional investors are large organizations that invest on behalf of clients or members. They include mutual funds, pension funds, insurance companies, and sovereign wealth funds.
Examples:
BlackRock and Vanguard (mutual funds)
CalPERS (pension fund)
Norwegian Sovereign Wealth Fund
Allianz and AIA Group (insurance firms)
Importance:
They manage trillions of dollars, often determining global market trends.
They are long-term investors, influencing corporate governance.
Their actions impact asset allocation, market liquidity, and volatility.
Institutional investors’ investment decisions are data-driven, often guided by macroeconomic conditions, risk models, and diversification strategies.
e) Hedge Funds
Hedge funds are privately managed investment vehicles that use sophisticated strategies to generate high returns. They often employ leverage, short selling, arbitrage, and derivatives trading to exploit market inefficiencies.
Examples: Bridgewater Associates, Renaissance Technologies, and Citadel.
Their significance:
Hedge funds enhance market efficiency by arbitraging mispriced assets.
They take contrarian or speculative positions.
Their rapid trading strategies can amplify market volatility, especially in times of stress.
Hedge funds are major players in currency, commodity, and derivatives markets, frequently setting trends that influence other investors.
f) Corporations and Multinational Companies
Large corporations are key participants, especially in foreign exchange and commodity markets. They engage in international trade, requiring them to manage currency exposure and input cost fluctuations.
For example:
A U.S.-based company exporting to Europe may hedge against a weakening euro.
An airline company may hedge fuel costs using futures contracts.
Corporations also issue bonds or equities to raise capital, becoming integral to capital market operations. Their strategic financial management contributes to overall market stability and liquidity.
g) Sovereign Wealth Funds (SWFs)
SWFs are state-owned investment funds that invest surplus revenues (often from oil exports or trade surpluses) into global assets like stocks, bonds, infrastructure, and real estate.
Examples:
Norway’s Government Pension Fund Global
Abu Dhabi Investment Authority
China Investment Corporation
Role in markets:
Provide long-term, stable capital inflows.
Invest counter-cyclically during market downturns.
Promote cross-border investments and global diversification.
SWFs are crucial in stabilizing markets, especially during economic downturns, as their investment horizon spans decades.
h) Retail Investors
Retail investors — individual participants — are the foundation of market democratization. They invest through stock exchanges, mutual funds, ETFs, and online trading platforms.
Characteristics:
Smaller investment size.
Motivated by wealth creation, savings, or speculation.
Increasingly active through mobile trading apps and social trading platforms.
Retail investors have gained immense power in recent years, driven by digitalization and financial literacy. Events like the GameStop short squeeze (2021) demonstrated how retail participation can disrupt institutional dominance.
i) Brokers and Market Makers
Brokers facilitate transactions between buyers and sellers, while market makers continuously quote buy (bid) and sell (ask) prices to provide liquidity.
Roles:
Ensuring price discovery and efficient order execution.
Offering leverage and margin trading to clients.
Acting as intermediaries for foreign exchange and derivatives trading.
With algorithmic trading, many market-making activities are now automated through high-frequency trading (HFT) systems.
j) Regulatory Bodies and Exchanges
Although not direct investors, regulators and exchanges are crucial participants ensuring market integrity, transparency, and stability.
Examples:
U.S. SEC (Securities and Exchange Commission)
FCA (UK)
SEBI (India)
Financial exchanges: NYSE, NASDAQ, LSE, NSE, and CME.
Regulators safeguard investor interests, while exchanges serve as platforms for price discovery, trading, and clearing.
3. The Interconnectedness of Global Market Participants
Modern financial markets are highly interconnected. A decision by one participant — such as the Federal Reserve’s rate change — can ripple through global markets, influencing bond yields, equity valuations, and currency rates worldwide.
For example:
Central banks influence the cost of capital.
Institutional investors allocate funds globally, affecting capital flows.
Corporations react by adjusting hedging or investment strategies.
Retail investors respond through short-term trading or portfolio rebalancing.
This web of interactions defines the global financial ecosystem, where every participant indirectly shapes the behavior of others.
4. Technological Evolution and Market Participation
Technology has dramatically reshaped how participants interact. The rise of algorithmic trading, blockchain, AI analytics, and fintech platforms has made markets more efficient but also more complex.
Key transformations:
Automation: AI-based trading systems execute millions of trades per second.
Accessibility: Retail investors can trade global markets via mobile apps.
Transparency: Blockchain enables auditable and secure transactions.
Data-driven decisions: Big data helps institutions forecast market trends.
These innovations have lowered entry barriers but also increased systemic risk due to automation and cyber vulnerabilities.
5. The Role of Market Participants During Crises
During crises like the 2008 Global Financial Crisis or COVID-19 pandemic, the coordination between participants becomes critical.
Central banks injected liquidity and cut rates.
Governments implemented fiscal stimulus.
Institutional investors rebalanced portfolios toward safer assets.
Retail investors used market dips as buying opportunities.
Such coordinated yet diverse actions reflect how the global market’s resilience depends on its participants’ adaptability.
6. Challenges and Risks for Market Participants
Despite advances, participants face persistent challenges:
Volatility and uncertainty: Driven by geopolitical events and rate changes.
Currency fluctuations: Affect cross-border investments and trade.
Regulatory tightening: Especially after financial crises.
Technological risks: Cyberattacks and algorithmic malfunctions.
Liquidity risks: Especially during sudden market stress.
Participants must balance risk and reward using advanced hedging, diversification, and compliance strategies.
7. The Future of Global Market Participation
The next decade will redefine global participation patterns through:
Sustainable investing (ESG): Institutions prioritizing environmental and social factors.
Decentralized finance (DeFi): Blockchain enabling peer-to-peer trading.
Cross-border digital assets: Cryptocurrencies becoming mainstream.
AI-driven trading ecosystems: Enhancing efficiency but raising ethical concerns.
The blend of traditional and digital participants will create a hybrid global market that is more inclusive, transparent, and data-centric.
8. Conclusion
Global market participants are the lifeblood of the international financial system. Each plays a distinctive yet interconnected role in maintaining liquidity, enabling capital formation, and ensuring efficient price discovery. From central banks that dictate monetary policy to individual traders executing positions on mobile apps, every participant contributes to the constant pulse of global finance.
As globalization deepens and technology evolves, the diversity and complexity of market participants will continue to expand. Understanding their functions, interrelations, and influences is not just essential for traders or economists — it’s vital for anyone seeking to grasp how modern finance truly operates.
In essence, the story of global markets is the story of its participants — dynamic, interdependent, and constantly evolving in pursuit of opportunity, stability, and growth.

Forex Trading Options: Opportunities in the Global Currency 1. Understanding Forex Options
A forex option (FX option) is a financial contract based on a currency pair such as EUR/USD, USD/JPY, or GBP/INR. It allows a trader to speculate on or hedge against movements in the exchange rate. The contract gives the holder the right (not obligation) to buy or sell the base currency at a specific strike price before or at expiration.
For example:
A trader buys a EUR/USD call option with a strike price of 1.1000 expiring in one month. If, at expiry, EUR/USD rises to 1.1200, the trader can exercise the option to buy euros cheaper at 1.1000, profiting from the difference (minus the premium paid). If EUR/USD falls below 1.1000, the trader can simply let the option expire—losing only the premium.
Thus, forex options combine flexibility, limited risk, and exposure to currency volatility—all critical factors for sophisticated traders and corporations alike.
2. Key Components of Forex Options
To fully understand forex options, let’s break down their main components:
Currency Pair:
The underlying instrument (e.g., USD/JPY or GBP/USD) that the option is based on.
Option Type:
Call Option: Right to buy the base currency.
Put Option: Right to sell the base currency.
Strike Price:
The agreed-upon price at which the holder can buy or sell the currency pair.
Expiration Date:
The date when the option contract expires.
Premium:
The cost paid upfront to purchase the option. It represents the maximum loss for the buyer and income for the seller (writer).
Notional Amount:
The total size of the currency exposure covered by the option.
Settlement Type:
Physical Settlement: Actual currency exchange occurs.
Cash Settlement: Only the profit or loss difference is settled in cash.
3. Types of Forex Options
Forex options come in several types, depending on how they’re structured and traded.
A. Vanilla Options
These are the most common and straightforward options, similar to stock options:
European Style: Can only be exercised at expiration.
American Style: Can be exercised at any time before expiration.
B. Exotic Options
Exotic options are more complex and tailored for specific trading or hedging needs:
Barrier Options: Activated or canceled if the price crosses a specific level (knock-in/knock-out).
Digital Options: Pay a fixed amount if the currency reaches a target level.
Binary Options: Offer an all-or-nothing payoff based on whether a condition is met.
Asian Options: Payoff depends on the average exchange rate over a period rather than the rate at expiry.
Lookback Options: Allow the holder to "look back" and choose the most favorable exchange rate during the contract period.
Institutional traders and corporations often use exotic options due to their customizable nature.
4. How Forex Options Trading Works
Forex options can be traded in two main ways:
A. Over-the-Counter (OTC) Market
Most forex options are traded OTC between banks, corporations, and institutional clients.
Contracts are customized in terms of notional value, expiration, and structure.
Provides high flexibility but less transparency than exchange-traded options.
B. Exchange-Traded Options
These are standardized contracts traded on regulated exchanges like the Chicago Mercantile Exchange (CME).
Offer greater liquidity, transparency, and regulatory oversight.
Useful for retail traders who prefer standardized products.
5. Why Traders Use Forex Options
1. Hedging
Businesses, investors, and institutions use forex options to protect against unfavorable currency movements.
For instance, an Indian exporter expecting USD payments may buy a USD/INR put option to hedge against the rupee strengthening.
2. Speculation
Traders speculate on future exchange rate movements while limiting risk.
Buying options lets them benefit from volatility or directional moves without risking more than the premium.
3. Arbitrage
Some advanced traders exploit pricing inefficiencies between spot, forward, and options markets to earn risk-free profits.
4. Volatility Trading
Options are sensitive to implied volatility—a measure of expected market movement. Traders can profit by betting on whether volatility will increase or decrease, regardless of direction.
6. Pricing Factors of Forex Options
The price (premium) of a forex option depends on several key variables, explained through the Black-Scholes model and its forex adaptations:
Spot Price: Current exchange rate of the currency pair.
Strike Price: The price at which the option can be exercised.
Time to Expiration: More time means more uncertainty and thus a higher premium.
Interest Rate Differential: The difference in interest rates between the two currencies.
Volatility: Higher expected volatility increases the premium.
Option Type (Call/Put): Determines payoff structure.
Options pricing is a balance between potential reward and perceived risk.
7. Common Forex Option Strategies
Forex options can be combined in various ways to create structured positions. Here are the most widely used strategies:
A. Protective Put
Used to hedge an existing long spot position.
If a trader owns EUR/USD and fears depreciation, buying a EUR/USD put option protects against downside risk.
B. Covered Call
A trader holding a long spot position sells a call option at a higher strike price—earning premium income while capping potential upside.
C. Straddle
Buying both a call and put option with the same strike and expiry to profit from high volatility.
If the price moves sharply in either direction, the position gains.
D. Strangle
Similar to a straddle, but with different strike prices—cheaper but requires larger price movement to profit.
E. Butterfly Spread
Combines multiple options to profit from low volatility when the price is expected to stay near a certain level.
F. Risk Reversal
Involves buying a call and selling a put (or vice versa) to express a directional view with limited cost.
These strategies allow traders to tailor risk and reward profiles to market conditions.
8. Advantages of Forex Options
Limited Risk for Buyers:
The maximum loss is the premium paid.
Unlimited Profit Potential:
Especially for call options in strong trends.
Hedging Flexibility:
Corporations use options to protect cash flows against adverse currency moves.
Volatility Opportunities:
Traders can profit from rising or falling volatility.
No Margin Calls:
Unlike leveraged spot trading, option buyers don’t face margin requirements or liquidation risks.
Strategic Versatility:
Can combine with spot or forward positions for creative structures.
9. Risks and Challenges of Forex Options
Premium Costs:
Options can be expensive, especially in volatile markets.
Complex Pricing:
Requires understanding of volatility, interest rate differentials, and option Greeks (Delta, Gamma, Theta, Vega).
Time Decay (Theta):
Option value decreases as expiry approaches, even if the market doesn’t move unfavorably.
Limited Liquidity (in OTC Market):
Especially for exotic options or less-traded currency pairs.
Misjudging Volatility:
Incorrect forecasts of volatility can lead to losses even if the direction is right.
10. The Role of Forex Options in the Global Market
Forex options are not just speculative tools—they’re integral to global finance.
Central banks, multinational corporations, and institutional investors use them to manage currency exposure in trade, investment, and portfolio management.
Multinationals: Hedge foreign revenues or expenses.
Importers/Exporters: Lock in favorable exchange rates.
Fund Managers: Use options to reduce portfolio currency risk.
Banks: Offer structured products to clients using complex option strategies.
These contracts contribute to global liquidity, risk distribution, and price discovery in the FX market.
Conclusion
Forex options trading represents one of the most strategic, flexible, and risk-controlled ways to engage in the global currency markets. Whether used for hedging, speculation, or volatility trading, these instruments provide traders and institutions the ability to tailor risk exposure precisely to their financial goals.
While forex options require a deeper understanding of pricing dynamics, volatility, and global macroeconomic trends, they offer unmatched flexibility in managing uncertainty. As the world economy becomes increasingly interconnected, forex options will continue to play a critical role in stabilizing global trade, protecting investments, and enabling smarter cross-border financial strategies.
In essence, Forex Options Trading bridges the gap between opportunity and protection—allowing participants to navigate the ever-changing tides of global currency movements with precision, control, and strategic advantage.
Understanding Ichimoku Cloud In Trading🔹 1. Introduction
What is Ichimoku Cloud?
Ichimoku Kinko Hyo translates to “one‑glance equilibrium chart.” It is a rules‑based charting framework that maps trend, momentum, support/resistance, and forward projections in a single overlay so traders can make decisions quickly and objectively.
What makes Ichimoku different?
All‑in‑one system: Measures trend, momentum, and structure without adding separate indicators.
Forward projection: The Cloud and Kumo twists project future support/resistance zones rather than only reacting to past price.
Equilibrium logic: Midpoint calculations emphasize market balance over raw averages, often reacting more cleanly to range boundaries and trend pullbacks.
Visual speed: Color/position relationships produce a high‑signal, low‑clutter read—hence “one glance.”
🔹 2. History
Ichimoku was developed by Goichi Hosoda , a Japanese journalist who published under the pen name Ichimoku Sanjin. Between the 1930s and the 1960s, Hosoda and a team of assistants tested price and time relationships by hand, iterating toward a framework that could summarize market balance quickly without sacrificing structure. His work combined price, time, and wave ideas into a practical template that traders could learn and apply on paper charts.
The well‑known numbers—9, 26, and 52—come from the historical Japanese trading calendar, which used a six‑day trading week. More importantly, they create a short‑medium‑long cadence that preserves the internal geometry of the system, helping Tenkan/Kijun interactions line up with Cloud behavior and Chikou confirmations across many market regimes.
Ichimoku remains relevant because it projects future structure, scales across timeframes, and adapts well to liquid markets from equities and futures to forex and crypto. Even in a high‑frequency world, traders still respond to visible structure, and the Cloud makes that structure explicit ahead of time.
🔹 3. Benefits
Ichimoku reads trend, momentum, and structure in one glance. Trend shows in where price sits relative to the Cloud and in the ordering/slope of the spans (Span A over Span B and rising is healthy). Momentum appears in the Tenkan–Kijun relationship—their distance and angle—and in how quickly price reclaims Tenkan after a pullback. Structure is revealed by flat Kijun and flat Span B “magnet” levels that price gravitates to, plus Cloud thickness, which hints at how much “effort” the market needs to break through.
Because states and invalidations are predefined, visuals become rules you can trade: a close back inside the Cloud flags rising risk; Chikou clearing past highs removes nearby resistance; and entries are higher quality when Tenkan and Kijun align with a supportive, rising forward Cloud (often after a Kumo twist).
The method scales cleanly from intraday to weekly and across assets. Many traders set bias with the higher-timeframe Cloud—only looking for longs when price is above a rising Kumo—then drop a timeframe to time entries as Tenkan/Kijun cross or as price retests Kijun from above.
🔹 4. Components
Tenkan‑sen (Conversion Line): midpoint of the last 9 periods
In a healthy trend, price frequently “breathes” around Tenkan—pulling back to it, briefly piercing it, then resuming in the trend direction. The slope of Tenkan reflects the pace of the move: a rising, well‑angled Tenkan suggests persistent buying pressure, while a flattening Tenkan signals short‑term balance. Tenkan often acts as dynamic support/resistance; repeated successful retests are a sign of momentum continuity, and repeated failures warn of loss of impulse.
Tenkan = (Highest High(9) + Lowest Low(9)) / 2
Kijun‑sen (Base Line): midpoint of the last 26 periods
Where Tenkan tracks impulse, Kijun represents the balance point of the dominant swing. Price tends to revert to Kijun after expansions, making it both a magnet and a filter. A rising Kijun with price holding above it confirms trend maturity; a flat Kijun often marks the range midline and a probable retest level. Many traders trail partial risk below Kijun in uptrends (or above it in downtrends) because losing Kijun typically precedes deeper mean reversion.
Kijun = (Highest High(26) + Lowest Low(26)) / 2
Senkou Span A (Leading Span A): average of Tenkan and Kijun, plotted 26 periods forward
Span A represents one boundary of the Kumo and reflects the average of the Tenkan and Kijun lines, making it more responsive to recent price action and a dynamic indicator of short-term trend direction.
Span A = (Tenkan + Kijun) / 2 → shifted +26
Senkou Span B (Leading Span B): midpoint of the last 52 periods, plotted 26 periods forward
Span B forms the opposite edge of the Cloud and is calculated from a 52-period high-low average, creating a flatter, more stable line that often acts as strong support or resistance due to its representation of longer-term equilibrium.
Span B = (Highest High(52) + Lowest Low(52)) / 2 → shifted +26
Kumo (Cloud): the filled region between Span A and Span B; thickness visualizes volatility/“equilibrium buffer.”
The shaded area between Senkou Span A and Senkou Span B on the Ichimoku chart. This "cloud" represents areas of support and resistance, with its thickness indicating market volatility and the strength of the equilibrium zone. A thicker Kumo suggests greater uncertainty and stronger price buffers, while a thinner Kumo indicates weaker support/resistance levels and reduced volatility.
Chikou Span (Lagging Line): current close plotted 26 periods back; confirms alignment between current price and past price structure.
Chikou plots the current close 26 periods back. When Chikou is above prior price and above the Cloud, the path ahead is typically “clear,” confirming bullish conditions. When it collides with past highs, lows, or Cloud edges, those features often act as retroactive obstacles; trades pressed directly into them carry lower odds and may require reduced size or patience for a cleaner setup.
Chikou’s value is in context: it keeps you from buying breakouts that immediately smash into last month’s resistance or shorting into well‑defined support. Alignment of Chikou with price and the forward Cloud turns a visual impression into a rule.
🔹 5. Interpretation
How to rate signal quality?
Tenkan–Kijun cross (TK cross). A bullish TK cross occurs when Tenkan rises above Kijun; a bearish cross is the reverse. Crosses above the Cloud are strongest (trend‑aligned), inside the Cloud are neutral (higher noise), and below the Cloud are weakest for longs (and strongest for shorts). Cross quality improves when the forward Cloud agrees (Span A over Span B for bullish) and when Chikou has clear space.
Chikou confirmation of breakouts. A breakout through a level is more trustworthy when Chikou is through and beyond the corresponding historical barrier. If Chikou is pinned beneath old highs while price breaks out, expect retests or false starts.
Cloud breakouts and edge‑to‑edge logic. Breaks into or out of the Kumo carry more weight when the Cloud is turning (twist forming) and sloping in the trade direction. After a confirmed entry, price often traverses from one Cloud boundary to the other—especially when Span B is flat and acts like a target.
Kumo as future balance point. The forward Cloud is a projected equilibrium. Flat spans, especially Span B, frequently attract price; thick areas behave as buffers, thin spots as gates. Reading these shapes ahead of time lets you plan scenarios rather than react.
Multi‑timeframe alignment. Expectancy improves when the higher‑timeframe Cloud sets the bias and the lower timeframe supplies timing. For example, seek longs only when the daily is above a rising Cloud, then use a 1‑hour TK recapture or Kijun retest as the trigger.
🔹 6. Understanding the Kumo (Cloud)
Kumo as Support/Resistance
The Kumo is formed by the space between Senkou Span A and Senkou Span B projected 26 periods into the future. When price approaches the upper edge from below in a bearish regime, that boundary acts like resistance; when price descends onto the lower edge from above in a bullish regime, it often acts like support. Markets frequently hesitate, wick, or retest at these edges because they represent the consensus midpoint of prior swings carried forward in time.
A thick Kumo implies a broad equilibrium buffer: price needs more energy to pass through, so reactions, pauses, or partial rejections are common. A thin Kumo implies a narrow buffer: price can pierce and switch sides with less effort, which increases the odds of swift transitions. Flat sections—especially where Span B is flat—often behave like shelves that attract price before it decides the next leg.
Kumo Twist (Senkou Span A crosses B)
A Kumo twist occurs when Span A crosses Span B in the forward projection, flipping the Cloud from bullish to bearish or vice versa. Because the spans are derived from midpoints, the twist is an early signal of changing balance rather than a guarantee of immediate reversal. It often appears while price is still inside the prior regime, and its reliability improves when accompanied by Kijun flattening, Tenkan/Kijun compression, or a Chikou approach to historical barriers.
Trading before the twist can offer better entries but carries the risk of false starts if momentum doesn’t follow through. Trading after the twist sacrifices the first part of the move but benefits from confirmation—especially if the forward Cloud begins to slope in the new direction and price is already reclaiming or rejecting Kumo edges.
Kumo Breakouts
A Cloud breakout occurs when price closes out of the Kumo and holds that side on retests. A bullish breakout is a close above the upper boundary; a bearish breakout is a close below the lower boundary.
Quality improves when the forward Cloud agrees (Span A over Span B for bullish, the reverse for bearish), the Cloud is thinning or already thin at the breakout point, and Chikou is simultaneously through the corresponding historical structure.
False breakouts are common when the Cloud is thick and flat or when Chikou immediately collides with past highs/lows. Requiring a retest of the breached edge (turning resistance into support or vice versa) greatly improves expectancy, as does ensuring that Kijun is supportive (price holding above it in bullish contexts).
Thin vs. Thick Kumo
Thin Kumo generally reflects compressed ranges, fast transitions, and fragile trends. Breaks through thin spots tend to be quick but can reverse just as quickly if the rest of the system (TK alignment, Chikou, forward slope) doesn’t confirm. Thick Kumo reflects broader ranges and sturdier trends; passing through requires more energy, but holding the new side is more durable once achieved.
You can think of width as a volatility filter: thin zones favor momentum pops and tactical trades; thick zones favor patience, staged entries, and giving the market room to breathe. Many traders normalize Cloud width by price or compare it to ATR to judge whether conditions suit breakout‑style entries or mean‑reversion fades.
🔹 7. Strategies Using Ichimoku
Kumo as Support/Resistance
This strategy uses Cloud edges as forward support/resistance. In an uptrend, pullbacks into the upper Kumo edge or into a flat Span B shelf often create decision zones; if price rejects the edge and recaptures Tenkan, the trend is likely intact. The opposite applies in downtrends.
Entries typically trigger on a rejection close away from the edge or on the next bar that reclaims Tenkan. The stop sits outside the Cloud (beyond the pierced edge) to account for wicks. Expectancy improves when the forward Cloud thickens and rises (showing durable support) and when Kijun is rising beneath price. First targets are the recent swing extreme or the next flat Span B; if the bounce begins inside the Kumo, an “edge‑to‑edge” move toward the opposite boundary is a reasonable objective.
High‑probability conditions: clear trend, supportive forward slope, and a bounce forming near a flat Span B rather than in the middle of a thin, twisting Cloud.
Tenkan–Kijun Crossovers (TK Cross) in Context
Crossovers are context tools, not standalone signals. A bullish TK cross (Tenkan above Kijun) that occurs above the Kumo with a bullish forward slope and Chikou clearance is the strongest variant.
The same cross inside the Cloud is neutral, and below the Cloud is weak for longs (but strong for shorts in the opposite case). Early traders may take a cross below the Cloud when a twist and reclaim are imminent, but expectancy is lower without Cloud support.
A practical sequence is: establish bias from the Cloud, wait for the TK cross in that direction, then demand either Chikou clearance or a clean retest before committing full risk. Stops belong beyond Kijun or the most recent swing that defined the cross.
🔹 8. Key Takeaways
Ichimoku is a market framework, not a signal tool
Ichimoku is designed to map equilibrium and project structure forward. Read it as a context engine: the Cloud sets regime and bias, Tenkan/Kijun express momentum and mean reversion, and Chikou verifies that the path ahead is clear. Decisions come from states and transitions—price vs. Kumo, span ordering and slope, TK alignment, and Chikou clearance—rather than from any one line crossing another. This is why the same template scales from intraday to weekly charts and across asset classes: you are reading the same language of balance, impulse, and structure.
The synergy between components is the edge
Edge emerges when the system agrees with itself. A TK cross is more than two lines intersecting; its quality depends on where it occurs relative to the Cloud, how the forward Kumo is sloped, and whether Chikou has cleared historical obstacles. Kijun provides risk structure and often serves as a dynamic stop or trailing guide; flat Span B and flat Kijun act as magnets and targets. When these elements line up—Cloud bias, TK timing, Chikou clearance, supportive forward slope—you have a trade worth taking. When they don’t, the right move is usually patience.
Best practices checklist
Use this short checklist to standardize your process and reduce discretion.
Start with bias: Price relative to the Kumo and forward slope sets long/short/neutral.
Demand confluence: Take signals when TK aligns with forward Cloud and Chikou shows clearance.
Trade level‑to‑level: Plan entries/exits around flat Span B/Kijun shelves; they are natural magnets.
Prefer break‑and‑retest: After a Cloud or key‑level break, wait for a retest and hold before sizing up.
Avoid thick/flat Kumo: Stand aside or de‑risk when the Cloud is thick and horizontal; that’s chop territory.
Use multi‑timeframe logic: Let the higher timeframe set bias; take lower timeframe triggers in that direction.
Place stops beyond structure: Use Kijun or the Kumo edge instead of arbitrary ticks; give room for wicks.
Scale and trail methodically: Take partials at Span B/Kijun targets; trail from Kijun → Tenkan as momentum builds.
Size by volatility: Calibrate with ATR or relative Cloud width; widen stops and reduce size around twists.
Let Chikou veto: If Chikou is about to collide with past highs/lows, delay or reduce risk.
Treat Ichimoku as a map — the Cloud defines the terrain, TK tells you when to move, and Chikou checks that the road is clear. When the framework is not aligned, stand down. Trade only when the map, the timing, and the clearance agree; manage risk using the Kijun and the Cloud edges; and let neutrality be an acceptable outcome when the forecast is foggy.
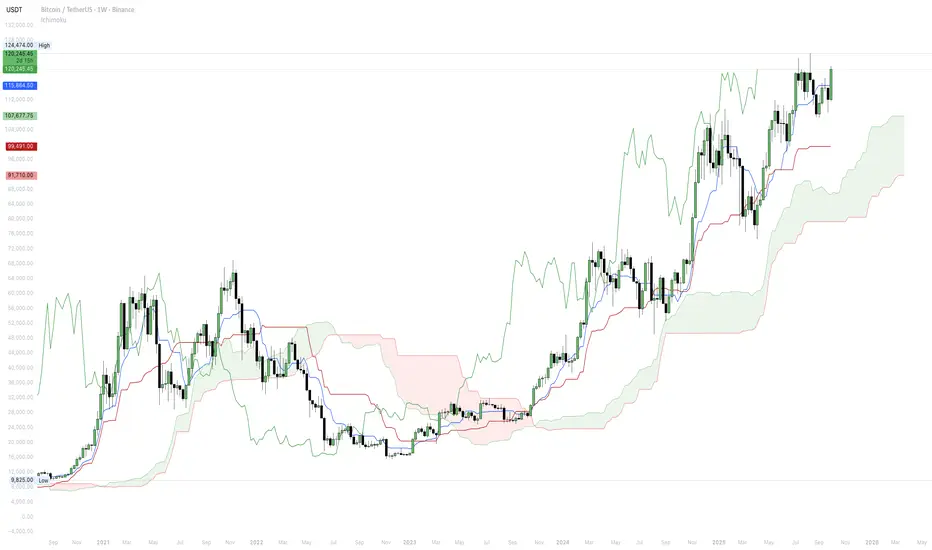
Forex Market AnalysisIntroduction
The foreign exchange (Forex) market is the largest and most liquid financial market globally, with an average daily turnover exceeding $8 trillion. Unlike stock markets, which are centralized, the Forex market is decentralized, operating 24 hours a day across global financial hubs, including London, New York, Tokyo, and Sydney. Forex trading involves the exchange of one currency for another, usually quoted in currency pairs such as EUR/USD, GBP/JPY, or USD/INR. The objective of Forex analysis is to understand market behavior, predict future price movements, and develop strategies for profitable trading.
Forex market analysis is broadly categorized into fundamental analysis, technical analysis, and sentiment analysis, each playing a critical role in decision-making. Understanding these approaches, combined with risk management, helps traders navigate the complexities of global currency markets.
1. Structure of the Forex Market
The Forex market consists of several participants:
Commercial Banks – The largest players, providing liquidity to the market and facilitating currency transactions for clients.
Central Banks – Influence currency values through monetary policy, interest rate decisions, and interventions.
Hedge Funds and Investment Firms – Engage in speculative trading and arbitrage opportunities.
Corporations – Manage currency risk due to international trade and investments.
Retail Traders – Individual traders accessing the market via brokers and trading platforms.
The market operates in three major sessions:
Asian Session (Tokyo, Hong Kong, Singapore) – Characterized by low volatility, often setting the initial trend for the day.
European Session (London, Frankfurt) – High liquidity and volatility, major economic data releases happen here.
North American Session (New York) – High volatility overlaps with London session, critical for trend continuation or reversal.
2. Key Drivers of Forex Market Movements
Forex prices fluctuate due to multiple factors:
2.1 Macroeconomic Indicators
Economic data from countries heavily influence currency valuation:
Gross Domestic Product (GDP) – A strong GDP indicates economic growth, increasing currency demand.
Inflation Rate – High inflation can devalue a currency unless matched by interest rate hikes.
Unemployment Rate – Lower unemployment signals economic strength, supporting currency appreciation.
Trade Balance – A trade surplus strengthens a currency, while a deficit can weaken it.
2.2 Central Bank Policies
Central banks control money supply, influencing currency strength:
Interest Rates – Higher rates attract foreign capital, boosting currency value.
Quantitative Easing (QE) – Increases money supply, often weakening the currency.
Interventions – Direct buying or selling of currencies to stabilize markets.
2.3 Geopolitical Events
Political stability and global events create volatility:
Elections, trade wars, sanctions, or conflicts can cause sharp currency swings.
Brexit in 2016 caused significant GBP volatility due to uncertainty.
2.4 Market Sentiment
Market psychology affects short-term price action:
Traders’ perception of risk vs. safety drives flows into risk-on or risk-off currencies.
Safe-haven currencies like USD, JPY, and CHF rise during global uncertainty.
3. Types of Forex Market Analysis
3.1 Fundamental Analysis
Fundamental analysis evaluates a currency’s intrinsic value by studying economic indicators, political stability, and monetary policies.
Example: If the US Federal Reserve signals a rate hike while the European Central Bank maintains low rates, the USD may strengthen against the EUR.
Long-term trends are usually driven by fundamentals.
Traders rely on economic calendars to track critical releases like NFP (Non-Farm Payrolls), CPI (Consumer Price Index), and interest rate decisions.
Advantages:
Predicts long-term trends.
Useful for carry trades (earning interest rate differentials).
Limitations:
Short-term volatility can override fundamentals.
Requires continuous monitoring of global developments.
3.2 Technical Analysis
Technical analysis studies past price movements to forecast future trends using charts and indicators.
Chart Patterns: Head and shoulders, double tops/bottoms, triangles, flags.
Trend Analysis: Identifying upward, downward, or sideways trends.
Indicators: Moving Averages, RSI (Relative Strength Index), MACD, Bollinger Bands.
Support & Resistance Levels: Key zones where prices often reverse.
Advantages:
Works for short-term and intraday trading.
Provides entry, exit, and stop-loss levels.
Limitations:
Can be misleading during extreme news events.
Requires discipline and risk management to avoid overtrading.
3.3 Sentiment Analysis
Sentiment analysis gauges trader behavior and market positioning:
Commitment of Traders (COT) Reports: Show positions of commercial and speculative traders.
Retail Sentiment: Broker platforms provide data on long vs. short positions.
Market sentiment can create contrarian trading opportunities when the majority is overly bullish or bearish.
4. Popular Forex Trading Strategies
4.1 Trend Following
Trades with the market trend (uptrend or downtrend).
Tools: Moving averages, trendlines, MACD.
Best for markets with strong directional movement.
4.2 Range Trading
Buying near support and selling near resistance in sideways markets.
Tools: RSI, Bollinger Bands, support/resistance zones.
Suitable for low volatility periods.
4.3 Breakout Trading
Trading when price breaks key support/resistance levels.
Tools: Volume indicators, volatility measures.
Can capture strong momentum but carries higher risk of false breakouts.
4.4 Carry Trade
Borrowing in low-interest currency and investing in high-interest currency.
Profitable when interest rate differentials are stable.
Sensitive to sudden volatility and geopolitical risks.
4.5 Scalping
Short-term trading aiming for small profits per trade.
Requires high liquidity, tight spreads, and fast execution.
5. Risk Management in Forex
Risk management is crucial due to high leverage (up to 1:500 in some brokers):
Position Sizing: Avoid risking more than 1–2% of capital per trade.
Stop-Loss Orders: Limit losses on adverse moves.
Take-Profit Orders: Secure gains when price reaches target.
Diversification: Avoid concentrating on a single currency pair.
Leverage Control: Use leverage responsibly to prevent margin calls.
Emotional discipline is also vital. Overtrading and revenge trading often result from poor risk management.
6. Market Trends and Recent Developments
The Forex market is influenced by evolving global conditions:
US Dollar Dominance: USD remains the reserve currency, heavily influencing global liquidity.
Emerging Market Currencies: Currencies like INR, BRL, and TRY are more volatile but offer higher returns.
Cryptocurrency Influence: Bitcoin and stablecoins are increasingly part of global liquidity dynamics.
Geopolitical Risks: Trade wars, sanctions, and conflicts continue to impact currency correlations.
Example: In 2025, tightening US monetary policy and European energy crises caused significant EUR/USD volatility. Similarly, USD/INR movements have been sensitive to RBI policy and global oil prices.
7. Tools and Resources for Forex Analysis
Traders rely on both platforms and data for analysis:
Trading Platforms: MetaTrader 4/5, cTrader, NinjaTrader for charting and execution.
Economic Calendars: Forex Factory, Investing.com, DailyFX.
News Sources: Bloomberg, Reuters, Financial Times.
Analytical Tools: Autochartist, TradingView, and AI-powered signals.
Combining tools ensures informed decision-making, blending both technical and fundamental perspectives.
8. Psychological Aspects of Forex Trading
Trading success is not only analytical but psychological:
Discipline: Stick to a trading plan without impulsive decisions.
Patience: Wait for high-probability setups.
Emotional Control: Fear and greed can cloud judgment.
Consistency: Focus on long-term profitability rather than short-term gains.
Experienced traders often maintain journals, track performance metrics, and review mistakes for continuous improvement.
9. Conclusion
Forex market analysis is a multidimensional process involving economic, technical, and psychological factors. Successful trading requires:
Understanding global macroeconomic conditions and central bank policies.
Applying technical tools to identify trends, support/resistance, and price patterns.
Analyzing market sentiment to gauge trader behavior.
Implementing disciplined risk management and emotional control.
The Forex market’s 24-hour nature, high liquidity, and global integration present both immense opportunities and risks. By combining analytical rigor with strategic discipline, traders can navigate this dynamic market and enhance profitability.
In essence, Forex analysis is an ongoing learning journey. Traders who consistently integrate market data, adopt structured strategies, and maintain disciplined risk management can achieve sustainable success in the ever-evolving foreign exchange landscape.
AMP Futures | Introducing Table ViewIn this idea we will demonstrate how to access the new Table view feature using TradingView.

The Best Way of Trading Cryptocurrency in the Global Market1. Understanding the Foundations of Cryptocurrency Trading
Before diving into advanced strategies, every trader must understand the basics that drive the crypto market.
Decentralization: Cryptocurrencies operate without central banks or intermediaries, making global participation seamless.
Volatility: Price swings in crypto are more extreme than in traditional assets, offering both opportunity and danger.
Liquidity: Some cryptocurrencies trade with massive daily volumes (e.g., BTC, ETH), while others are illiquid and prone to manipulation.
24/7 Market: Unlike stock exchanges that close daily, crypto markets never sleep — requiring traders to manage positions constantly or use automated tools.
Global traders must recognize that crypto prices are influenced by several macroeconomic and technological factors, including:
U.S. interest rate policies
Bitcoin halving cycles
Exchange liquidity and regional trading activity
Technological upgrades like Ethereum’s scalability improvements
Government regulation and institutional adoption
2. Choosing the Right Exchange and Platform
Trading globally requires access to reliable exchanges. Some of the most trusted international exchanges include Binance, Coinbase, Kraken, OKX, Bybit, and Bitfinex.
When choosing an exchange, consider:
Security: Two-factor authentication (2FA), cold wallet storage, and insurance protection are essential.
Liquidity: High liquidity ensures better prices and smoother order execution.
Fee Structure: Look for competitive trading fees and hidden costs such as withdrawal or conversion charges.
Global Accessibility: Traders should ensure that the platform allows trading in their region and supports multiple fiat currencies.
For professional-level trading, decentralized exchanges (DEXs) such as Uniswap, SushiSwap, and PancakeSwap provide non-custodial trading, giving traders full control over their funds while participating in global liquidity pools.
3. Trading Styles in the Global Crypto Market
Different traders adopt different styles based on time commitment, risk appetite, and capital. Here are the main approaches:
a. Day Trading
Day traders buy and sell crypto within a single day to capture short-term volatility. They rely heavily on technical indicators such as:
Relative Strength Index (RSI)
Moving Averages (MA & EMA)
MACD (Moving Average Convergence Divergence)
Volume Profile & Market Structure
Day trading requires speed, precision, and emotional discipline. It’s suited for traders who can monitor markets constantly.
b. Swing Trading
Swing traders hold positions for days or weeks to capitalize on medium-term trends. They combine technical analysis with fundamental insights (e.g., regulatory news, partnerships, or upgrades like Bitcoin ETFs or Ethereum forks).
c. Position Trading
Position traders or “HODLers” take long-term positions, betting on the broader growth of cryptocurrencies. For instance, investors who bought Bitcoin under $1,000 and held for years achieved massive returns.
d. Arbitrage Trading
Crypto arbitrage exploits price differences across exchanges. Since crypto is global, prices may differ slightly between Binance and Coinbase. Traders can profit by buying low on one exchange and selling high on another.
e. Algorithmic & Bot Trading
Automated bots can execute trades faster than humans, following programmed strategies like market making, trend following, or mean reversion. Platforms like 3Commas, Bitsgap, and Pionex help global traders automate their strategies efficiently.
4. Technical Analysis: The Trader’s Compass
Technical analysis (TA) remains the backbone of crypto trading. Since crypto markets are driven by trader psychology and speculation, chart patterns and indicators play a vital role in predicting movements.
Key TA tools for global crypto traders include:
Candlestick Patterns (Doji, Hammer, Engulfing) — indicate market sentiment.
Support & Resistance Levels — highlight areas where price historically reverses or consolidates.
Volume Profile Analysis — reveals where most trading activity occurs, identifying accumulation and distribution zones.
Fibonacci Retracements — help identify potential reversal levels during trends.
Market Structure Analysis — understanding higher highs, higher lows (bullish), and lower highs, lower lows (bearish).
Professional traders often combine multiple signals to confirm entries, reducing false signals in volatile crypto markets.
5. Fundamental and On-Chain Analysis
Beyond charts, understanding fundamentals and on-chain data separates skilled traders from gamblers.
Fundamental Factors Include:
Network Activity: Number of transactions, active addresses, and hash rate for proof-of-work coins.
Tokenomics: Supply, distribution, inflation rate, and utility.
Development Activity: GitHub commits and project updates indicate developer confidence.
Adoption Metrics: Partnerships, exchange listings, and merchant acceptance.
On-Chain Indicators:
MVRV Ratio: Compares market value to realized value, identifying overbought or undervalued conditions.
Whale Wallet Tracking: Large wallet movements often precede major market shifts.
Exchange Inflows/Outflows: When large amounts of crypto move off exchanges, it may signal accumulation by long-term holders.
Global traders often combine TA with on-chain data to gain a 360-degree market view.
6. Risk Management and Capital Preservation
Crypto trading is lucrative but risky. Without proper risk management, even skilled traders can lose everything.
Key principles:
Position Sizing: Never risk more than 1–2% of your portfolio on a single trade.
Stop-Loss Orders: Always define an exit point to limit losses.
Diversification: Spread exposure across multiple coins and strategies.
Avoid Overleveraging: High leverage amplifies both gains and losses.
Emotional Control: Greed and fear are the biggest enemies of a trader.
Professional traders emphasize preserving capital first and growing capital second.
7. Global Market Trends and Institutional Adoption
Crypto’s integration into the global financial system has accelerated since 2020. Key trends shaping the future of global crypto trading include:
Institutional Involvement: Companies like BlackRock and Fidelity now offer Bitcoin ETFs, providing global investors easy exposure.
Central Bank Digital Currencies (CBDCs): Governments are exploring blockchain-backed national currencies, legitimizing digital assets.
Tokenization of Real-World Assets (RWA): Real estate, bonds, and commodities are being tokenized on blockchain networks.
Layer-2 Scaling Solutions: Technologies like Polygon, Arbitrum, and Optimism are making decentralized trading faster and cheaper.
AI & Machine Learning in Trading: Predictive analytics powered by AI are helping traders identify market anomalies early.
The convergence of blockchain, AI, and global finance signals that crypto trading is no longer speculative — it’s becoming a cornerstone of the digital economy.
8. The Psychology of a Successful Global Trader
Success in crypto is not just about strategy — it’s about mindset. The most profitable global traders master emotional control.
Core psychological traits:
Discipline: Following a well-tested plan even when emotions run high.
Patience: Waiting for the perfect setup instead of chasing every move.
Adaptability: Adjusting to changing market conditions quickly.
Continuous Learning: Staying updated with blockchain developments and regulatory shifts.
Traders should treat crypto trading as a business — with clear strategies, reviews, and goals.
9. Regulatory Landscape and Global Compliance
Each country has its own crypto regulations:
U.S. & EU: Focus on investor protection, requiring KYC/AML compliance.
Asia: Mixed responses — Japan supports regulated trading, while China bans it.
India: Taxation and reporting requirements are tightening, but crypto remains legal to trade.
Global traders must be aware of:
Tax implications on capital gains
Reporting requirements for offshore accounts
Exchange registration rules in specific jurisdictions
Compliance ensures smooth operations and protects traders from legal risks.
10. Building a Long-Term Global Crypto Portfolio
While short-term trading generates quick profits, long-term wealth in crypto often comes from strategic investing.
A balanced portfolio might include:
50% in blue-chip coins: Bitcoin, Ethereum
30% in mid-cap projects: Solana, Chainlink, Polygon
10% in DeFi tokens: Aave, Uniswap, Curve
10% in speculative small caps: Promising but high-risk tokens
Diversifying across categories reduces volatility and provides exposure to emerging blockchain innovations worldwide.
11. Tools and Resources for Global Crypto Traders
To stay competitive in the global market, traders use advanced tools:
Charting Platforms: TradingView, Coinigy
Market Data Providers: CoinMarketCap, CoinGecko, Messari
On-Chain Analytics: Glassnode, Nansen, Santiment
Portfolio Trackers: CoinStats, Delta, Zapper
News Aggregators: The Block, CoinDesk, CryptoSlate
These tools help traders analyze, track, and execute decisions effectively across international markets.
12. The Future of Crypto Trading in the Global Economy
As blockchain adoption expands, crypto trading will merge deeper with traditional finance. We’ll witness:
Integration of tokenized assets with stock markets
Decentralized identity systems replacing KYC
Global interoperability of digital wallets
Rise of regulated DeFi and hybrid exchanges
Ultimately, the global crypto market will become more transparent, liquid, and institutionalized — rewarding those who combine technological insight with disciplined strategy.
Conclusion
The best way of trading cryptocurrency in the global market lies in mastering three pillars — knowledge, strategy, and discipline.
A successful trader understands market structure, leverages technical and fundamental tools, manages risks efficiently, and continuously learns.
Global crypto trading is not just about chasing profits — it’s about navigating a revolutionary financial ecosystem that’s reshaping the world economy. Those who adapt early, think strategically, and trade responsibly will not only survive but thrive in this digital financial era.
Devaluation Competition in the Global MarketIntroduction: Understanding Currency Devaluation
Currency devaluation refers to the deliberate downward adjustment of a country’s currency value relative to other major currencies, typically done by its government or central bank. The purpose of this policy move is to make a country’s exports cheaper and imports more expensive, thereby stimulating domestic production, boosting employment, and improving trade balances. While devaluation can be a strategic tool for economic revival, when several nations adopt this tactic simultaneously, it can lead to what economists call “competitive devaluation” — a global “race to the bottom” where countries continuously lower their currency value to gain short-term advantages.
In the globalized economy, currency values play a significant role in determining trade competitiveness, investment flows, and overall economic stability. The competition among countries to devalue their currencies has become an increasingly common phenomenon during times of economic slowdown, trade wars, or deflationary pressure. This form of competition has far-reaching implications for financial markets, inflation, global trade balance, and investor confidence.
Historical Background of Competitive Devaluation
The concept of competitive devaluation is not new. It dates back to the 1930s Great Depression, when major economies like the United States, United Kingdom, and France sought to devalue their currencies to support domestic industries amid collapsing global demand. This led to a series of retaliatory devaluations, trade barriers, and protectionist measures — ultimately worsening the global economic crisis.
After World War II, the Bretton Woods system (1944–1971) established a fixed exchange rate regime anchored to the US dollar, which was convertible to gold. This arrangement temporarily curtailed currency devaluation wars, as countries maintained stable exchange rates to support post-war recovery. However, once the US abandoned the gold standard in 1971, currencies began to float freely, reintroducing exchange rate volatility and renewed opportunities for competitive devaluation.
In the 1980s and 1990s, emerging economies often used currency devaluation as a tool to enhance export competitiveness. China’s undervalued yuan policy, for example, contributed significantly to its export-led growth model, leading to global imbalances and tensions with trading partners.
The Global Financial Crisis of 2008 reignited this phenomenon. With central banks lowering interest rates and injecting liquidity through quantitative easing (QE), currencies depreciated sharply. The US dollar weakened, prompting nations like Japan, China, and several European countries to respond with similar monetary easing to protect their exports. Thus, a new phase of currency wars began, shaping the modern dynamics of global economic competition.
Mechanics of Devaluation and Its Immediate Effects
Devaluation is primarily achieved through monetary and fiscal policy tools. A government may devalue its currency either by direct intervention (selling domestic currency and buying foreign reserves) or by indirect measures like lowering interest rates, printing money, or implementing expansionary monetary policies.
The immediate effects of devaluation are:
Boost in Exports:
A weaker currency makes a nation’s goods cheaper for foreign buyers, encouraging exports and improving trade balance.
Reduced Imports:
Imported goods become more expensive, discouraging domestic consumption of foreign products and promoting local industries.
Increased Inflation:
Higher import prices can lead to inflation, as raw materials, fuel, and consumer goods become costlier.
Debt Burden:
For countries with foreign-denominated debt, devaluation increases repayment costs, potentially worsening fiscal stability.
Short-term Economic Growth:
Export-driven sectors experience growth, helping reduce unemployment and stimulate production.
While these outcomes can be beneficial in the short term, the long-term consequences of repeated or competitive devaluations can be destabilizing for the global economy.
Competitive Devaluation: The Global Perspective
In a globalized market, one country’s devaluation affects many others. When several countries simultaneously pursue devaluation policies, the collective result can undermine global economic stability.
This phenomenon is often referred to as a “currency war”, a term popularized by Brazilian Finance Minister Guido Mantega in 2010. He described how nations were using monetary policies to weaken their currencies and gain trade advantages at others’ expense.
1. Trade Imbalances and Retaliation
When a major economy, such as the United States or China, devalues its currency, trading partners are forced to respond to protect their own export competitiveness. This can lead to retaliatory devaluations, creating global trade tensions. For instance, during the US-China trade war (2018–2020), the yuan’s depreciation was viewed by Washington as a deliberate attempt to offset tariffs, prompting accusations of “currency manipulation.”
2. Inflationary Spillovers
Devaluation often leads to imported inflation. For developing nations dependent on imported commodities like oil or machinery, this can significantly increase production costs, reducing consumer purchasing power.
3. Capital Flight
When investors sense a weakening currency, they may withdraw investments, leading to capital outflows, falling stock markets, and declining foreign exchange reserves. Emerging economies are particularly vulnerable to this.
4. Global Monetary Distortion
Competitive devaluations disrupt global financial markets by distorting interest rate differentials and exchange rate expectations. It complicates the conduct of international monetary policy coordination under institutions like the IMF or G20.
5. Loss of Credibility
Frequent devaluations can erode investor and consumer confidence in a nation’s economic management, leading to speculative attacks and exchange rate volatility.
Recent Examples of Competitive Devaluation
The 2010–2015 Currency Wars:
After the 2008 crisis, the US Federal Reserve’s quantitative easing programs weakened the dollar, prompting countries like Japan, South Korea, and Brazil to intervene in foreign exchange markets. Central banks flooded markets with liquidity, leading to sharp fluctuations in exchange rates.
Japan’s Abenomics (2012–2015):
Under Prime Minister Shinzo Abe, Japan adopted aggressive monetary easing to weaken the yen and stimulate exports. This triggered similar measures by other Asian economies to prevent their currencies from appreciating.
China’s Yuan Adjustments (2015–2019):
China devalued the yuan in 2015, sending shockwaves through global markets. The move was intended to support slowing exports and signal greater market determination in exchange rate policy. However, it sparked fears of a global deflationary spiral.
Post-COVID Monetary Expansion (2020–2022):
During the pandemic, massive monetary stimulus and low interest rates weakened most major currencies. As economies recovered, central banks began tightening policies unevenly, causing volatile exchange rate adjustments.
Russia and Sanctions (2022–2023):
Following geopolitical tensions and sanctions, Russia devalued the ruble to maintain export competitiveness, illustrating how currency devaluation can be both a political and economic weapon.
Economic Theories Behind Competitive Devaluation
Several economic theories explain the logic and risks behind devaluation competition:
Beggar-thy-neighbor Policy:
This classic theory suggests that one country’s devaluation benefits itself by boosting exports at the expense of others. While beneficial domestically, it harms global demand and cooperation.
J-Curve Effect:
After devaluation, trade balances may initially worsen due to existing contracts and higher import costs, but eventually improve as exports rise.
Purchasing Power Parity (PPP):
Over time, exchange rates should adjust to reflect relative price levels between countries. However, competitive devaluations often distort this natural equilibrium.
Mundell-Fleming Model:
This model highlights the trade-off between fixed exchange rates, capital mobility, and monetary independence — explaining why countries often use devaluation when capital is mobile and domestic growth is weak.
Winners and Losers of Competitive Devaluation
Winners:
Export-oriented Economies: Countries like China, Japan, and South Korea benefit when their goods become cheaper in global markets.
Tourism-driven Nations: A weaker currency attracts foreign tourists by making travel cheaper.
Manufacturing Sectors: Domestic industries gain competitiveness, leading to higher production and employment.
Losers:
Import-dependent Economies: Developing nations reliant on imported goods face inflationary pressure.
Foreign Investors: Currency depreciation reduces returns on investments denominated in local currency.
Consumers: Higher import prices reduce purchasing power and living standards.
Global Economy: Widespread devaluation undermines global demand, creates instability, and can trigger recessions.
The Role of Central Banks and Global Institutions
Institutions like the International Monetary Fund (IMF) and the World Bank play critical roles in monitoring currency policies and preventing manipulative devaluations. The IMF encourages transparent exchange rate mechanisms and discourages countries from artificially influencing their currency values to gain unfair trade advantages.
The G20 summits frequently address exchange rate stability as part of global financial governance. Central banks — such as the Federal Reserve, European Central Bank (ECB), and Bank of Japan — coordinate policy discussions to minimize harmful currency competition.
However, despite these efforts, monetary sovereignty allows nations to pursue independent policies, making coordination challenging.
Impact on Financial Markets and Global Investment
Competitive devaluation influences global markets in multiple ways:
Forex Markets:
Exchange rate volatility creates trading opportunities but increases uncertainty for long-term investors.
Commodity Prices:
Since commodities like oil and gold are priced in USD, a weaker dollar often drives their prices higher, affecting global inflation.
Stock Markets:
Export-oriented companies benefit from weaker domestic currencies, while import-dependent sectors suffer.
Bond Markets:
Currency depreciation often leads to higher bond yields, as investors demand greater returns to offset exchange rate risk.
Capital Allocation:
Investors tend to move capital toward stable-currency economies, leading to volatility in emerging markets.
The Future of Competitive Devaluation
In the 21st century, the global economy is more interconnected than ever. The digitalization of finance, rise of cryptocurrencies, and integration of global supply chains have changed the nature of currency competition. Future devaluations may not be purely monetary — they may involve digital currency manipulation, data-driven trade policies, or strategic fiscal interventions.
However, as globalization deepens, excessive devaluation will likely prove counterproductive. Investors demand stability, not volatility. Thus, maintaining currency credibility and sustainable growth will become the new measure of economic competitiveness.
Central banks will increasingly focus on coordinated policies, inflation targeting, and macroeconomic stability rather than unilateral devaluation. In a world of interconnected capital flows, the effectiveness of competitive devaluation is likely to diminish over time.
Conclusion
Competitive devaluation represents a paradox in global economics: while it can provide short-term relief for individual countries, it often triggers long-term instability for the global system. It reflects the tension between national interests and global interdependence.
The 21st-century global market needs cooperative currency management rather than destructive competition. As the lessons of history show — from the 1930s Great Depression to the post-2008 currency wars — devaluation races ultimately harm everyone. Sustainable economic growth will depend not on weakening currencies, but on strengthening productivity, innovation, and international trust.

Banks and Markets: Their Role in the Global EconomyIntroduction
In the vast and interconnected global economy, banks and financial markets play a fundamental role in ensuring stability, efficiency, and growth. They act as the twin pillars of the financial system—facilitating the flow of funds, supporting investments, managing risks, and promoting economic development. While banks serve as intermediaries between savers and borrowers, financial markets function as platforms for direct transactions between investors and issuers. Together, they form a dynamic ecosystem that influences everything from corporate financing and consumer spending to global trade and government policies.
Understanding the roles of banks and markets in the global context is crucial to grasping how modern economies function. Their interdependence shapes global capital flows, influences exchange rates, determines interest rates, and affects the pace of industrial and technological innovation.
1. The Role of Banks in the Global Market
Banks have evolved from simple money lenders and safekeepers to complex financial institutions that manage vast networks of credit, liquidity, and payment systems. Their global influence extends beyond national borders, affecting trade, investment, and financial stability.
1.1. Financial Intermediation
At their core, banks serve as financial intermediaries—linking those who have surplus funds (depositors) with those who need funds (borrowers). This intermediation ensures efficient allocation of capital. In the global market, this means channeling savings from developed economies (like the U.S., Japan, and Europe) into investment opportunities in emerging economies (like India, Brazil, or Indonesia).
By evaluating creditworthiness, managing risks, and offering tailored lending solutions, banks ensure that capital is allocated to productive uses. This process underpins economic growth and job creation worldwide.
1.2. Facilitating International Trade
International trade would not function smoothly without banks. Through mechanisms such as letters of credit, trade finance, and foreign exchange services, banks help importers and exporters conduct cross-border transactions securely.
For instance, a bank in India may guarantee payment to a supplier in Germany once the goods are shipped—reducing risk for both parties. Large multinational banks like HSBC, JPMorgan Chase, and Citibank have become key enablers of global trade, ensuring liquidity and trust between distant markets.
1.3. Supporting Monetary Policy and Financial Stability
Central banks—such as the Federal Reserve (U.S.), European Central Bank (ECB), and Reserve Bank of India (RBI)—play a special role in controlling the money supply, setting interest rates, and ensuring financial stability. Their decisions ripple through the entire global financial system.
For example, when the U.S. Federal Reserve raises interest rates, capital often flows out of emerging markets as investors seek higher returns in the U.S. This can cause currency depreciation and inflationary pressures in developing countries, illustrating how global banking policies interlink economies.
1.4. Managing Currency and Exchange Risks
With globalization, businesses deal in multiple currencies. Banks help manage foreign exchange risk by providing hedging tools like forward contracts, options, and swaps. Global banks act as major players in the forex market, providing liquidity and enabling international investors to move funds across borders efficiently.
1.5. Promoting Investment and Development
Banks finance infrastructure projects, startups, and industries that drive national and global development. In emerging markets, development banks like the World Bank and Asian Development Bank (ADB) provide long-term financing for projects that may not attract private investors. These investments support sustainable growth, reduce poverty, and create employment.
2. The Role of Financial Markets in the Global Economy
Financial markets complement the role of banks by providing a platform for direct capital exchange. They allow individuals, corporations, and governments to raise funds, trade assets, and manage financial risks efficiently.
2.1. Types of Financial Markets
The global financial system is composed of several interrelated markets:
Capital Markets: Where long-term securities like stocks and bonds are traded.
Money Markets: Where short-term debt instruments like treasury bills and commercial paper are exchanged.
Foreign Exchange (Forex) Markets: Where currencies are traded.
Derivatives Markets: Where futures, options, and swaps are used for speculation and hedging.
Commodity Markets: Where physical goods like oil, gold, and agricultural products are traded.
Each of these markets plays a crucial role in ensuring liquidity, price discovery, and efficient allocation of resources globally.
2.2. Facilitating Capital Formation
Financial markets help companies and governments raise funds by issuing shares or bonds to investors. For instance, when Apple issues corporate bonds, global investors—from pension funds in Canada to sovereign wealth funds in Singapore—can buy them. This mobilization of savings into investment fosters global economic development and innovation.
2.3. Promoting Liquidity and Price Discovery
Markets provide liquidity by allowing investors to easily buy or sell assets. The constant trading activity ensures that securities are fairly priced based on supply and demand. This price discovery function reflects real-time market sentiment about a company’s or economy’s health.
For example, if investors believe an economy is slowing down, stock indices fall—signaling caution to policymakers and businesses alike.
2.4. Risk Management through Derivatives
Derivatives markets allow investors to hedge against various financial risks, such as interest rate fluctuations, currency volatility, or commodity price changes. Airlines, for example, use futures contracts to lock in fuel prices, while exporters hedge against currency depreciation.
This risk transfer mechanism enhances global financial stability by distributing risks among willing participants.
2.5. Encouraging Global Integration
Financial markets link economies through cross-border investments. Institutional investors diversify portfolios by buying foreign securities, while multinational corporations issue bonds in multiple currencies. This integration deepens capital mobility, allowing funds to flow to regions offering the best returns.
However, it also means that shocks in one market—like the 2008 U.S. subprime crisis—can quickly spread globally, underscoring the interconnectedness of financial systems.
3. The Interdependence of Banks and Financial Markets
Banks and markets do not function in isolation. They are deeply interconnected, with each relying on the other for liquidity, pricing, and credit signals.
3.1. Banks as Market Participants
Banks actively participate in financial markets as investors, market makers, and risk managers. They trade government securities, manage portfolios of equities and bonds, and offer structured products to clients. Their trading activities help maintain market liquidity and stability.
3.2. Markets as Funding Sources for Banks
Banks themselves raise funds through capital markets by issuing bonds or equity. This diversification of funding sources strengthens their balance sheets and reduces dependence on deposits.
3.3. Transmission of Monetary Policy
Financial markets amplify the effects of central bank policies. When interest rates change, bond prices, equity valuations, and currency exchange rates adjust accordingly—affecting investment, consumption, and global trade patterns.
4. The Globalization of Banking and Markets
The 21st century has seen unprecedented global financial integration. Capital now flows across borders instantly, and financial institutions operate globally with advanced technology and regulation.
4.1. Cross-Border Banking
Large banks maintain operations in multiple countries, offering services from investment banking to retail lending. This enables efficient cross-border financing, supports global trade, and enhances capital mobility. However, it also introduces systemic risks when crises spread through global networks.
4.2. Technology and Fintech Revolution
Digital transformation has reshaped global banking and markets. Fintech companies, online trading platforms, blockchain, and cryptocurrencies have democratized access to financial services. Individuals can now trade global assets or transfer money across borders instantly.
This digitization of finance enhances efficiency but also challenges regulatory frameworks and traditional banking structures.
4.3. The Rise of Global Capital Flows
Global capital flows—foreign direct investment (FDI), portfolio investments, and remittances—have become key drivers of global economic activity. Financial markets serve as the main channels for these flows, helping countries finance deficits, build infrastructure, and stabilize currencies.
5. Challenges Faced by Banks and Markets in the Global Context
Despite their importance, both banks and markets face several risks and challenges that can threaten global stability.
5.1. Financial Crises and Systemic Risk
Events like the 2008 Global Financial Crisis and the 2020 COVID-19 market crash exposed vulnerabilities in both banking and market systems. Excessive leverage, poor risk management, and inadequate regulation can lead to contagion effects that spread across countries and sectors.
5.2. Regulatory Complexity
The global financial system is governed by a web of regulations—Basel norms for banks, securities laws, and anti-money-laundering frameworks. Ensuring compliance across jurisdictions is complex, particularly for multinational institutions.
5.3. Technological and Cybersecurity Risks
As banks and markets digitize, cyber threats pose significant risks. Data breaches, fraud, and hacking incidents can undermine trust and disrupt financial systems globally.
5.4. Inequality and Market Concentration
While financial globalization has boosted wealth creation, it has also widened income inequalities. Large financial institutions and investors often benefit disproportionately, while smaller participants struggle to compete.
5.5. Climate Change and Sustainable Finance
Modern banking and markets are under pressure to support sustainable finance—channeling capital into green and ethical investments. Institutions are now integrating Environmental, Social, and Governance (ESG) criteria into lending and investment decisions to ensure long-term sustainability.
6. The Future of Global Banking and Financial Markets
As the world moves deeper into the digital and data-driven era, the structure and role of banks and markets are evolving rapidly.
6.1. Digital Banking and Decentralized Finance (DeFi)
Traditional banking is being transformed by digital banks, blockchain, and DeFi platforms. These technologies remove intermediaries, reduce costs, and increase transparency—potentially reshaping how global capital moves.
6.2. Artificial Intelligence and Automation
AI-driven analytics, robo-advisors, and algorithmic trading are revolutionizing decision-making in both banking and markets. They enable faster, data-backed investment strategies and risk assessments, though they also introduce new systemic risks.
6.3. Central Bank Digital Currencies (CBDCs)
Many central banks are exploring CBDCs to modernize payment systems and enhance financial inclusion. Digital currencies could make cross-border transactions faster and cheaper while maintaining state oversight.
6.4. Global Cooperation and Regulation
Future financial stability will depend on international regulatory coordination. Organizations like the IMF, World Bank, and Financial Stability Board (FSB) will continue to play key roles in guiding policy frameworks and crisis management.
Conclusion
Banks and financial markets are the lifeblood of the global economy. They connect savers with borrowers, enable trade, manage risks, and drive innovation. Together, they form a complex yet indispensable system that powers growth, investment, and prosperity across nations.
However, their increasing globalization, technological transformation, and systemic interdependence also make them vulnerable to shocks and crises. The challenge for policymakers, investors, and institutions is to balance efficiency with stability, innovation with regulation, and profit with sustainability.
In the future, as the global economy becomes more digital, inclusive, and sustainable, the partnership between banks and markets will remain the cornerstone of economic progress—shaping how nations develop, businesses grow, and individuals achieve financial well-being in an interconnected world.
Competitive Currency War: Global Battle for Economic DominanceIntroduction
In the vast and interconnected world of global finance, currencies play a central role in determining the strength, stability, and competitiveness of nations. A competitive currency war—often called a currency devaluation war—occurs when countries deliberately devalue their currencies to gain an advantage in international trade. While this strategy may seem beneficial for exports and economic growth, it often triggers retaliation, leading to global financial instability and geopolitical tension.
In this detailed exploration, we’ll discuss the origins, mechanisms, effects, and modern implications of competitive currency wars—an ongoing struggle that shapes the balance of global economic power.
Understanding the Concept of Currency War
A currency war refers to a situation where multiple countries intentionally devalue their currencies to make their exports cheaper and imports more expensive. The goal is to boost domestic industries, reduce trade deficits, and stimulate economic growth. However, when many countries engage in the same practice, it leads to “beggar-thy-neighbor” policies—where one nation’s gain becomes another’s loss.
The term gained modern popularity after Brazil’s Finance Minister Guido Mantega warned of a “currency war” in 2010 when countries worldwide adopted aggressive monetary policies to recover from the 2008 global financial crisis.
Historical Background of Currency Wars
Currency wars are not a new phenomenon. They have appeared throughout economic history—usually in response to global recessions or competitive trade pressures. Let’s trace some major instances:
1. The 1930s: The Great Depression Era
After the Great Depression (1929), many countries sought to recover by devaluing their currencies. The U.K. abandoned the gold standard in 1931, followed by the U.S. in 1933, and several others soon after. The objective was to make exports cheaper and revive domestic production.
However, this sparked a chain reaction of competitive devaluations, leading to trade barriers, tariffs, and reduced global trade—worsening the global economic slump.
2. The Post-World War II Bretton Woods Era
In 1944, the Bretton Woods Agreement established a fixed exchange rate system, pegging global currencies to the U.S. dollar, which was backed by gold. This framework was designed to prevent currency instability.
However, by the late 1960s, the U.S. faced massive trade deficits and inflation, leading President Richard Nixon to end the dollar’s convertibility into gold in 1971, effectively dismantling the Bretton Woods system. The result was a move to floating exchange rates, opening the door for competitive devaluations once again.
3. The 1980s: The U.S.–Japan Currency Conflict
During the 1980s, Japan’s growing trade surplus with the U.S. led to tensions. To correct the imbalance, the Plaza Accord (1985) was signed by the U.S., Japan, West Germany, France, and the U.K., agreeing to devalue the U.S. dollar and appreciate the Japanese yen.
While the accord stabilized trade temporarily, it caused Japan’s asset prices to soar—eventually contributing to Japan’s “Lost Decade” in the 1990s.
4. The 2008 Financial Crisis and Modern Currency War
After the Global Financial Crisis of 2008, central banks worldwide—especially the U.S. Federal Reserve, European Central Bank (ECB), and Bank of Japan—implemented quantitative easing (QE). QE flooded markets with liquidity, weakening domestic currencies to spur exports.
Emerging markets accused advanced economies of manipulating currencies and “exporting inflation” to developing nations—a clear revival of competitive devaluation dynamics.
Mechanisms of Competitive Devaluation
Countries can weaken their currencies through several mechanisms. These actions may be direct (intervention in currency markets) or indirect (monetary and fiscal policies):
1. Monetary Easing
Central banks lower interest rates or implement quantitative easing to increase the money supply. This reduces currency value as investors seek higher yields elsewhere.
2. Foreign Exchange Intervention
Governments or central banks actively buy or sell their own currencies in foreign exchange markets to influence exchange rates. For example, China has often been accused of buying U.S. dollars to keep the yuan undervalued and support exports.
3. Capital Controls
To prevent capital inflows that might strengthen their currencies, some nations impose capital controls—restrictions on foreign investment or money movement.
4. Fiscal Expansion
High government spending can weaken a currency by increasing inflation expectations, reducing purchasing power, and discouraging foreign investment.
5. Competitive Interest Rate Reductions
When one country lowers interest rates to spur growth, others often follow suit to prevent their currencies from appreciating, triggering a race to the bottom in global monetary policy.
Economic Motives Behind Currency Wars
The motives behind a currency war are primarily economic survival and competitive advantage:
Boosting Exports: A weaker currency makes domestic goods cheaper abroad, improving trade balances.
Reducing Trade Deficits: It discourages imports, helping to reduce dependency on foreign goods.
Attracting Tourism: A cheaper currency makes travel to the country more affordable.
Supporting Employment: Export-led growth can help reduce unemployment during economic downturns.
Managing Debt: Inflation caused by currency depreciation reduces the real value of government debt.
Consequences of Currency Wars
While devaluation can offer temporary relief, competitive currency wars often lead to long-term economic instability and loss of trust between nations. Key consequences include:
1. Inflationary Pressures
Currency devaluation raises import prices, leading to higher inflation. For resource-importing nations, this can worsen living standards.
2. Loss of Investor Confidence
Frequent devaluations create uncertainty. Investors may withdraw funds from unstable economies, leading to capital flight.
3. Retaliatory Policies
When one country devalues, others retaliate. This “tit-for-tat” policy spiral often ends in trade wars—as seen between the U.S. and China.
4. Volatility in Financial Markets
Exchange rate fluctuations affect stock markets, bond yields, and commodities. Businesses dependent on global supply chains suffer due to unpredictability.
5. Global Economic Imbalance
Currency wars distort trade flows and investment patterns, destabilizing emerging markets that rely heavily on exports and foreign capital.
Currency War vs. Trade War
Although interconnected, currency wars and trade wars are distinct.
A trade war involves tariffs and import restrictions, while a currency war manipulates exchange rates. However, both aim to protect domestic industries and improve trade balances.
For example, during the U.S.–China tensions (2018–2020), the U.S. accused China of deliberately weakening the yuan to offset the impact of tariffs—essentially combining both wars simultaneously.
Major Players in Modern Currency Wars
1. United States
The U.S. dollar remains the world’s dominant reserve currency. The Federal Reserve’s monetary policy directly impacts global liquidity.
During QE phases (2008–2015 and 2020 pandemic stimulus), the U.S. faced accusations of weakening the dollar to aid recovery.
2. China
China has often been accused of managing the yuan to maintain export competitiveness. Its massive foreign exchange reserves and control over capital flows allow it to influence its currency more easily than floating-rate economies.
3. Japan
Japan’s Abenomics in the 2010s involved aggressive monetary easing, pushing the yen lower to combat deflation and revive exports—a classic currency war tactic.
4. European Union
The European Central Bank has engaged in QE and negative interest rates to stimulate growth, leading to a weaker euro, especially between 2015–2019.
5. Emerging Economies
Countries like India, Brazil, and South Korea often face the spillover effects of major powers’ currency policies. They must manage capital inflows and outflows while maintaining exchange rate stability.
Currency Wars in the Digital Era
The rise of digital currencies and central bank digital currencies (CBDCs) adds a new dimension to currency wars.
China’s Digital Yuan (e-CNY) challenges the U.S. dollar’s dominance in cross-border trade.
Cryptocurrencies like Bitcoin are viewed by some as a hedge against fiat currency manipulation.
U.S. and EU CBDC projects aim to retain influence in the global payments ecosystem.
Thus, the modern currency war is not just about exchange rates but also about technological dominance in financial infrastructure.
Case Study: The U.S.–China Currency War
One of the most notable modern examples is the U.S.–China currency conflict.
Background: China’s massive trade surplus with the U.S. led to accusations of currency manipulation, with the U.S. Treasury labeling China a “currency manipulator” in 2019.
Tactics: China managed its yuan to offset tariffs, while the U.S. used monetary stimulus to lower the dollar’s value.
Outcome: The trade war and currency war combined, creating volatility in global markets.
Implications: Both countries diversified reserves and reduced dependence on the U.S. dollar—fueling the trend toward de-dollarization.
Global Coordination to Prevent Currency Wars
To avoid destabilization, countries often use international cooperation frameworks:
International Monetary Fund (IMF): Monitors exchange rate manipulation and encourages transparency.
G20 Summits: Serve as platforms for global coordination of fiscal and monetary policies.
Central Bank Agreements: Bilateral and multilateral swaps help stabilize currencies during crises.
World Trade Organization (WTO): Addresses the trade-related effects of currency policies.
However, enforcement remains difficult, as sovereign nations guard monetary autonomy closely.
The Future of Currency Wars
The landscape of competitive currency manipulation is evolving rapidly. Future currency wars may be fought not through direct devaluations but through digital and policy tools, including:
Digital currency competition (CBDCs, stablecoins)
Technological control of payment systems
Geopolitical sanctions using currency dominance
Reserve diversification (rise of gold, yuan, and crypto as alternatives)
As nations strive to maintain competitiveness, monetary nationalism may rise again, creating an increasingly fragmented global financial system.
Conclusion
A competitive currency war represents far more than a battle of exchange rates—it is a struggle for economic supremacy, trade influence, and monetary sovereignty. While short-term currency weakening can support exports and growth, the long-term costs often outweigh the benefits—fueling inflation, damaging global cooperation, and undermining trust in financial systems.
The future may see new forms of currency wars, fought in the realms of digital finance, central bank policy, and global trade networks. To prevent economic fragmentation, global cooperation, transparency, and responsible monetary governance are essential.
Ultimately, in the globalized 21st-century economy, currency wars remind us that no nation operates in isolation—and that the value of money is not just a reflection of numbers, but of economic confidence and international balance.
Global Shadow Banking System in the World MarketIntroduction
The global financial system is not confined to traditional banks and regulated institutions. A vast parallel network of financial intermediaries—commonly referred to as the shadow banking system—plays an increasingly important role in the allocation of credit, liquidity, and investment flows across the world. Unlike conventional banks, shadow banking entities operate outside the traditional regulatory framework, which makes them both a source of innovation and a potential systemic risk.
The global shadow banking system has expanded significantly since the 1980s, especially after the 2008 Global Financial Crisis (GFC), when regulatory reforms tightened the space for traditional banks. This expansion has reshaped global capital markets, influencing liquidity, credit creation, and financial stability in both developed and emerging economies.
In this article, we explore the definition, evolution, key players, economic significance, risks, and regulatory perspectives of shadow banking worldwide.
What is Shadow Banking?
The term “shadow banking” was popularized by Paul McCulley in 2007 to describe credit intermediation carried out by entities and activities outside the regular banking system.
Characteristics of Shadow Banking:
Outside traditional regulation – Unlike commercial banks, they are not subject to strict regulatory oversight.
Maturity transformation – Borrow short-term (like money market funds) and lend long-term (like securitization).
Credit intermediation – Facilitate loans, investments, and securities issuance without being a formal bank.
Market-based funding – Depend heavily on capital markets rather than deposits.
Examples include hedge funds, private equity firms, securitization vehicles, money market funds, structured investment vehicles (SIVs), and peer-to-peer lending platforms.
Evolution of Shadow Banking Globally
1. Early Foundations (1980s–1990s)
Liberalization of financial markets in the US and Europe created space for non-bank financial intermediaries.
Development of securitization and derivative markets enabled institutions to bypass banking regulations.
2. Shadow Banking Before 2008 Crisis
Rapid growth in securitization and off-balance-sheet vehicles by investment banks.
Heavy reliance on short-term wholesale funding.
Played a crucial role in housing bubbles and subprime lending.
3. Shadow Banking Post-2008
Traditional banks faced stricter rules under Basel III, which limited leverage.
Non-bank intermediaries stepped in to provide credit and liquidity.
Growth of fintech, peer-to-peer lending, and private debt markets.
4. Current Landscape (2020s)
Shadow banking assets estimated at over $65 trillion globally (FSB estimates).
Largest contributors: US, China, EU, and Japan.
Increasing role in corporate bond markets, private credit funds, and asset management.
Key Components of the Global Shadow Banking System
1. Money Market Funds (MMFs)
Provide liquidity to corporations and investors.
Offer an alternative to bank deposits.
Vulnerable to “runs” during market stress (e.g., 2008 Reserve Primary Fund collapse).
2. Securitization Vehicles
Pool loans (mortgages, auto loans, credit card receivables) and sell them as securities.
Increase market liquidity but spread systemic risk (subprime mortgage crisis example).
3. Hedge Funds & Private Equity
Engage in leveraged trading, arbitrage, and alternative financing.
Play a role in distressed debt markets and private credit.
4. Structured Investment Vehicles (SIVs)
Borrow short-term via commercial paper and invest in long-term securities.
Collapsed massively during 2008 due to maturity mismatch.
5. Fintech & Peer-to-Peer (P2P) Lending
New entrants disrupting credit markets.
Provide credit access in regions underserved by banks (especially Asia & Africa).
6. Repo Markets (Repurchase Agreements)
Allow institutions to borrow against securities.
Critical for liquidity but highly vulnerable to shocks.
Role of Shadow Banking in the World Market
1. Enhancing Credit Availability
Shadow banks channel funds to sectors and borrowers often ignored by traditional banks, such as startups, SMEs, and high-risk borrowers.
2. Supporting Market Liquidity
By engaging in repo transactions, securitizations, and asset trading, shadow banks provide crucial liquidity to global capital markets.
3. Diversification of Financial Intermediation
Non-bank intermediaries add resilience by diversifying sources of credit, reducing dependency on commercial banks.
4. Innovation in Financial Products
Structured finance, fintech lending, and alternative investments often originate in the shadow banking world.
5. Supporting Economic Growth in Emerging Markets
In economies like China and India, shadow banking has filled gaps left by traditional banks, fueling entrepreneurship and private sector expansion.
Global Distribution of Shadow Banking
United States
Largest shadow banking system, estimated at over $20 trillion.
Dominated by money market funds, securitization vehicles, and hedge funds.
Plays a crucial role in corporate debt and mortgage markets.
European Union
Asset managers, insurance firms, and pension funds are key players.
Growth of investment funds post-crisis due to stricter banking rules.
Concerns about systemic risks in bond markets.
China
Rapid expansion since 2010, driven by trust companies, wealth management products, and online lending platforms.
Estimated shadow banking assets exceed $10 trillion.
Important for private enterprises but also a source of hidden credit risks.
Japan
Smaller but stable shadow banking sector.
Strong presence of insurance firms and pension funds in capital markets.
Emerging Markets
Latin America, Africa, and Southeast Asia seeing rapid rise in P2P lending and fintech-based shadow banking.
Helps bridge financial inclusion gaps.
Risks Associated with Shadow Banking
1. Systemic Risk & Contagion
Interconnectedness with traditional banks can spread financial shocks.
Example: 2008 crisis, where collapse of mortgage-backed securities destabilized global banking.
2. Liquidity Risks
Heavy reliance on short-term funding can trigger “runs” during stress.
3. Leverage & Opacity
Use of complex derivatives and leverage amplifies risk.
Lack of transparency makes it difficult to assess exposures.
4. Regulatory Arbitrage
Entities exploit gaps in regulations to bypass banking restrictions.
5. Credit Risk
Shadow banks often lend to riskier borrowers. Defaults can create chain reactions.
6. Cross-Border Risks
Global nature of shadow banking spreads financial risks internationally.
Regulatory Responses to Shadow Banking
1. Financial Stability Board (FSB)
Established frameworks for monitoring shadow banking globally.
Tracks size, activities, and systemic risks.
2. Basel III & IV Regulations
Tightened rules for banks to reduce dependence on shadow structures.
3. US Regulations
Dodd-Frank Act imposed stricter oversight on securitization and hedge funds.
SEC regulates money market funds.
4. China’s Crackdown
Government tightened controls on wealth management products and online lending.
Efforts to shift shadow credit back into regulated banks.
5. EU Initiatives
European Securities and Markets Authority (ESMA) oversees investment funds.
Implementation of reforms in repo and securitization markets.
Opportunities & Benefits of Shadow Banking
Financial Innovation – Expands new financing models like crowdfunding and digital lending.
Economic Growth – Provides credit for small businesses and consumers.
Investment Opportunities – Offers investors access to higher-yield products.
Resilience to Banking Crises – Provides alternative funding channels when banks restrict lending.
Future of Shadow Banking in the Global Market
1. Growth in Emerging Economies
Shadow banking is expected to expand in Asia, Africa, and Latin America due to financial inclusion needs and fintech innovation.
2. Digital Transformation
Fintech platforms, blockchain-based lending, and decentralized finance (DeFi) could become part of shadow banking 2.0.
3. Stricter Oversight
Governments and regulators will likely tighten monitoring to reduce systemic risks.
4. Integration with Traditional Banks
Many shadow banking activities are becoming more closely linked to commercial banks through partnerships and acquisitions.
5. Sustainable Finance & ESG Integration
Shadow banks may play a role in financing green bonds, renewable energy, and sustainable projects.
Conclusion
The global shadow banking system has become a central pillar of modern financial markets. By providing credit, liquidity, and innovative financial solutions, shadow banks complement the traditional banking system. However, the very features that make them attractive—regulatory flexibility, market-based funding, and risk-taking—also create vulnerabilities.
The world market depends on shadow banking for economic dynamism, but unchecked growth could destabilize financial systems, as witnessed in 2008. The challenge lies in balancing innovation with oversight, ensuring that shadow banking continues to support global economic growth without creating hidden systemic risks.
As financial markets evolve with technology, shadow banking will continue to expand, especially in emerging economies. Policymakers, investors, and global institutions must remain vigilant to manage both its opportunities and threats in shaping the future of the world economy.
Eurodollar Secrets: The Hidden Engine of Global Finance1. Origins: The Birth of the Offshore Dollar System
The Eurodollar market began almost accidentally in the 1950s. During the Cold War, the Soviet Union and other nations feared their U.S. dollar deposits held in American banks could be frozen by Washington. To avoid that risk, they began placing their dollar deposits in European banks — primarily in London.
These dollars, though denominated in U.S. currency, were held outside the United States and therefore outside U.S. regulatory jurisdiction. Thus, the term “Eurodollar” was born — not because it was related to the euro currency, but because the dollars were deposited in Europe.
Soon, non-European financial centers like Singapore, Hong Kong, and the Cayman Islands joined the network, expanding the reach of Eurodollars across the globe. What began as a political workaround became a vast, unregulated financial ecosystem that allowed banks, corporations, and governments to borrow and lend U.S. dollars freely.
2. What Are Eurodollars, Really?
Eurodollars are simply U.S. dollar deposits held in foreign banks or in overseas branches of U.S. banks. These are not “physical dollars” but electronic bank liabilities — IOUs — that circulate globally among institutions.
Unlike domestic U.S. deposits, Eurodollar accounts are not subject to Federal Reserve reserve requirements, FDIC insurance, or U.S. banking regulations. This freedom made them attractive for banks and corporations seeking higher returns and lower costs.
In essence, the Eurodollar market represents a shadow dollar system, where private banks create dollar credit outside the official oversight of U.S. authorities. The result is a parallel monetary system that finances trade, investments, and even entire economies.
3. The Mechanics: How Eurodollars Work
Here’s how the system typically operates:
A corporation deposits U.S. dollars into a London bank account.
The London bank, in turn, lends those dollars to another corporation or financial institution.
The borrowing bank may relend the funds again, creating layers of interbank liabilities, similar to how fractional reserve banking multiplies money.
These transactions are recorded electronically — no physical dollars move across borders.
This process means Eurodollar banks can effectively create dollar liquidity just like U.S. banks, but without the Federal Reserve’s control. As a result, the Eurodollar market serves as a global money supply engine, often larger and more flexible than the domestic U.S. system.
4. Why Eurodollars Matter: The Global Liquidity Engine
The true secret of the Eurodollar system lies in its role as the world’s main source of dollar liquidity. Since the U.S. dollar is the global reserve currency, international trade and finance depend heavily on dollar funding.
For instance:
Oil and commodities are priced in U.S. dollars.
Emerging markets borrow in dollars to fund infrastructure.
Banks use dollar funding to back loans and securities.
When the Eurodollar market expands, global liquidity increases — financing booms, rising asset prices, and economic growth. Conversely, when Eurodollar credit tightens, liquidity dries up, leading to market selloffs, funding crises, and recessions.
Thus, many financial crises — from the 2008 Global Financial Crisis to the 2020 COVID liquidity shock — were actually Eurodollar shortages rather than traditional banking crises.
5. London: The Heart of the Eurodollar Market
London became the central hub of Eurodollar activity due to its unique regulatory flexibility. British authorities allowed banks to conduct dollar transactions without the restrictions faced in the United States.
By the 1970s, London’s financial institutions were offering higher interest rates on dollar deposits than U.S. banks could legally provide under domestic rate caps. This “Regulation Q arbitrage” attracted massive inflows of U.S. dollars offshore.
The result was a financial revolution: London turned into the “money capital of the world”, with Eurodollars as its primary fuel. To this day, the City of London remains the nerve center of offshore dollar finance, supported by a network of global branches from New York to Singapore.
6. The Rise of Eurodollar Instruments
The Eurodollar system gave birth to an array of financial instruments that expanded global finance:
Eurodollar deposits: Time deposits held in offshore banks.
Eurodollar loans: Dollar-denominated loans made between international banks or to corporations.
Eurodollar futures: Contracts traded on the Chicago Mercantile Exchange (CME) that allow hedging against changes in short-term interest rates.
Eurobonds: Bonds issued in dollars (or other currencies) outside the jurisdiction of the issuing country.
These instruments transformed Eurodollars from a simple deposit market into a complex web of global derivatives and debt markets, connecting every corner of the financial world.
7. Eurodollars and the Federal Reserve: A Complex Relationship
Although the Eurodollar market operates outside U.S. borders, it remains deeply intertwined with the Federal Reserve’s policies. When the Fed raises or lowers interest rates, Eurodollar borrowing costs often adjust in tandem.
However, during financial stress, the Fed’s lack of direct control over offshore dollar creation becomes a problem. To prevent global liquidity collapses, the Fed has often extended swap lines — agreements to lend dollars to foreign central banks — especially during crises like 2008 and 2020.
In short, the Fed is the ultimate backstop for a system it does not officially regulate — a paradox that reveals how interdependent the global monetary system truly is.
8. The Secret Power of Eurodollar Futures
Among the many innovations in this market, Eurodollar futures hold special importance. Traded on the CME since 1981, these contracts allow investors to bet on or hedge against future U.S. interest rates.
Each contract represents a three-month, $1 million deposit in the Eurodollar market, settled at the London Interbank Offered Rate (LIBOR). These futures became a benchmark for global interest rates, influencing everything from corporate loans to mortgage rates.
For decades, LIBOR reflected the cost of borrowing dollars in the Eurodollar market — effectively serving as the “global price of money.” Although LIBOR has now been phased out and replaced by SOFR (Secured Overnight Financing Rate), the Eurodollar market’s influence persists in other derivative and funding instruments.
9. The Eurodollar Market and Global Crises
The Eurodollar system’s opacity and leverage have often played central roles in global financial crises.
In 2008, many European and international banks had borrowed heavily in Eurodollars to fund investments in U.S. mortgage-backed securities. When those assets collapsed, these banks faced a dollar funding shortage, triggering a global liquidity freeze.
The Fed had to inject trillions of dollars into the system through emergency swap lines to restore stability.
In 2020, during the COVID-19 pandemic panic, corporations and investors worldwide rushed to hoard dollars, causing another Eurodollar squeeze. Once again, the Fed’s global dollar facilities saved the system.
These events reveal a hidden truth: the world runs on Eurodollars. When offshore dollar liquidity tightens, the entire global economy feels the shockwaves.
10. Eurodollars vs. Petrodollars
While both terms involve U.S. dollars, Eurodollars and Petrodollars are distinct concepts:
Eurodollars are offshore dollar deposits and loans, part of the global banking system.
Petrodollars are the proceeds oil-exporting nations earn by selling oil priced in U.S. dollars.
However, the two are closely linked. Oil revenues often flow into Eurodollar banks, reinforcing the system’s liquidity. The recycling of Petrodollars into Eurodollar markets during the 1970s and 1980s financed developing nations and global trade expansion.
11. The Eurodollar Market Today
Despite tighter regulations after 2008, the Eurodollar market remains enormous — estimated at tens of trillions of dollars in size. Offshore dollar deposits, loans, and derivatives continue to power trade finance, global investments, and cross-border banking.
Moreover, digital banking and fintech have introduced new dimensions to the Eurodollar world. Digital dollar transfers, stablecoins, and blockchain-based settlements are essentially the modern evolution of the same concept — dollar liquidity outside U.S. borders.
The Eurodollar market’s reach now extends into Asia, with Hong Kong, Singapore, and Tokyo serving as major centers for dollar funding. Its shadow influence continues to define credit cycles, capital flows, and even central bank policies.
12. The Hidden Risks and Future of Eurodollars
While the Eurodollar system provides global liquidity, it also carries hidden dangers:
Lack of Transparency: No central authority fully tracks Eurodollar flows, making it hard to measure real global dollar liquidity.
Credit Chain Fragility: The system relies on trust between banks; a loss of confidence can quickly freeze funding.
Dependence on the Fed: Despite being offshore, the system ultimately depends on the Federal Reserve for crisis rescue operations.
Shift to Digital Dollars: With the rise of central bank digital currencies (CBDCs) and stablecoins, the Eurodollar market may evolve or fragment further.
Going forward, the key challenge will be how global policymakers handle this vast, unregulated dollar shadow system without stifling the liquidity it provides.
13. The Secret of Its Endurance
Why has the Eurodollar market survived for over seven decades despite regulatory scrutiny and crises?
Because it fulfills a global need that no domestic system can: a flexible, efficient, and universal dollar credit market.
As long as the U.S. dollar remains the world’s dominant currency, offshore dollar demand will persist. The Eurodollar market, invisible to most, will continue to lubricate the wheels of world trade, finance, and investment.
It is the hidden heart of the global financial system — unregulated, essential, and immensely powerful.
Conclusion: The Invisible Dollar Empire
The Eurodollar market is not just a financial curiosity; it is the foundation of the modern global economy. It determines how money flows, how credit expands, and how crises unfold. While central banks and policymakers appear to control global liquidity, the truth is that much of the real money creation happens offshore, beyond their reach.
Understanding Eurodollars is understanding how the world really works. The next time you hear about a liquidity crisis, rate hike, or currency shock, remember: behind every movement in global finance lies the silent pulse of the Eurodollar system — the world’s most powerful and least understood monetary network.
Trading : Lesson 2 -> Volitility Shift Line In this lesson we explore the concept of volitility and how to identify areas of previous volitility to predict future volitility.
