Giveaway 2025: Merry Christmas & Happy Holidays!Another year, another stack of charts, lessons learned the hard way, and moments where the market reminded us who’s really in charge.
As 2025 winds down, we want to say a genuine thank you. Your ideas, comments, chart screenshots, hot takes, and valuable feedback are what make TradingView what it is. You are the real MVP.
From all of us at TradingView, Merry Christmas and happy holidays. May your screens be calm when they need to be, volatile when you’re ready, and always one lesson richer by the close.
Here’s to cleaner charts, better patience, and fewer “I should’ve waited” moments in the year ahead.
🥁 And now… 🥁
🎁 THE 2025 HOLIDAY GIVEAWAY 🎁
Who:
🏆 THREE LUCKY WINNERS 🏆
What:
🚀 TradingView Premium Plan 🚀
Free for one full year
When:
⏳ JANUARY 5 ⏳
Winners announced
How to Enter :
Leave one comment under this Idea answering both questions below:
1️⃣ What's the biggest trading lesson you learned in 2025?
2️⃣ What's one habit you want to improve as a trader in 2026?
Rules (Quick & Simple) :
1️⃣ Like this Idea
2️⃣ Follow our official TradingView account
3️⃣ One entry per person
Note:
💡 Winners will be selected at random.
🚫 Multiple entries won’t count.
Keep an eye on this space. We’ll announce the winners on January 5.
Happy holidays from TradingView 🎄📈
Community ideas

Bitcoin - Channel no one talks about! (new Year's crash!)Bitcoin's price and development (code) are completely controlled by banks and government. They already have a roadmap on Bitcoin price, so they know what the price will be in 2030. Bitcoin technology is great for total control because all transactions are public. How to profit from that? First of all, you have to identify the big players on the chart and trade with them. They want to make as much money as possible on the way up, so that's why they cannot push the price to the upside in a straight line - they create a lot of traps and patterns on the chart.
When too many people are bullish, it's not worth it to them to send the price up, rather they push the price down in the short term and take all stop losses (your money is a stop loss). You are forced to sell, and guess who buys your order? Most likely the banks, because they love Bitcoin.
What we see on the chart is a blue descending parallel channel. This channel is the current pattern that we play on Bitcoin in this timeframe. Because the price is inside the channel and near the trendline resistance, we cannot be bullish at this point. What traders must understand is that we sell a resistance and buy a support, not the opposite. Currently the price is in a sell zone around 90k - 91k at the top of the channel. There is still an unfilled FVG at 91k - 92k that acts as a strong resistance. January is ticking on the door, and we know that statistically January is one of the most bearish months for Bitcoin. Currently I do not see any reason to be bullish, so I have to stay bearish at this point.
Write a comment with your altcoin + hit the like button, and I will make an analysis for you in response. Trading is not hard if you have a good coach! This is not a trade setup, as there is no stop-loss or profit target. I share my trades privately. Thank you, and I wish you successful trades!

Lingrid | GOLD Weekly Outlook: Pause Before the Next Surge OANDA:XAUUSD push toward the $4,400 psychological barrier encountered resistance, stalling just shy of a decisive breakout as market momentum softened ahead of the year-end holidays. This is not a reversal, but a classic consolidation—a necessary pause to digest gains and reset for the next leg higher. Price action reveals a textbook bullish pattern: a series of higher lows and higher highs within a well-defined upward channel, with each consolidation phase acting as a springboard for the subsequent expansion. The recent pullback is precisely the kind of healthy correction that strengthens the trend, offering strategic entry points for those aligned with the macro narrative.
Zooming into the technical structure, the price action confirms a powerful uptrend. The key support level at $4,270 has held firm, acting as a critical pivot point where buyers have consistently stepped in. Above this zone serves as both dynamic support from the upward trendline and the base of the current consolidation range. A decisive close above $4,350 would invalidate the short-term resistance zone and signal a resumption of the explosive expansion phase, targeting $4,450 with strong conviction. Conversely, a drop below could trigger a deeper correction toward $4,200, but even then, the broader uptrend remains intact as long as that major support holds.
The path forward is clear: patience and precision. Keep an eye on the 4H chart for a bullish engulfing or hammer candlestick formation near support as a high-probability entry signal. Remember, gold’s bull market is structural, not cyclical—it’s fueled by systemic global uncertainty. This holiday-season lull isn’t weakness; it’s the calm before the storm.
If this idea resonates with you or you have your own opinion, traders, hit the comments. I’m excited to read your thoughts!

Backtesting vs Reality. A Year on the Charts - Lessons for 2026Backtesting is not optional. And this has nothing to do with being a beginner exploring a new trading strategy or a professional trader.
Think about UFC fighters. Think about boxers. Think about elite athletes at the highest level of their sport. They are champions. They already proved themselves. Yet they still train. Three, four, five times a week. They don’t stop just because they “made it”.
💊 Trading is no different.
If you stop training, you slowly lose your edge. You become sloppy. Emotional. Overconfident. And the market will remind you very fast who is in charge.
For us as traders, training means backtesting, forward testing, and reviewing our own trades. At least once a week. Ideally bi-weekly. This is our gym. This is our sparring session. This is where mistakes are exposed without costing real money.
This article is not about how to backtest. TradingView already gives you simple tools for that. Everyone can click candles and simulate trades.
3️⃣0️⃣0️⃣ is your number
If you run at least 300 trade backtests on any trade pattern, this is what happen to you:
• No pattern guessing or fitting to price action
• No overthinking — you just follow the same setup you know works
• Fixed SL and TP, fixed RR — no guesswork
• You know your win rate %
• You know your risk-reward %
• Repetitiveness builds confidence and clarity
• Confidence and clarity lead to improvements
• Improvements lead to mastery over time
‼️ Again a statistical edge is only possible through a mechanical trading approach and proper backtesting. If you’ve done your backtests and have statistical data on a large sample, let’s say:
📌 Win Rate: 65%
That means out of 100 trades, you’ll win 75 — but there can still be 25 losses.
You never know the distribution of wins and losses, you only know that you’ll win over a series of trades.
📌 Average RR: 2.3
That means for every $100 you risk, you’ll win $230 if you’re right, and lose $100 if you’re wrong.
The reality is always different than backtest, in reality you will perform worse. Here is what you should at least achieve Here is also important to consider your ability to hold in the trade. Its amazing to catch 1:5 risk reward trades, but it mostly comes with low win ratio in other words, you will get stopped out few times until you get big trade. Also 1:5 risk reward usually has a pullback during the move. Can you face it without emotions being affected?
Most importantly, you finally understand something every professional lives by: you don’t know the distribution of the trades.
You may have a 65% percent win rate. It still means that you can have 35 losses out of 100 traders. Remember distribution of wins and losses is random , you never know outcome of next trade.
It could be win win loss win. Or loss loss loss win win. Or a brutal streak of seven losses before the market pays you back.
✅✅❌✅❌❌✅✅✅✅❌✅
When wins and losses are evenly distributed it's quite comfortable to continue in opening new trades. You still believe your strategy and it's simply normal to have loss time to time.
✅❌❌❌✅❌❌❌❌❌✅✅
But what you gonna do when such a streak comes? Are you gonna doubt your strategy? Are you gonna look for different strategy? Remember 65% success rate means 35 possible losses out of 100. If 20 losses comes in a row your long term statistics still was not broken.
Dont think this cant happen to you. If this didnt happen to you yet, you are not trading for long enough. It will come and it's better to be prepared.
📌 Lets look at the Monte Carlo simulation with our 65% win ratio and 2RR
As we can see on the picture below if you start with 10K and follow your strategy in a short period of one month we can face drawdown and end unprofitable even when we did everything right.https://www.tradingview.com/x/lcWQSlUa/ Why? We did everything right and we have positive winning ratio and Risk reward
📌 Random distribution of the trades
I don't win every trade, you don't win every trade. No one does. Trading is longterm game and short term result can be a bit random. Because you are might trend trader and market can stay in the range during some months or you are a reversal trader and its still trading against you. So how to beat it - Time.
📌 Lets improve Risk reward to 2.3
You will be getting slightly bigger wins so every loosing streak will be recovered faster.
And you should not stay in the prolonged drawdowns for long periods 📌 Lets improve win ration to 70%
And its even better less often you got loss and 2.3 RR recover slightly better. 🧪 The above is what I have been able to get from my backtests, it means I should have a quite easy and profitable year. So let's examine what was the reality and if I did all right.
✅ 2025 Statistical Overview
My average R:R came out at 2.36. That tells me something very clear. Trades around 2.3R are the ones that hit cleanly. They run smoothly without deep pullbacks. They feel controlled. From experience, 2.3R is my sweet spot. That’s where I’m comfortable. That’s where my edge is strongest.
✅ Macro Outlook - Total Trades - Win RR - RR Across the year, I took 198 trades. Win rate was 62%. Total R was around 200. If I risked 1% per trade, that’s roughly 200% for the year. I personally risked slightly more, but that’s not the point of this post. On paper, this is solid data. But the real lessons came when I broke it down month by month.
✅ Monthly Results
Some months had win rates around 75, 78, even 80%. Other months dropped below 65%. Some went as low as 50% or even 33%. When I compared this with trade frequency, the pattern was obvious. Every month where I took more than 15 trades, my performance dropped. August was the worst example. Almost 30 trades. Worst month of the year.
‼️ This tells me something very simple. When I trade less, I wait for my best setups. When I trade more, I force trades. 15 trades per month is the sweet spot. Less really is more.
✅ Days of the week
Monday had a win rate of only 44%. Low R. Low quality. Clear message. Mondays are not worth it for me as it's mostly where market makers are setting initial balance for the week. Tuesday, Wednesday, and Thursday are usually strong for me as Monday range manipulation is great setup.
📍 Friday was one of the best days. (not big data sample to confirm)
Why? Because if it was a specific week with a strong moves earlier in the week, Friday often gives clean pullbacks or reversals. The market is tired. Liquidity behaves differently. Those setups are easier to manage.
✅ Trading Sessions
The highest win rate came from New York and the PM session. Late London into late New York.Most major reversals start late in the day. They continue into Asia. Sometimes the best entries are at the end of the session, not the beginning. If you wait for the next morning, you’re often late. Being in position overnight, when it makes sense, has paid off for me many times.
✅ Trading Pairs
I traded multiple FX pairs & Alt-coins, but mostly traded EUR and GBP, CHF, USD Index and Bitcoin as well. Although I had a great trades on the Gold overall it was losing for me. Best performers for me were Bitcoin, EUR, GBP, USD, and CHF. That’s where my edge lives. That’s what I’ll focus on.
✅ Trading Models & Timeframes
I use 2 Trading models. Model 3 is in development. Model 0 means I didn't stick to strategy. Model 1 is my main weapon. Best consistency. Best overall profit. Not always the highest R, but the most reliable. Model 2 and Model 3 also performed well. (Model 3 small data sample)
‼️ Model 0 is the problem.
Model 0 means I entered without confirmation. Trading on feeling. Impulse. Ego.
I must stop doing this.
✅ CLS Range - Timeframes
Daily and weekly levels worked best for me. Monthly works sometimes, but holding trades that long doesn’t suit my personality and H4 although it produced good results, trading this CLS ranges would mean spending too much time behind the charts. ✅ HTF Key Levels and LTF Entry Levels
You don’t need fifty type of the key levels. Although I trade also FVG and IFVG. Most of my trades comes from Order block. You don’t need to know everything. You need one or two tools that you truly master. That’s it. This is how backtesting came to reality, as you can see reality is different, but I was quite close.
Data from the past year are not based only a strategy, but also my behavior. Which is clear reflection of my mistakes - Now I know what to do to be even better in 2026.
🔑 Key Point for the Strategy in 2026
- Average target around 2.3R.
- Maximum 15 trades per month.
- No Mondays.
- Focus on New York and PM sessions.
- Trade only EUR, GBP, DXY, CHF, and Bitcoin.
- Stick to Models 1, 2, and 3. Eliminate Model 0.
- Daily and weekly ranges only.
- Order blocks as primary key levels.
📌 How to turn it in to a $24 000 a month in 4 steps?
Magic of 3% Yes, you actually need to make only a 3% a month. Is it difficult ? No, It's not. You need 3 wins with 1:2 RR while risking 0.5% Risk.
1️⃣ Your Ultimate goal
-$100K Funded account - 3% Gain - 80% Profit split = $2400 Payout
2️⃣ Let's take it to $24 000 a Month
- Don't try to increase your % gains per month, increase your capital under management
3️⃣ Get another 4 x $ 100K Challenges pass them
- You will have $500K AUM:
- $ 500 000 - 3% Gain - 80% Profit split = $12 000
4️⃣ Reinvest buy another 3 - 5 challenges
Aim for $ 1000 000 funded across few solid props firms. 🎯 $ 1000 000 - 3% gain - 80% Profit Split = $24 000 Payout
🎯 $ 1000 000 - 3% gain - 80% Profit Split = $24 000 Payout
🎯 $ 1000 000 - 3% gain - 80% Profit Split = $24 000 Payout
Lets goo !!!
I promised myself I’d become the person I once needed the most as a beginner. Below are links to a powerful lessons I shared on Tradingview. Hope it can help you avoid years of trial and error I went thru.
📊 Sharpen your trading Strategy
⚙️ 100% Mechanical System - Complete Strategy
🔁 Daily Bias – Continuation
🔄 Daily Bias – Reversal
🧱 Key Level – Order Block
📉 How to Buy Lows and Sell Highs
🎯 Dealing Range – Enter on pullbacks
💧 Liquidity – Basics to understand
🕒 Timeframe Alignments
🚫 Market Narratives – Avoid traps
🐢 Turtle Soup Master – High reward method
🧘 How to stop overcomplicating trading
🕰️ Day Trading Cheat Code – Sessions
🇬🇧 London Session Trading
🔍 SMT Divergence – Secret Smart Money signal
📐 Standard Deviations – Predict future targets
🎣 Stop Hunt Trading
💧 Liquidity Sweep Mastery
🔪 Asia Session Setups
🧠 Level Up your Mindset
🛕 Monk Mode – Transition from 9–5 to full-time trading
⚠️ Trading Enemies – Habits that destroy success
🔄 Trader’s Routine – Build discipline daily
💪 Get Funded - $20 000 Monthly Plan
🧪 Winning Trading Plan
🛡️ Risk Management
🏦 Risk Management for Prop Trading
📏 Risk in % or Fixed Position Size
🔐 Risk Per Trade – Keep consistency
Adapt useful, Reject useless and add what is specifically yours.
David Perk

XAUUSD Demand Holding - Resistance Retest in PlayHello traders! Here’s my technical outlook on Gold (XAUUSD, 4H) based on the current chart structure. After a strong bullish impulse from the 3,650–3,700 area, price formed a clear ascending channel, respecting both rising support and resistance. Higher highs and higher lows continue to confirm bullish market control. Previously, Gold reached the Seller Zone around 4,360–4,380, where price entered consolidation and later turned lower. Selling pressure weakened near the 4,270 level, allowing buyers to step back in. Price then broke above 4,270, flipping it from resistance into support and signaling a bullish market structure shift. A corrective pullback followed into the Buyer Zone at 4,260–4,280, aligning with previous resistance turned support and the lower boundary of the ascending channel. Buyers successfully defended this area, keeping the bullish structure intact. Currently, price is consolidating below the Seller Zone (4,360–4,380), showing accumulation rather than strong rejection. My scenario: as long as price holds above the Buyer Zone (4,260–4,280), Gold may continue higher toward the Seller Zone / TP1. A clean breakout above resistance would open the door for further upside, while a failure to hold support could lead to a deeper corrective move. For now, the bias remains bullish. Please share this idea with your friends and click Boost 🚀

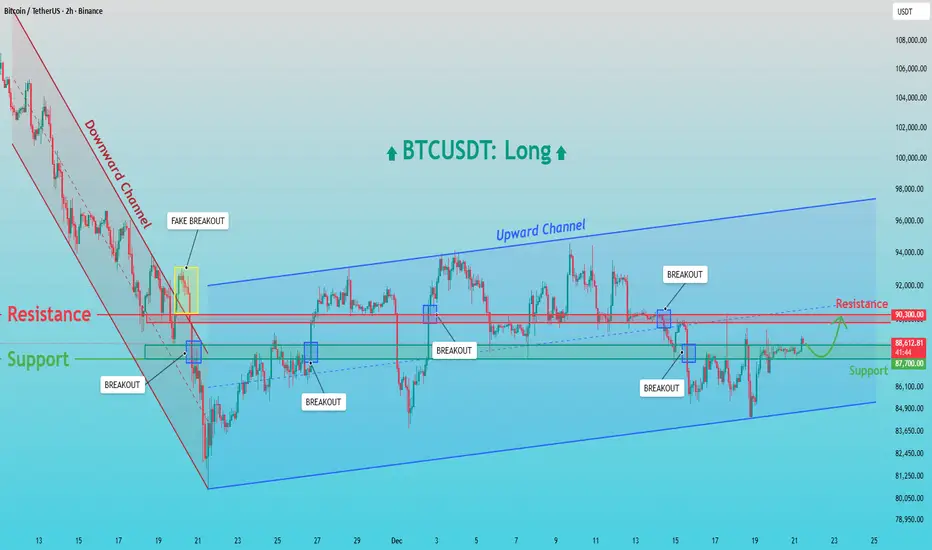
BTCUSDT: Holds Demand - Retest of 90,300 Resistance LikelyHello everyone, here is my breakdown of the current BTCUSDT setup.
Market Analysis
BTCUSDT recently transitioned from a strong downward channel into a broader bullish recovery phase. After a prolonged bearish move, price formed a base near the channel low, where selling pressure weakened. This led to a breakout from the downward channel; however, the first move above resistance resulted in a fake breakout, indicating that sellers were still active at that level. Following this, Bitcoin found strong demand around the 87,000 Support Zone, where buyers stepped in aggressively. From this area, price began to form higher lows and successfully established an ascending (upward) channel, signaling a shift in short-term market structure toward bullish control. Within this upward channel, BTC experienced several clean breakouts above intermediate resistance levels, confirming improving momentum. The key horizontal level around 90,300 acted as a major resistance, where price was rejected multiple times. Despite these rejections, the market did not break down sharply, suggesting absorption of selling pressure rather than distribution.
Currently, BTCUSDT is pulling back toward the 87,000 Support Zone, which aligns with previous resistance turned support and the lower boundary of the upward channel. Price action here remains constructive, with consolidation rather than impulsive selling, indicating that the move lower is corrective.
My Scenario & Strategy
My primary scenario remains bullish as long as BTC holds above the 87,000 support. This zone is a key demand area, and a strong reaction from here could lead to another attempt toward the 90,300 Resistance and a continuation within the upward channel. A confirmed breakout and acceptance above the 90,300 level would open the door for further upside toward higher channel targets.
However, a failure to hold the 87,000 Support Zone would signal weakness and could trigger a deeper correction toward the lower channel boundary. For now, the market structure favors long positions, with support holding and resistance as the next upside objective.
That's the setup I'm tracking. Thank you for your attention, and always manage your risk.
GOLD 1H CHART ROUTE MAP UPDATE & TRADING PLAN FOR THE WEEKHey Everyone,
Please see our 1h chart levels and targets for the coming week.
We are seeing price play between two weighted levels with a gap above at 4360 and a gap below at 4327, as support. We will need to see ema5 cross and lock on either weighted level to determine the next range.
We will see levels tested side by side until one of the weighted levels break and lock to confirm direction for the next range.
We will keep the above in mind when taking buys from dips. Our updated levels and weighted levels will allow us to track the movement down and then catch bounces up.
We will continue to buy dips using our support levels taking 20 to 40 pips. As stated before each of our level structures give 20 to 40 pip bounces, which is enough for a nice entry and exit. If you back test the levels we shared every week for the past 24 months, you can see how effectively they were used to trade with or against short/mid term swings and trends.
The swing range give bigger bounces then our weighted levels that's the difference between weighted levels and swing ranges.
BULLISH TARGET
4360
EMA5 CROSS AND LOCK ABOVE 4360 WILL OPEN THE FOLLOWING BULLISH TARGETS
4388
EMA5 CROSS AND LOCK ABOVE 4388 WILL OPEN THE FOLLOWING BULLISH TARGETS
4417
EMA5 CROSS AND LOCK ABOVE 4417 WILL OPEN THE FOLLOWING BULLISH TARGETS
4449
BEARISH TARGETS
4327
EMA5 CROSS AND LOCK BELOW 4327 WILL OPEN THE FOLLOWING BEARISH TARGET
4299
EMA5 CROSS AND LOCK BELOW 4299 WILL OPEN THE SWING RANGE
4270
4236
EMA5 CROSS AND LOCK BELOW 4236 WILL OPEN THE SECONDARY SWING RANGE
4212
4183
As always, we will keep you all updated with regular updates throughout the week and how we manage the active ideas and setups. Thank you all for your likes, comments and follows, we really appreciate it!
Mr Gold
GoldViewFX

Bitcoin: Won't Break Support, Back To 95K?Bitcoin continues to maintain the broader support around the low 80Ks. While this formation appears to be a lower high consolidation (bearish), it could also be the key inflection point for a reversal back into a bullish structure. This possibility aligns with the broader bullish trend which is still bullish AND with a Wave 5 scenario which I have talked about numerous times.
The broader trend that I am referring to is the bullish structure from the 126K high back to before the 73K breakout. This is the dominant structure, NOT the retrace from the 126K to 80K which is the short term trend. It is important to always consider the market from both sides of the argument. The bear argument in terms of wave count: since 88K has been overlapped, the current move is potentially a Wave 2 of the broadest magnitude. If this is true, Bitcoin has room to retrace back into the 60Ks (roughly 50% retrace from highs). The bull argument: 88K has not been overlapped for long, in fact price is very reluctant to stay below this level. 88K was the price I determined as the Wave 1, Wave 4 overlap of this broader 5th Wave that peaked at 126K. If price refuses to break lower (80K support) then it will be signaling that this is likely the beginning of the broader Wave 5 of 5 which can see a move beyond 126K over the coming months.
I agree Wave counts can be confusing and are only crystal clear after the fact, but that is not the point. The point is we can formulate potential scenarios that require confirmation by the market. If 80K breaks and price cannot swiftly retrace, then the bearish argument gains traction and price is likely in the Wave 2. IF 80K holds, and we are breaking back into the 90Ks, especially 95K resistance, then the bullish argument is in full swing.
Again this information is NOT to be used as a concrete forecast. The MARKET does what IT WANTS WHEN IT WANTS. We listen, adjust and manage risk. This information can be used as a general roadmap to anticipate further moves based on the confirmation the market offers. For example, if the bullish breakout scenario unfolds, it would make sense to expect more from longs. This includes things like: aggressive profit objectives (3:1 or greater), scaling into supports because they are more likely to hold, etc. Also expecting less from shorts, or not shorting at all, etc. Only you can decide how to adjust your strategy based on the context of the environment.
Also what makes this situation more compelling is the fact that the macro environment is strongly supportive. Lawmakers, the biggest banks and companies all innovating, investing, and betting huge in this space. On top of that, we have a government that is extremely Bitcoin friendly and setting us up for future rate cuts. CPI "officially" came in at 2.7%, less than expected which bolsters the argument for more rate cuts, perfect for the upcoming YESman, I meant Chairman of the Federal Reserve. Think about it. Remember, short term sentiment prices in the future based on only what it can process in the moment AND it is highly irrational. This is where short term mis pricing come from along with compelling lower risk opportunities you just have to have the confidence in your ability to recognize them.
Thank you for considering my analysis and perspective. Let's goooooooooooooooo!

XAUUSDHello Traders! 👋
What are your thoughts on GOLD?
Gold is currently trading near its all-time high (ATH) and the upper boundary of a short-term ascending channel.
This zone has acted as a strong resistance area, where price has been rejected multiple times in the past.
As long as price remains below this resistance, a bearish reaction is expected.
The base case is a pullback toward the lower boundary of the ascending channel, which serves as the minimum downside target.
If price breaks above the channel top, prints a new high, and a strong candle closes above the resistance zone, the bearish scenario targeting the channel low will be invalidated.
With the year-end approaching, low liquidity conditions increase the probability of fake breakouts and false moves.
Extra caution and confirmation are required before taking any breakout trades.
Please Don’t forget to like and share your thoughts in the comments! ❤️

GOLD - We've updated ATH. What's next? A correction?FX:XAUUSD hit a new all-time high, approaching $4,425, for a bunch of reasons, one of which is increased interest in hedging against geopolitical risks...
Fundamental situation:
The US has increased sanctions pressure on Venezuela. Israel is considering options for attacking Iran's nuclear program. Russia-Ukraine negotiations show no progress. Weak US data (inflation and employment) have reinforced expectations of two Fed rate cuts in 2026.
On Tuesday, US GDP data for the third quarter and durable goods orders are expected, as well as speeches by Fed members, which may adjust short-term dynamics. The combination of geopolitical uncertainty and soft monetary policy continues to support the upward trend.
Resistance levels: 4420
Support levels: 4406, 4400, 4380
Any correction is likely to be limited as long as the current fundamental background remains unchanged. However, when entering the market, it is necessary to take into account the level of risk. Buying in the high zone is high risk. We are waiting for a pullback or correction to the indicated zone before making any decisions.
Best regards, R. Linda!

XAU/USD | Gold Breaks Above $4400 and Prints a New ATH!By analyzing the #Gold chart on the 4H timeframe, we can see that after the analysis we posted on Thursday, price first had a small correction and then resumed its move higher. With the market reopening today, gold showed strong momentum and finally broke above $4400, printing a new all-time high. Price reached as high as $4420, then pulled back slightly and is now trading around $4409.
This strong rally has created a liquidity gap, which I expect to be filled in the short term. Before that happens, we may first see another push higher toward the $4440 to $4444 area. After this potential final push, a corrective move is likely. The downside targets I am watching are $4389, $4374, $4358, and the $4335 to $4350 zone. Make sure to closely monitor price reaction around these levels. This analysis will be updated, and total performance so far is already over 1300 pips.
Please support me with your likes and comments to motivate me to share more analysis with you and share your opinion about the possible trend of this chart with me !
Best Regards , Arman Shaban

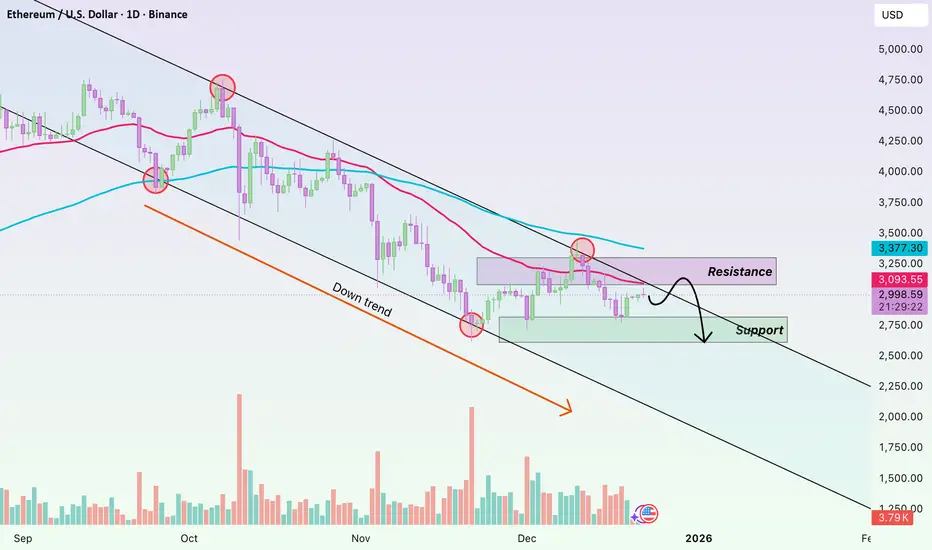
ETH/USD Bearish Structure with Downside TargetsETH/USD is showing clear bearish pressure after repeated failures to sustain above the highlighted supply zone around the 3,050–3,100 area. Price action indicates a lower high structure, followed by a strong rejection from the Ichimoku cloud, suggesting sellers remain in control. The cloud ahead is turning bearish, acting as dynamic pressure and limiting upside momentum. Recent rebounds appear corrective rather than impulsive, reinforcing the downside bias. If price continues to respect this resistance zone, further weakness is likely. The first downside objective is seen near 2,780, which aligns with a prior demand area. A decisive break below this level could accelerate selling pressure toward the second target at 2,524, marking a deeper move into lower support. Proper risk management is advised in volatile conditions.
If you found this XAUUSD analysis helpful, don’t forget to LIKE 👍 and COMMENT 💬!

XAUUSD Bullish Continuation Toward 4374XAUUSD (30M) Short Description:
Gold is holding above key support around 4335–4320 after a pullback. Price is showing bullish continuation potential, with resistance near 4357. A break and hold above resistance could push price toward the 4374 target, while major support remains around 4307.

THE KOG REPORT THE KOG REPORT:
In last week’s KOG Report we again published the predictive path and expected price to stay within the range but attempt that high. We managed to follow that path nearly to the tee capturing the high, the low and then the RIP from the level of defence we had given.
A great week on Gold completing our Excalibur targets, most of the red box targets and following the bias levels well.
So, what can we expect in the week ahead?
It’s going to be a short week with exaggerate volume in our opinion. We should see the range continue and a potential test on that high will be ideal for us. For that reason, the path shows support below at defence and then potential for a test on that high which is where we would ideal like to see another RIP! It’s a simple one on the indicators, we’ll wait for the activations, we’ll go with the price so look for the breaks either side.
We’ll update traders best we can but please remember, it’s the end of December, not the best market conditions to be in and the less exposed you are the better.
RED BOXES:
Break above 4340 for 4355, 4365, 4370 and 4376 in extension of the move
Break below 4320 for 4310, 4304, 4295, 4283 and 4265 in extension of the move
Please do support us by hitting the like button, leaving a comment, and giving us a follow. We’ve been doing this for a long time now providing traders with in-depth free analysis on Gold, so your likes and comments are very much appreciated.
As always, trade safe.
KOG

GBP/USD - H4 Weekly Outlook- Channel Breakout📝 Description 🔍 Setup (Market Structure) OANDA:GBPUSD
GBP/USD is trading inside a rising channel on H4 and has recently shown a channel breakout attempt followed by a retest near the upper zone. Price is now consolidating under a key resistance area, making this a decision week.
🔴Higher highs & higher lows intact
🔴Breakout + retest structure visible
🔴Momentum slowing near resistance → wait for confirmation
📍 Key Levels :
🟢 Resistance Zone: 1.3420 – 1.3455
🔴 1st Support: 1.3215 – 1.3200
🔴 2nd Support: 1.3135 – 1.3100
#GBPUSD #ForexTrading #WeeklyOutlook #ChannelBreakout #PriceAction #SupportResistance #TradingView #Kabhi_TA_Trading
⚠️ Disclaimer
This analysis is for educational purposes only.
Forex trading involves risk — always use proper risk management and stop-loss.
💬 Support the Analysis👍 Like if you’re watching GBP/USD this week
💬 Comment: Breakout or Rejection?
🔁 Share with traders following GBP pairs

EURUSD Short: Head & Shoulders at Resistance - Target 1.1670Hello, traders! EURUSD previously traded within a well-defined Descending Channel, confirming sustained bearish pressure and controlled sell-side momentum. Price consistently respected the channel boundaries, forming a sequence of lower highs and lower lows. Multiple breakout attempts occurred within the channel, but each upside move was capped by the descending resistance, reinforcing the bearish structure. The market eventually reached a clear Pivot Point near the lower channel boundary, where selling pressure weakened and buyers briefly stepped in, producing a corrective rebound rather than a full trend reversal. Following this rebound, EURUSD pushed higher and managed to break above local resistance levels, leading to a short-term bullish expansion. However, this move lacked strong follow-through and transitioned into a distribution phase near the Supply Zone around 1.1760. At this area, price formed a clear Head and Shoulders pattern, signaling exhaustion of bullish momentum and a return of sellers. The left shoulder, head, and right shoulder developed directly under resistance, confirming strong supply presence and rejection from higher prices.
Currently, price has broken below short-term structure and is pulling back from the supply zone, signaling the start of a corrective-to-bearish continuation move. The market is now rotating lower toward the Demand Zone around 1.1670, which aligns with a previous breakout level and acts as the nearest downside objective. This zone represents a key area where buyers may attempt a reaction, but overall structure still favors sellers.
My primary scenario is bearish as long as EURUSD remains below the 1.1760 Supply Zone and continues to show rejection from this area. The current pullback appears impulsive rather than corrective, favoring continuation toward the 1.1670 Demand Zone. A clean breakdown and acceptance below demand would confirm further downside continuation. Until then, this level remains the key decision point. Manage your risk!

USDCAD – Bullish Harmonic Completion at Key SupportUSDCAD – Bullish Harmonic Completion at Key Support
USDCAD has completed a clear bullish harmonic pattern, with price reacting precisely from the D completion zone.
This pattern is increasing the probability of a technical rebound from this area.
After the strong bearish leg into point D, price is showing early signs of stabilization, suggesting that selling pressure may be exhausted.
Upside targets are set at 1.3855 and 1.3895, which align with the previous structure and resistance zones. A clean break and hold above the first target could open the door for a deeper recovery.
You may find more details in the chart!
Thank you and Good Luck!
PS: Please support with a like or comment if you find this analysis useful for your trading day

EURUSD Breakout and Potential RetraceHey Traders, in today's trading session we are monitoring EURUSD for a buying opportunity around 1.17200 zone, EURUSD was trading in a downtrend and successfully managed to break it out. Currently is in a correction phase in which it is approaching the retrace area at 1.17200 support and resistance area.
Trade safe, Joe.

BITCOIN - Manipulation and liquidity hunting before the crash BINANCE:BTCUSDT.P is stuck in the range of 85K - 90K. There is no liquidity in the market, but at the same time, the downward trend continues...
Earlier, we discussed such a nuance as the breakdown of support for the upward local trend. The global trend is bearish, and this nuance generally indicates a weak market. In addition to this, there is no liquidity in the market: there has been no inflow of funds into the cryptocurrency market in the last few weeks, hence the current manipulations that have been taking place over the last few days. (A low-liquidity instrument is easy to control...)
Technically, Bitcoin is within the trading range of 85,000-89,400, which is formed after the breakout of the support of the upward channel, i.e., in the short zone. A retest of 89-90K could lead to a short squeeze and a fall.
Resistance levels: 89,400, 89,900, 90,600
Support levels: 85,000, 83,800
A short squeeze and liquidity capture relative to the specified resistance zone could trigger a further decline, provided that bears keep the market near the previously broken boundary of the upward line...
Sincerely, R. Linda!

New Highs, No Sell-Off — Smart Money In?Based on the current news backdrop combined with the price structure on the chart , I continue to hold the view that XAUUSD is in a clear and healthy uptrend — not a temporary or emotional spike.
Gold setting a new all-time high around 4,400 shows that the market is strongly pricing in the likelihood of further Fed easing and future rate cuts . More importantly, after making new highs, price did not experience aggressive selling , but instead managed to hold at elevated levels — a clear sign that large capital flows are staying in the market, rather than this being a short-lived FOMO-driven move.
Looking at the chart, gold is moving cleanly along its ascending trendline , with consistent support from the Ichimoku system and dynamic support zones below. The recent pullbacks have been purely technical, allowing the market to “catch its breath” and absorb supply, without breaking the overall structure. This is a market that is moving strong — not overheating.
For me, the 4,380 zone remains a key support level. As long as price holds above this area, the bullish trend remains fully intact. In the short term, my preferred scenario is light consolidation at high levels, followed by a continued push to retest the 4,450 area.
In summary, I continue to favor BUY setups on pullbacks — not chasing price at the highs and never trading against the trend. When both fundamentals and technicals align, the most important skill is patience and discipline to stay with the trend, rather than trying to pick a top in a market that is clearly strong.

Elise | XAUUSD – 30M -Liquidity Sweep → Trend Continuation SetupOANDA:XAUUSD
The sharp downside spike into 4308 was a liquidity grab, not a breakdown. Buyers stepped in aggressively, flipping momentum and pushing price back into a controlled bullish leg. Current pullback is corrective, not impulsive — suggesting continuation toward higher resistance if structure holds.
Key Scenarios
✅ Bullish Case 🚀
As long as price holds above 4332–4335, upside remains active toward:
🎯 4350
🎯 4365
🎯 4375 (Major Resistance Zone)
❌ Bearish Case 📉 (Invalidation)
A clean break and close below 4325 opens downside toward:
🎯 4312
🎯 4308 (Liquidity Base)
Current Levels to Watch
Resistance 🔴: 4350 → 4365 → 4375
Support 🟢: 4335 → 4325 → 4308
⚠️ Disclaimer: This analysis is for educational purposes only. Not financial advice.

ETHUSD – Technical Rebound Within a DowntrendHello, this is Domic.
Looking at the ETH daily chart, the current picture is quite clear: the primary trend remains bearish, and the recent upside move should only be viewed as a technical rebound.
Price is still trading below both EMA34 and EMA89, with EMA34 having crossed below EMA89 and both moving averages sloping downward. This is a textbook setup of a medium-term downtrend, not a sideways phase or a basing process. As long as this structure holds, there is no solid basis to talk about a trend reversal.
On the upside, EMA34 around the 3,090 level is acting as a dynamic resistance . Price has repeatedly rebounded into this zone only to be pushed back down, indicating that sellers are clearly defending this area. The higher EMA89 further reinforces the idea that ETH still lacks the strength needed to shift the broader trend.
The quality of the current rebound also does not favor the bulls. Rebound candles are small and choppy, with lower highs forming, while volume shows no sign of strong capital inflows. In addition, this week falls into a holiday period, leading to reduced market liquidity, which makes price movements more sluggish and lacking breakout momentum.
Wishing everyone successful trading!
GBP/USD | BSLs ahead! (READ THE CAPTION)As you can see in the hourly chart of GBPUSD, it has broken through both the FVG and IFVG and is now in the supply zone. There are BuySide Liquidities above at 1.34466 and 1.34559 which I expect to be swept away.
Mind the fact that we don't have any impactful news today and is practically the last week of the year, so please don't get yourselves hurt.
