AUD/JPY - Bullish Flag (03.11.2025)🧠 Setup Overview:
AUD/JPY is forming a Bullish Flag Pattern on the 30-minute chart — a continuation setup suggesting potential upside momentum after consolidation. The price has respected the flag support zone and is attempting a breakout above the descending channel, signaling renewed bullish pressure.
💡 Technical Plan: Pattern: Bullish Flag Pattern
Bias: Buy after confirmation breakout and retest
Support Zone: 100.650 – 100.700
Entry Zone: Near 100.850 – 100.900 (after breakout confirmation)
Targets:
🎯 1st Resistance: 101.460
🎯 2nd Resistance: 101.753
Invalidation: Close below 100.600 negates the bullish bias
🌏 Fundamental Insight (Today – 3 Nov 2025)
The AUD finds strength as China’s manufacturing PMI beats expectations, improving sentiment for commodity-linked currencies.
Meanwhile, the JPY remains under pressure due to continued Bank of Japan dovishness and yield differentials favoring risk assets.
Market tone is risk-on, further supporting bullish momentum in AUD/JPY.
⚠️ Disclaimer:
This setup is shared for educational purposes only. It is not financial advice. Always do your own analysis and apply proper risk management before trading any setup.
#AUDJPY #Forex #TechnicalAnalysis #PriceAction #BullishFlag #BreakoutTrading #Ichimoku #KABHI_TA_TRADING #ChartsDontLieTradersDontQuit #ForexSetup #MarketAnalysis #TradingView #FXMarket #BuySetup #ForexCommunity #AUD #JPY #ForexTrader
💬 Support My Work ❤️
If you find this analysis useful — LIKE 👍, COMMENT 💭, and FOLLOW 🔔 for more daily Forex chart updates and trade setups!
Community ideas

Lingrid | GOLD Weekly Market Outlook. Rally’s End or Reset?OANDA:XAUUSD explosive October rally — crowned by a historic monthly candle that shattered resistance and ignited euphoria — has now entered its reckoning phase. What looked like unstoppable momentum is now revealing signs of exhaustion. The sharp, volume-fueled drop toward $4,000 isn’t just a “healthy correction” — it’s the first real test of whether this bull can withstand gravity. And right now, the charts are whispering: "it may go down south".
The 4H chart reveals a classic “impulse leg” followed by an aggressive A-B-C correction — and we’re still in the “C” leg. But here’s the twist: if price breaks below $3,850 with conviction, the entire bullish structure collapses. That would open the door to a much deeper pullback — potentially down to $3,700 or even $3,600, targeting prior support zones and retesting the long-term upward channel’s lower boundary.
The monthly chart confirms the big picture: gold is in a powerful uptrend, but also in overbought territory after a vertical spike. The October candle closed above its open — a sign of strength, yes — but also a potential exhaustion signal since it formed a pinbar pattern. When markets rise too fast, they often fall harder.
In essence, gold is no longer climbing — it’s consolidating under pressure. The bull hasn’t died, but it’s breathing heavily. For us, this means one thing: sell the rips, buy the dips only if structure holds. The path of least resistance may now be downward. We should wait for confirmations.
If this idea resonates with you or you have your own opinion, traders, hit the comments. I’m excited to read your thoughts!

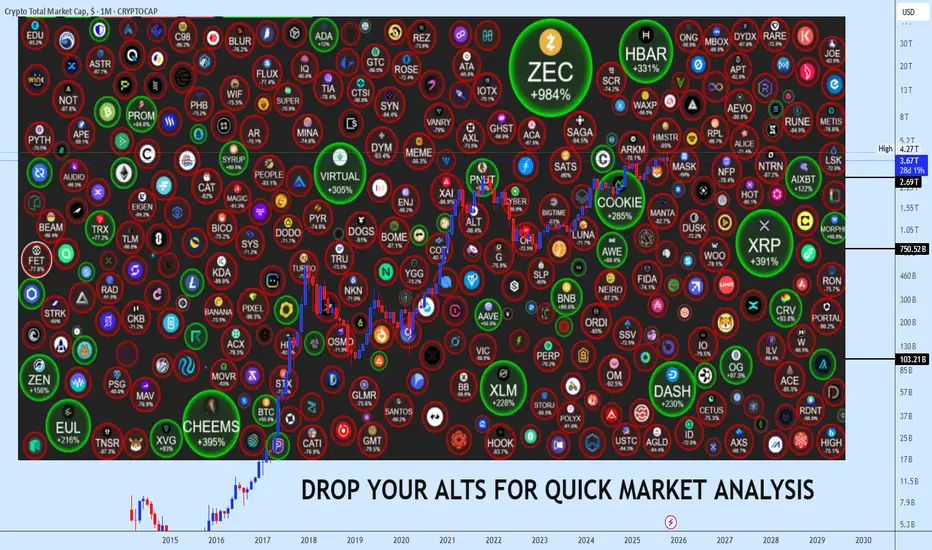
November Alts Request Window Now OpenFamily, November isn’t just another month, it’s decision time. We’re standing at the edge of the 4-year cycle’s final act, where altcoins will either explode into new expansions or vanish in liquidity drains. Every choice from here carries weight this selection window could decide the next cycle’s biggest winners.
📌 Submission Deadline: November 5th, 2025
📌 Target Coins: 30 slots only
📌 Requirements:
1. Must display solid liquidity and a clear technical structure
2. Should reflect sustainable narratives or active ecosystem growth
3. Avoid dead or illiquid tokens only serious and relevant projects
As always, every suggested coin will be carefully screened, but only those that align with both the broader cycle context and our technical framework will be considered for full analysis. The objective remains unchanged to position ourselves where the next rotation wave is most likely to ignite as BTC completes its dominance move and liquidity begins rotating into alts.
Remember: These late-cycle months often decide the real winners heading into the next expansion phase. Let’s keep our list sharp, high quality, and cycle aligned.
Drop your suggestions below November isn’t the month to hesitate.
If this resonates with your outlook for the month ahead, hit the like button, share it with your circle, and let’s build this month’s list together.
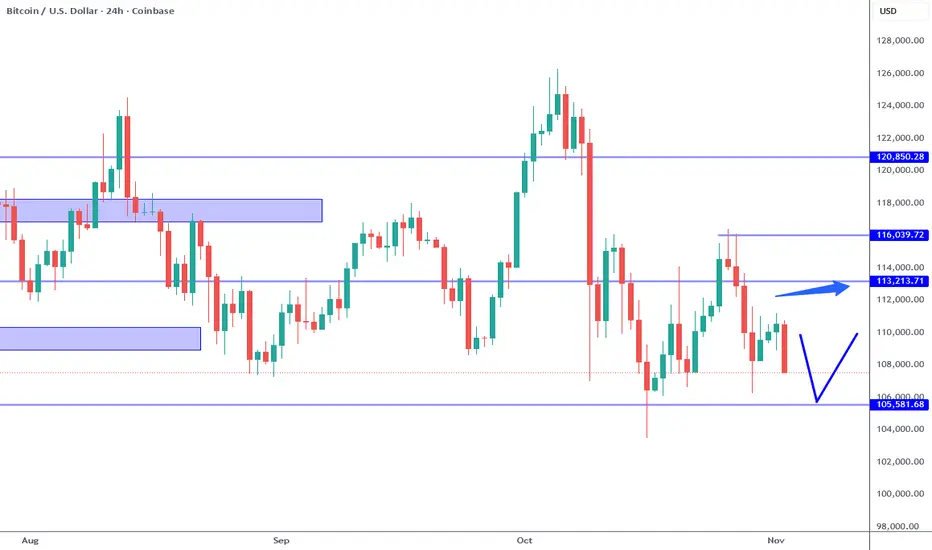
Bitcoin: Watch 105K For Bullish Reversal Again.Bitcoin all over the map. Pay attention to the nearest support and resistance levels which are 113K resistance and 105K support. 109K a minor support has been broken again. There is no way to know which way this market will break on the short term. The general trend is still bullish, BUT resistance levels like 113K and 118K AREA have yet to break.
Smaller time frame momentum is arguably bearish which is good for day trade strategies, otherwise there is not much to do on the swing trade time frame at current prices. A test of the 105K support is likely to follow this week, which can present an attractive swing trade long opportunity (upon confirmation). IF 105K breaks, the next area to watch is the 103L to 100K area for a bullish reversal. This location is also a major psychological level which is also attractive for investing.
Also worth mentioning, there is a head and shoulders formation on this chart, and while it implies bearish possibilities, I would put more emphasis on the levels because these patterns can easily appear randomly. Support and resistance levels, which can also be random, are more relevant in my opinion because of previous trader/investor behavior (or being stuck in a position). Either way do not jump to conclusions or grasp at the obvious. Notate levels, then wait for price to react there and provide a way to measure risk.
Another important note is the CHANGE in Chairman Powell's rate cutting intent during the FOMC press conference over the previous week. When asked about the December rate decision, he explained that is was NOT a sure thing. Based on previous comments and hints, the market seemed to have priced in a December rate cut. Since this comment, the market has cooled off a bit from the constant new all time high every day party. Just goes to show, all it takes is a just few unexpected words to change sentiment. There is NO way to see something like this coming on a chart.
This along with the lack of government data can invite unexpected surprises bullish or bearish. This is why in a game of incomplete information, it is best to focus on RISK, not obsess over forecasts.
Latest Gold Price Update: Buy or Sell?👋Hello everyone , great to see you again in today’s discussion about OANDA:XAUUSD !
Last week, gold traded under strong bearish control, pressured by a series of negative headlines including the U.S.–China trade developments and cautious remarks from Fed Chair Jerome Powell. Entering the new week, the downtrend still shows no signs of reversal, with prices hovering around $4,025 at the time of writing.
Another noteworthy factor comes from China, the world’s largest consumer of gold. The Chinese government has just announced a new policy canceling the VAT deduction for gold trading companies. This change means higher domestic purchase costs, which could significantly dampen gold demand within the country. Analysts believe this policy will add downward pressure on international gold prices, given China’s critical role in global physical demand.
Meanwhile, the strong U.S. dollar and rising Treasury yields continue to act as the two “clamps” squeezing gold’s recovery momentum. The combination of a firm USD and higher yields has dragged gold back below the $4,000/oz level. Previously, gold had surged to record highs fueled by expectations of Fed rate cuts, geopolitical tensions, global slowdown fears, and robust central bank gold buying. But now, those catalysts appear to be losing their grip, with markets returning to a more balanced state.
From a technical perspective, gold has weakened after reaching the short-term resistance zone at $4,045–$4,050, which also aligns with the key confluence area between resistance and the EMA 89 line. It’s likely that prices will form a short-term top around this region and then reverse lower, with the next target heading toward the strong support zone marked — an area where the market previously saw notable buying reactions last week.
The key question now is: Will gold manage to rebound from here or continue its decline in the coming sessions?💬 Share your thoughts in the comments below!

Euro continued Weakness Points to 1.1480 RetestHello traders, I’d like to share my view on EURUSD. The current market structure shows a clear bearish momentum, with the pair consistently forming lower highs and lower lows inside a well-defined descending channel. The rejection from the 1.1660 Resistance Zone — which coincides with a strong Seller Zone — marked the beginning of a sustained downtrend. After a fake breakout attempt above the resistance, the market quickly reversed and continued to decline, confirming that sellers remain in control. The pair is now trading close to the Buyer Zone, which aligns with the Support Level around 1.1500–1.1480. This area has historically acted as a key demand region, making it crucial for the next price reaction. At the moment, EURUSD is respecting both the Resistance Line and the Support Line within the channel, showing the continuation of the bearish cycle. My primary scenario anticipates a potential short-term pullback toward the upper boundary of the channel (around 1.1560–1.1580) before another bearish impulse develops toward TP1 at 1.1480. However, a confirmed breakout above 1.1600 could invalidate this bearish setup and open the way for a broader correction toward the 1.1660 Resistance Level. Until then, the trend remains bearish, and I favor short opportunities targeting 1.1480 as the next key level. Please share this idea with your friends and click Boost 🚀

EUR/USD: Classic Breakout Trade - Don't Miss the Move!The 📉EURUSD pair experienced a decisive breakout and closed below a significant daily/intraday horizontal support cluster on Friday.
Following this breakout, the pair started to consolidate on an hourly timeframe, on the previously breached structure.
The bearish violation of this consolidation serves as a strong bearish confirmation.
Conversely, the price is projected to continue its downward trajectory, with a likely target of at least 1.1500.

Busy trading week coming up!!The trading week of November 3–7 is considered a pivotal period for international financial markets. A series of high-level economic data including manufacturing and services PMIs, ADP non-farm payrolls, trade balances, and interest rate decisions from major central banks will create a mixed picture of the global economic cycle. Meanwhile, statements from Federal Reserve officials and geopolitical developments can reinforce or distort monetary policy expectations later in the year.
🔹 Monday – Global PMI:
PMI figures from China, Europe, the UK, and the US kick off the week, reflecting the overall health of global manufacturing. Weak data could boost expectations for monetary easing, while stronger results may reinforce inflation-control policies. Additionally, the outcome of the OPEC+ meeting could impact oil prices and inflation trends.
🔹 Tuesday – Monetary Policy & Trade:
Focus turns to the RBA (Australia) rate decision and Canada’s trade balance. The market expects the RBA to keep rates unchanged at 3.6%, but a “hawkish” tone could trigger volatility in AUD. Speeches from Fed and BoC officials will also provide further clues on the 2025 rate-cut cycle.
🔹 Wednesday – Services & Employment:
The US Services PMI and ADP employment report will take center stage. These data points often provide early hints for the Non-Farm Payrolls report. Crude oil inventories from API and EIA will continue to influence oil prices and inflation expectations.
🔹 Thursday – European Data & BoE Decision:
The Bank of England may cut interest rates by 25 basis points to 3.75% amid recession concerns. Germany’s retail sales and industrial production figures will offer insights into the region’s economic health.
🔹 Friday – China & the Fed:
China’s trade balance and a series of speeches from five FOMC members will dominate attention. Any comments related to inflation or December rate decisions could cause sharp moves in USD and gold.
Three Key Risks to Watch:
1️⃣ Data Divergence: PMI or ADP figures may diverge significantly from official data, sparking volatility in market expectations.
2️⃣ Policy Surprises: Unexpected moves or tone shifts from the RBA or BoE could trigger market shocks.
3️⃣ Geopolitics & Liquidity: Escalating tensions in Russia–Ukraine or the Middle East, along with oil price swings, could drive safe-haven flows into gold and USD.
Technical analysis of OANDA:XAUUSD
Gold price is hovering around the $4,000/oz mark, after recovering slightly from the 0.382 Fibonacci support zone at $3,972/oz. The recent decline remains within a short-term correction channel, but selling pressure has slowed as the RSI exited the oversold zone and showed signs of forming a technical bottom.
The EMA21 (around $4,055/oz) is currently acting as an important resistance. If the price breaks above this level decisively, the short-term correction structure could be completed, opening a new uptrend towards the $4,128–$4,200/oz area (Fibo 0.236 and the most recent old peak). Conversely, if gold fails to surpass the EMA21, the correction could continue towards $3,846 or $3,720/oz – the next two support zones corresponding to the Fibo 0.5 and 0.618 levels, respectively.
Note: RSI momentum is still weak, so further confirmation with trading volume and reversal candlestick signals is needed before opening a long position.
SELL XAUUSD PRICE 4091 - 4089⚡️
↠↠ Stop Loss 4095
→Take Profit 1 4083
↨
→Take Profit 2 4077
BUY XAUUSD PRICE 3954 - 3956⚡️
↠↠ Stop Loss 3950
→Take Profit 1 3962
↨
→Take Profit 2 3968

Gold Nears Resistance — Buyers Target $4,130 BreakoutHello traders, here’s my current outlook on Gold (XAUUSD). The market structure shows that Gold has recently shifted from a sharp bearish phase into a short-term recovery pattern, finding solid demand near the $3,940–$3,950 Buyer Zone. After the last strong drop from the $4,130 Resistance Level, price stabilized within this accumulation area and began forming an ascending structure supported by a clear Support Line. Currently, Gold is trading inside a rising wedge pattern — a signal of a tightening market where buyers are gradually gaining ground. The Resistance Line near $4,050 represents a short-term barrier, and a confirmed breakout above this level could open the way for a move toward the $4,130 Resistance Zone (TP1), which aligns with the previous Seller Zone. From my perspective, as long as the price remains above the $3,940–$3,950 Support Zone, the bullish bias remains valid. A successful breakout above $4,050 would likely confirm the continuation of the current upward momentum, targeting $4,130. However, if the price fails to break above resistance and falls below the ascending support line, a short-term pullback toward the Buyer Zone could occur before any new bullish wave develops. In my opinion, the market structure currently favors buyers, with strong support underpinning the move. Therefore, I’m expecting a potential bullish continuation toward $4,130 as the next key target.

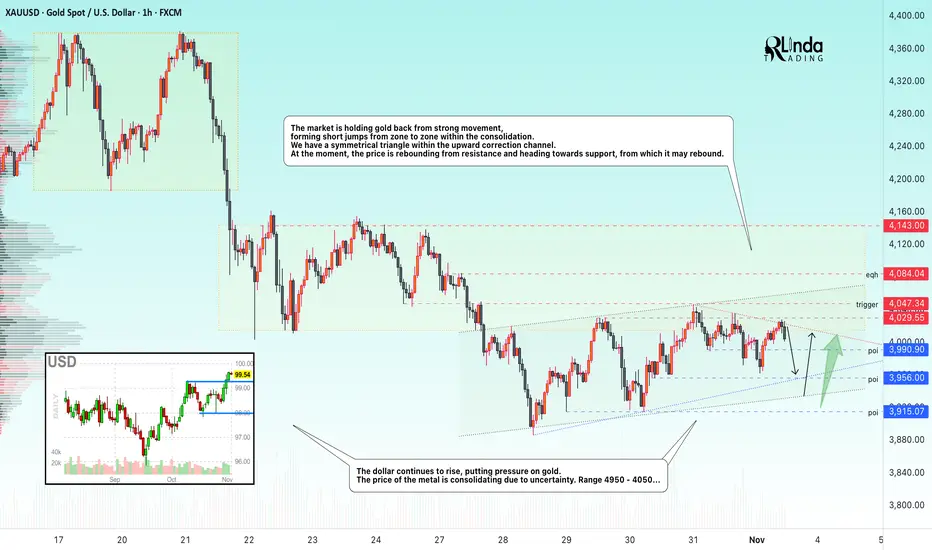
GOLD → Consolidation within a symmetrical triangle The market is holding gold back from strong movement, forming short jumps from zone to zone within consolidation. We have a symmetrical triangle within an upward correction channel.
Key supporting factors:
The US shutdown is becoming the longest in history, increasing economic risks.
China is canceling tax breaks for retailers. Trump may announce new tariffs related to China.
ISM Manufacturing PMI data (US) is ahead - a rare indicator during the shutdown.
The probability of a Fed rate cut in December has fallen to 69% (from 91.7% a week ago).
Technically, consolidation may continue until the price breaks one of the boundaries of the symmetrical triangle.
Support levels: 3990, 3956, 3915
Resistance levels: 4030, 4047, 4085
Traders are uncertain about the future direction, and as a result, the market is consolidating. There are limit levels both below and above that are holding back movement. Accordingly, until there is a clear fundamental background, it is possible to focus on trading within the channel. I expect a rebound from 3960 for a retest of resistance. However, a close above 4030 could trigger growth, while a close below 3956 would confirm the weakness of the market and trigger a fall to 3900.
Best regards, R. Linda!
GBPCAD The Fish Hook: Buyers Ready to Reel it in?After a sharp drop, sellers began losing momentum, notice how the candles started to flatten out near the bottom, showing exhaustion.
Then, we see buyers are starting to step in, creating a rounded base, this forms the hook of the pattern.
The real shift happens if price snaps with strength above short-term resistance, trapping late sellers and signaling the start of a potential bullish reversal.
If this happens, such a sudden shift would start a strong continuation move, with targets aiming toward 1.87330.

BTCUSDT: Buyers Aim for Recovery Toward $115K ResistanceHello everyone, here is my breakdown of the current Bitcoin setup.
Market Analysis
Bitcoin (BTCUSDT) is showing a constructive bullish setup after rebounding from the 106,600–107,000 Support Zone. This area has consistently acted as a strong demand region, confirming buyers’ interest each time price tested the lower boundary of the Upward Channel. The market structure has remained bullish overall, characterized by a series of higher highs and higher lows since the correction phase in mid-October.After a recent fake breakout below the support line, buyers quickly regained control, pushing price back above the channel’s lower boundary. This rejection from support and recovery above 110,000 suggests renewed bullish momentum.
Currently, BTCUSDT is approaching the midline of the channel, while short-term resistance lies at 115,400 — a level that coincides with a previous fake breakout zone and horizontal supply area.
My Scenario & Strategy
As long as BTCUSDT holds above the 109,000–110,000 region, the bullish scenario remains valid. I expect the price to continue climbing toward the 113,000–115,400 Resistance Zone in the near term. A clean breakout above 115,400 could open the way for another bullish leg toward the upper boundary of the channel near 117,000–118,000.
However, a confirmed rejection from 115,400 could trigger a temporary pullback toward the support trendline before another potential push higher. In my view, Bitcoin remains in a healthy uptrend, and I prefer to look for long opportunities from dips above the support line, targeting 115,400 (TP1) and potentially 117,000 (TP2).
That's the setup I'm tracking. Thank you for your attention, and always manage your risk.

EURUSD: Sellers Take Control After Breaking TrendlineHello traders, what’s your view on EURUSD?
At the start of the new week, EUR/USD is trading around 1.153, continuing its downward correction after breaking the medium-term ascending trendline and failing to stay above the dynamic resistance zone 1.1600 – 1.1630. This movement indicates that sellers are in control as the Euro’s recovery against the USD remains weak.
On the technical chart, the market structure clearly shows a break-and-retest pattern — price has broken below the trendline and is now performing a technical pullback to retest resistance. As long as price remains capped below the trendline, there is a strong likelihood that it will continue to decline toward the 1.1450 – 1.1400 support area, which acted as a key base in previous months.
What about you — how do you see the EURUSD trend developing from here? 💬

THE KOG REPORTTHE KOG REPORT
Quick KOG Report this week.
Firstly, we would say it’s the first trading day of the new month so maybe an idea to let the market find it’s feet before jumping in. We’re only going to share the potential path this week and the red box target levels on the breaks. We’ll also stick with some of the red boxes from last week with the new levels to watch out for.
RED BOXES:
Break above 4010 for 4016, 4030, 4044 and 4050 in extension of the move
Break below 4001 for 3995, 3986, 3971 and 3959 in extension of the move
Please do support us by hitting the like button, leaving a comment, and giving us a follow. We’ve been doing this for a long time now providing traders with in-depth free analysis on Gold, so your likes and comments are very much appreciated.
As always, trade safe.
KOG

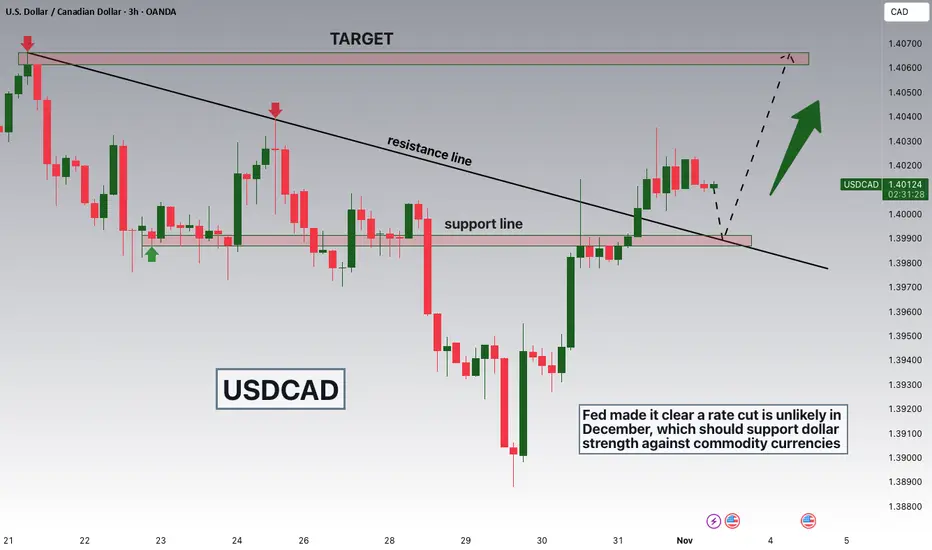
USDCAD Breakout and Potential RetraceHey Traders, in today's trading session we are monitoring USDCAD for a buying opportunity around 1.39900 zone, USDCAD was trading in a downtrend and successfully managed to break it out. Currently is in a correction phase in which it is approaching the retrace area at 1.39900 support and resistance area.
Fundamentally fed made it clear that a rate cut is unlikely in December which should strengthen the dollar against commodity currency!
Trade safe, Joe.
XAUUSDHello Traders! 👋
What are your thoughts on GOLD?
Gold has entered a sideways and choppy phase after reaching a new high and undergoing a correction.
The price is now consolidating within a narrow range between support and resistance, showing limited directional momentum in the short term.
In this area, we expect a short-term upward correction before the market resumes its downward move toward the highlighted support zones.
As long as gold remains below the resistance zone, the market is likely to continue its range-bound behavior followed by another bearish leg.
Don’t forget to like and share your thoughts in the comments! ❤️

Bitcoin Rebound from Support Zone Targets 109,400Bitcoin (BTC/USD) is rebounding from the support zone near 106,000, showing signs of a potential upward move. The next resistance targets are around 108,000 and 109,400 levels.

Peak Tech Earnings Wrapped Up: Here Are the Winners and LosersWe're past that time when we all get glued to the dual-monitor setup and watch the titans of tech parade their financials.
Last week was the Super Bowl of earnings season, with Meta NASDAQ:META , Microsoft NASDAQ:MSFT , Alphabet NASDAQ:GOOGL , Apple NASDAQ:AAPL , and Amazon NASDAQ:AMZN all reporting in the span of just a couple of days.
The result? A mixed bag of profits, promises, and expenses, all revolving around the familiar AI growth story. Some soared. Others sank. And everyone was reminded that in Big Tech , growth costs money — a lot of it.
Let’s unwrap what happened in the most influential week of the earnings calendar .
🥴 Meta: The Spending Spree Continues
Meta NASDAQ:META suffered the most bruising showing. On paper, revenue looked great — $51.2 billion, up 26% year over year and above estimates. But earnings per share? A brutal $1.05, far below the expected $6.72, after a nearly $16 billion one-time charge tied to President Trump’s “Big Beautiful Bill.”
Without that charge, net income would’ve jumped to $18.6 billion. Instead, the headline number showed $2.7 billion — not exactly inspiring. But the real story wasn’t the miss. It was the spending.
Meta now plans to splurge $71 billion this year, up from $69 billion, mainly on AI data centers and a hiring binge in its research division. The stock dropped 11% on Thursday.
🧠 Alphabet: Ads Strong, Cloud on Fire
If Meta NASDAQ:META stumbled, Alphabet NASDAQ:GOOGL strutted. The Google parent beat on everything : earnings per share at $2.87 vs. $2.26 expected and revenue hitting a record $102.3 billion, up 16% year on year.
The company took a $3.5 billion fine from the European Commission — but even with that, margins looked healthy. Excluding the fine, the operating margin would’ve hit 33.9%. Not bad for a firm still making 85% of its money from ads.
The real fireworks were in Google Cloud, where sales rose 34% and profit margins improved to 24% from 17% last year. Alphabet stock jumped 2.5% Thursday.
🧩 Microsoft: Cloudy with a Chance of Heavy Capex
Microsoft NASDAQ:MSFT delivered classic consistency — and then some. The company reported earnings per share of $4.13, beating estimates, on $77.7 billion in revenue. Azure, the star of the show, grew 40%, topping expectations.
Yet shares dipped 3% the day after as investors fixated on capital spending. Microsoft shelled out $34.9 billion last quarter and warned that capex growth in 2026 will exceed 2025.
🍏 Apple: New Phone Who Dis?
Apple NASDAQ:AAPL is back, everyone. The company posted record revenue of $102.5 billion , slightly above expectations, and hinted that the holiday quarter will be even juicier.
CFO Kevan Parekh said sales could rise 10–12%, led by a “double-digit” surge in iPhone 17 upgrades. After years of lukewarm demand, Apple’s upgrade cycle looks hot again.
One blemish: China sales dipped, underscoring the company’s ongoing battle in its second-largest market. But services revenue — now over $100 billion annually — continues to shine as Apple quietly transforms into a subscription empire disguised as a hardware company.
The stock erased a 3% Friday gain to dip into the red.
🚀 Amazon: AI, Efficiency, and a Holiday Boom
Then there was Amazon NASDAQ:AMZN , the comeback kid of this earnings season. The e-commerce giant’s revenue soared 13% to $180 billion , and profit surged 39% to $21.2 billion. Solid.
Amazon Web Services grew 20%, its fastest clip since 2022, as AI demand turned into real money. CEO Andy Jassy said data center expansion will remain a top priority heading into 2025.
The company managed to sprinkle in some “efficiency” — laying off 14,000 employees, a move expected to cost $1.8 billion now but save plenty later.
Amazon’s stock shot up 10% in pre-market Friday, and held on to the increase, proving that just a select few companies can pivot from layoffs to record profits with such finesse.
🧾 The Takeaway
So, what did we learn from Peak Tech Week?
America’s highflyers are spending big to secure their AI future. The underlying theme is that AI costs a fortune, but not investing in it could cost even more.
In short — the future is bright, the bills are bigger, and the market’s message is clear: keep growing, but try not to spook traders while you do it. The earnings show continues with AMD NASDAQ:AMD and Palantir NASDAQ:PLTD reporting this week.
Off to you : Are you looking to scoop up some NASDAQ:META or sell some NASDAQ:AMZN ? Share your thoughts in the comments!

Exports Per Person US vs China In $Tariffs: putting things in perspective.
Per capita, the U.S. exports 3.5× more than China — about $9.4k vs $2.7k each.
So when politicians talk tariffs, remember who’s actually pulling more export weight per person.
Click boost follow for more Raw, Insightful, Authentic Economics

BoE Slows Down Rate Cuts – GBPUSD Gears Up for a Strong Rebound!Hello everyone,
The market’s attention this week is on the Bank of England (BoE) , and in my view, the central bank may slow its rate-cut cycle as inflation remains elevated and economic conditions are still uncertain. At the same time, the UK Manufacturing PMI edged up to 49.7, signaling a mild recovery after a prolonged slowdown.
➡ This dual signal supports the GBP, while the USD weakens slightly as the U.S. PMI stays below 50.
On the 4H chart, GBPUSD is moving within a falling wedge pattern — a classic structure that often indicates a potential bullish reversal . The 1.3060 area acts as a strong support, with clear buying pressure shown by the long-tailed candles. If this level holds, the pair is likely to rebound toward 1.3170, which aligns with the upper resistance of the wedge.
Preferred scenario:
Wait for a minor pullback around 1.3060, then buy following the recovery trend, targeting 1.3170.
With USD weakening and BoE staying cautious , GBPUSD now has a golden opportunity to bounce back from its technical bottom.

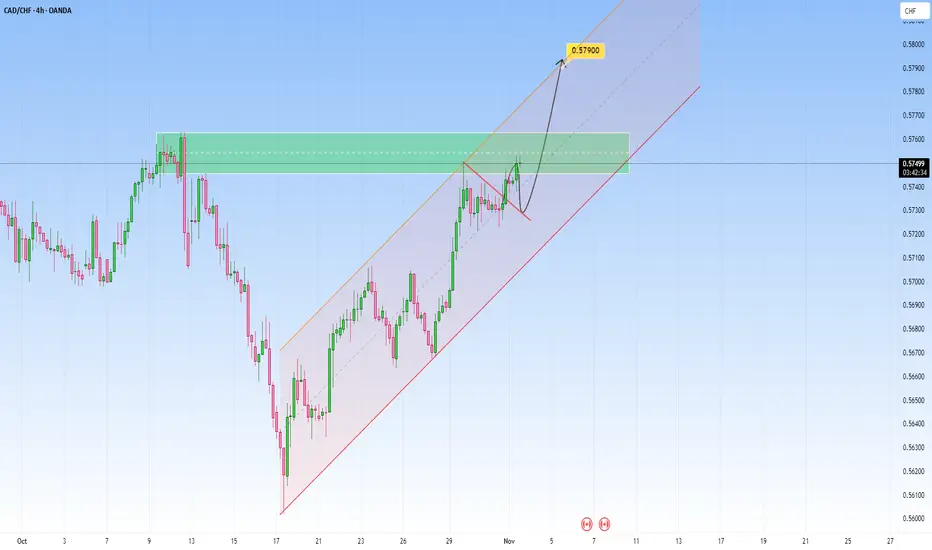
CADCHF Channel Rise in Motion: Buyers Target 0.5790CadChf price has been moving cleanly inside this rising channel, showing strong bullish structure with consistent higher highs and higher lows.
Buyers are now testing the resistance zone and momentum remains in their favor.
I expect a continuation toward 0.57900, the next projected level near the top of the channel.
As long as the structure holds above the midline of the channel, buyers remain in control, driving the next leg of the uptrend.
Is Gold Losing Steam or Building Strength for a New Rally?Hello everyone, gold is currently pausing around $4,017/oz after a strong rally throughout Q3, and the market is beginning to show signs of exhaustion in the trend. On the 4H chart, price no longer maintains the strong upward momentum seen before; instead, it is moving within smaller pullbacks and narrowing ranges – a typical sign of accumulation before the market chooses its next direction.
The macro backdrop is also contributing to gold’s slowdown. The recent meeting between the US and China ended positively, easing trade tensions – meaning the demand for safe-haven assets has softened. At the same time, China officially halted VAT tax deductions on gold from 1 November, raising the cost of physical gold purchases and cooling domestic demand. In the US, the Fed remains cautious, unwilling to commit to early rate cuts while employment data still indicates economic resilience. The USD Index has rebounded close to the 100 level, and bond yields remain elevated, putting natural corrective pressure on gold after its heated ascent.
From a technical standpoint, after hitting the $4,380 peak, gold has retraced to $3,950 and is now moving sideways within the $4,000 – $4,050 zone. This is a point of equilibrium, where neither buyers nor sellers are ready to take control. The $4,045 – $4,080 range is a notable resistance area, overlapping with an unfilled Fair Value Gap. If buying momentum is insufficient, price may easily be rejected there. Conversely, the $3,950 – $3,970 area continues to attract consistent buying interest, forming a reliable support base. Trading volume has been gradually declining, showing that the market is storing energy waiting for a catalyst. The upcoming NFP or CPI data could be the spark for the next major move.
If gold fails to break above $4,045 while the USD continues to strengthen, price could correct toward $3,960 to cool off before attempting a new rally. In contrast, if US economic data weakens or the Fed signals a softer stance, gold only needs to close above $4,050 to regain upside momentum and potentially move toward the $4,100 – $4,150 zone.
Right now, this is not an ideal area to open new positions, as price sits in the middle of balance – not risky enough to sell, but not safe enough to buy. The most sensible strategy is to wait for reactions at two critical levels: $3,960 and $4,045. A confirmed breakout or breakdown will be the market’s answer.
So, what about you – are you leaning towards a corrective move, or do you believe gold is simply gathering strength before returning to its bullish path?

EURUSD Short: Sellers Targeting Move Toward 1.1480 SupportHello traders! EURUSD continues to move within a clear bearish structure after facing strong rejection from the 1.1660 Supply Zone. The pair recently formed a Pivot Point at the top of the Ascending Channel, where a Fake Breakout signaled exhaustion among buyers and triggered renewed selling pressure.After breaking below the Ascending Channel, EURUSD established a new Descending Channel, confirming that sellers have regained momentum. The Supply Line has been well-respected, with each pullback offering another opportunity for sellers to enter the market.
Currently, the price is hovering near the Demand Line, around the 1.1520–1.1500 area, which coincides with a previous pivot zone. While a minor rebound from this level is possible, overall momentum remains bearish as long as price trades below the 1.1600–1.1660 Supply Zone.
From my perspective, EURUSD is likely to continue its downward move toward the 1.1480 Demand Level, aligning with the lower boundary of the current channel. A confirmed breakdown below 1.1480 could open the door for a deeper decline toward 1.1450. However, a strong bullish reaction from this area could lead to a temporary pullback toward 1.1560–1.1580 before the next leg lower. For now, I remain bearish on EURUSD, monitoring potential short setups from the upper channel boundary with a primary target near 1.1480. Manage your risk!
