USDJPY - Is the correction complete? Return to range...FX:USDJPY returns to an upward trend amid the growth of the dollar and the weakening of the Japanese yen. Focus on 154.5 - 155.0
Against the backdrop of the dollar's growth, the Japanese yen continues to lose value, which generally provokes the growth of the currency pair. If the bulls keep the price above 154.5 - 155.0, we can expect growth to 156.0 - 157.8.
A long squeeze and retest of the 153.0-152.5 zone is forming a reversal pattern as the impact of the Bank of Japan's interventions wears off. The price has returned to the range...
Resistance levels: 156.18, 157.78
Support levels: 155.0, 154.5, 154. 0
The price has returned to the range of 154.5 - 157.78, and technically, a retest of support and a battle between market participants for the key zone are possible. If the bulls keep the price within the range, the market may form growth within the trend.
Best regards, R. Linda!
Community ideas
Gold: Why Smart Money Is WaitingGold sits at $4,698.60 in technical limbo. We've got bearish structure meeting bullish divergence, creating a setup where patience beats aggression. The question isn't if gold moves, it's which direction gets the volume confirmation first.
1. THE TECHNICAL REALITY 📉
• Price below all three major EMAs (20/50/200) - bearish structure intact
• ADX at 46.2 confirms strong trending environment
• 69.6% upper wick shows aggressive seller defense at higher prices
• 24-hour range of $56.20 (1.20%) mostly retraced - hovering near lows
2. THE INDICATORS ⚖️
Bearish Signals:
• Below all major moving averages
• Massive upper wick rejection pattern
• Bearish order block resistance at $4,860-$4,971.90
Bullish Signals:
• MACD showing bullish divergence
• Histogram turning up despite price weakness
The Conflict:
Classic structural weakness versus shifting momentum. Volume at 47% of average means neither side has conviction yet, this is consolidation waiting to resolve.
3. THE TRADE SETUP 🎯
🔴 Scenario A: Continuation Lower (Higher Probability)
• Trigger: Clean break below $4,681.50 with volume confirmation
• First Target: $4,622.60 (24h low / filled bearish FVG zone)
• Extended Target: $4,596.70
• Stop: Above $4,860.00
🟢 Scenario B: Reversal Play
• Trigger: 4-hour close above $4,971.90 (bearish OB reclaim)
• Entry: Retest of $4,860.00 as support
• Target: $5,266.50 (bullish order block)
• Invalidation: Failure to hold $4,860.00 on retest
MY VERDICT
The risk-adjusted play is waiting for structure to clarify rather than catching falling knives. Gold respects levels cleanly, when it makes its move with volume, you'll know. Current lean: 62% bearish until proven otherwise.
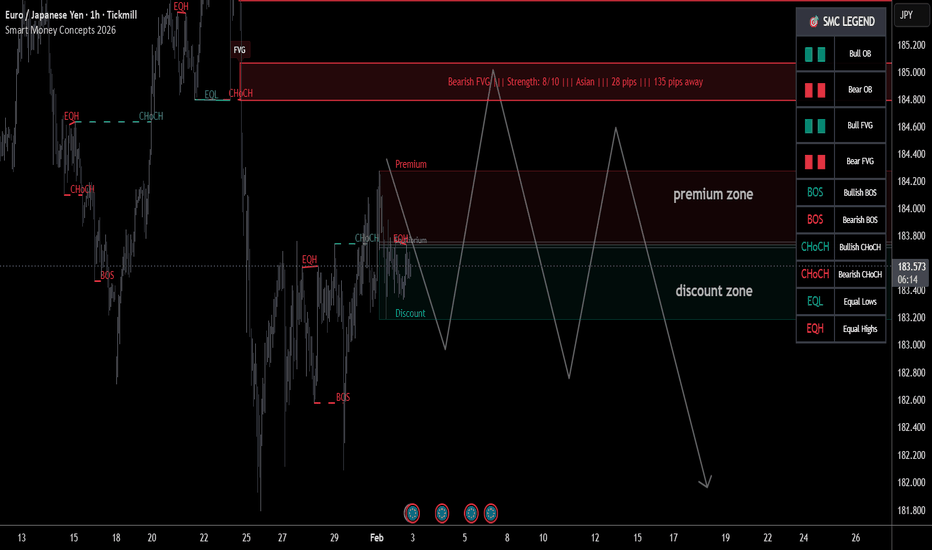
EURJPY Weekly Levels: Short Sell 185.00 Sweeps w/t Reversal🔱 EURJPY H1 SNAPSHOT — EXECUTIVE SUMMARY
🧨 Price is stuck in discount zone so longs are higher risk until overhead liquidity is dealt with
🔻 Key sell-side liquidity overhead at 185.00 strength 8/10 distance 135 pips
🧱 Secondary overhead level at 185.60 FVG strength 4/10 weaker follow-through zone
🟩 Key buy-side support cluster 181.00 bullish FVG strength 6/10 and 180.20 bullish FVG strength 9/10
🧲 Primary upside magnet is 185.00 where liquidity is most likely to pull price
⚠️ Long bias is higher risk here buy or hold only with tight control SL 25 pips exit target 185.00
🎯 Lower risk plan is patience wait for sweep and reversal at or near 185.00 then short
🛡 Short setup rules SL 35 pips TP1 plus 75 pips TP2 plus 150 pips
⏳ Swing version is valid but expect slower delivery to targets
🏦 Core play do not force entries mid-range let liquidity at 185.00 decide direction then execute
🗳️ EURJPY H1 SCENARIOS — WHAT’S YOUR PLAY
🅰️ Hold from discount → grind higher → tag 185.00 sell-side liquidity → take profit
🅱️ Push into 185.00 → sweep and reversal → short entry → TP1 plus 75 then TP2 plus 150
🅲 Spike into 185.60 FVG → rejection back under 185.00 → trend shift short continuation
🅳 Your key levels 185.00 as main decision point and 180.20 as strongest downside support zone
⬛ SMART MONEY CONCEPTS 2026 TradingView Indicator
🩶 Want to get all key levels marked up on your gold chart Automatically?
🩶 Get the latest FREE SMC script via link below.
🩶
🩶 Add to your Favorites List and then just add to any chart From Favorites
TradeCityPro | Bitcoin Daily Analysis #259Welcome to TradeCity Pro!
After a long break, let’s get back to Bitcoin analysis. This analysis is based on the daily timeframe.
Daily Timeframe
On the daily chart, Bitcoin’s trend turned bearish after stabilizing below 108,000, and the first bearish leg played out down to 85,000.
After a period of consolidation and a corrective move up to 97,000, Bitcoin started its next leg lower by breaking the 85,000 low, pushing price down to 76,000.
The 76,000 zone is a very important support area for Bitcoin and overlaps with the 0.618 Fibonacci Extension. We also have another support level around 72,000, so overall we can consider a major support range between 72,000 and 76,000.
A clean break of this zone would give us strong confirmation of a bearish trend, and if that happens, Bitcoin would officially enter a bearish cycle. As discussed before, this downside move could extend as far as 44,000.
At the same time, during this bearish leg, the RSI has dropped to its support around 22.27 and is now sitting at a momentum support level. If price continues to move lower without consolidation and RSI breaks below 22.27, we could see a very sharp sell-off.
Given the strength of the bearish trend, the next downward move could extend toward 65,000, 60,000, or even 53,000.
Personally, I’ll be looking to open short positions on a break below 76,000. However, if price fakes a breakdown in the 72,000–76,000 range, or finds support there and starts forming higher highs and higher lows, we can look for long opportunities on lower timeframes—because this 72k–76k zone is a very strong support area and won’t be easy to break.
❌ Disclaimer ❌
Trading futures is highly risky and dangerous. If you're not an expert, these triggers may not be suitable for you. You should first learn risk and capital management. You can also use the educational content from this channel.
Finally, these triggers reflect my personal opinions on price action, and the market may move completely against this analysis. So, do your own research before opening any position.
Lingrid | GBPJPY Channel Break Triggers AccelerationFX:GBPJPY remains supported above the rising trendline after printing consecutive higher lows, suggesting buyers may still be in control of the structure. Price is compressing beneath the upper boundary of the ascending channel while holding above the previous weekly high area, a zone that could act as a springboard. The recent pullback looks corrective, with no decisive bearish follow-through so far.
If price continues to respect the 212.35 support, momentum could expand toward the 214.00 resistance, where the higher-timeframe supply converge. A confirmed push through this ceiling may trigger acceleration, as liquidity above recent highs remains untested.
➡️ Primary scenario: hold above 212.35 → continuation toward 214.00
⚠️ Risk scenario: sustained acceptance below 211.30 may weaken the bullish channel and delay upside expansion
If this idea resonates with you or you have your own opinion, traders, hit the comments. I’m excited to read your thoughts!
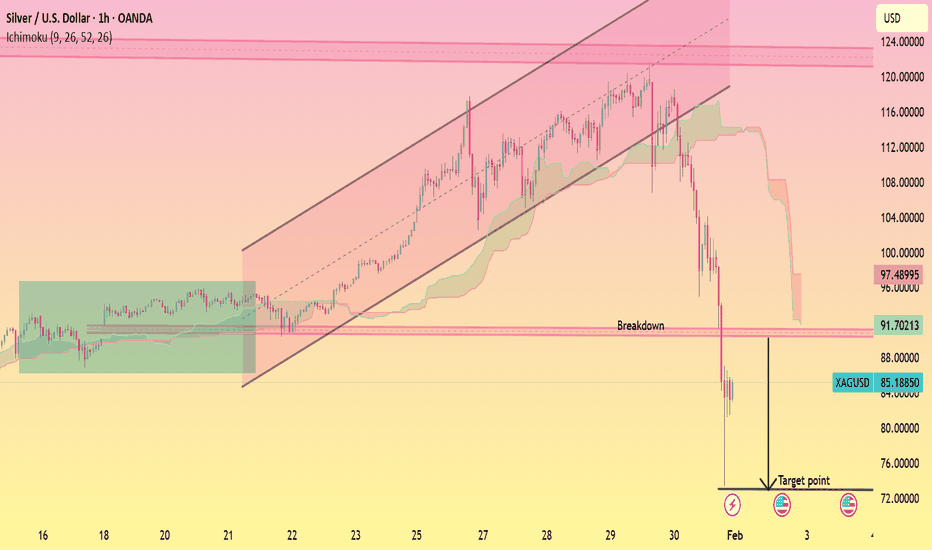
XAGUSD Channel Breakdown
This is a 1-hour XAGUSD (Silver/USD) chart. Price was moving in a clear ascending channel with Ichimoku support, then broke down below the channel and key support zone. After the breakdown, strong bearish momentum appeared, indicating a trend reversal from bullish to bearish, with downside continuation toward the marked lower target area.
GER40 ATHGER40 (DAX) – 4H Outlook
Price has swept liquidity below the previous range and reacted strongly from a key order flow / demand zone. This area aligns with prior lows, making it a high-probability support region.
As long as price holds above this zone, I expect a bullish continuation, with higher highs and higher lows forming. The projected path targets a recovery back toward the ATH zone.
Bias: Bullish after confirmation
Key focus: Reaction from the demand zone & structure shift
⚠️ This is not financial advice. Always manage risk.
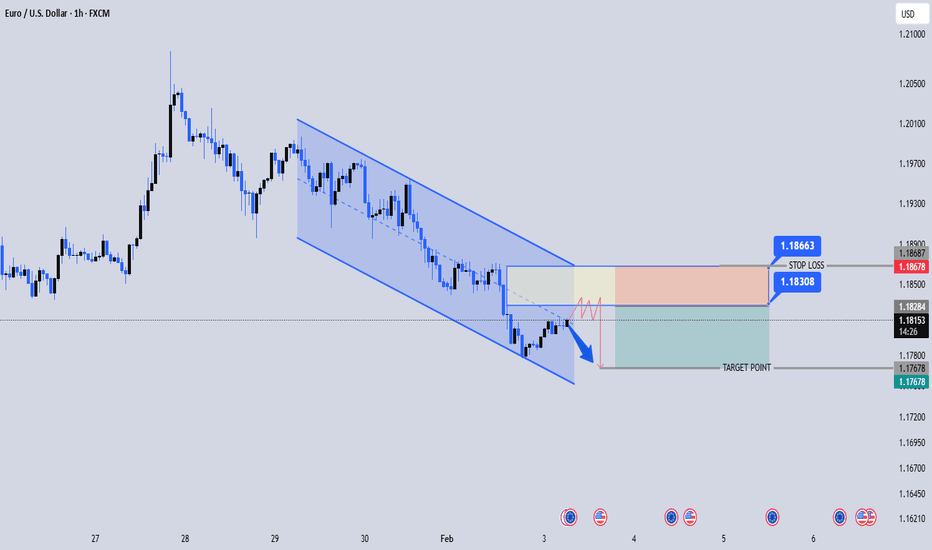
EURUSD 1H – Sell on Pullback After Channel BreakEURUSD – 1H Technical Analysis 📉
Market Structure: Clear bearish channel on the 1H timeframe. Price has been making lower highs & lower lows, confirming sellers are in control.
Current Move: After breaking the channel support, price is doing a pullback / retest into the broken structure (supply zone).
Bias: Bearish continuation favored.
Trade Idea (as shown on chart):
Sell Zone: 1.1830 – 1.1850 (pullback into resistance)
Stop Loss: 1.1868 (above structure / invalidation)
Target: 1.1767 (previous low / demand area)
Confirmation to watch .
Bearish rejection candles (pin bar / engulfing)
Weak bullish momentum during the pullback
Lower timeframe structure break to the downside
Summary:
As long as price stays below 1.1868, EURUSD is likely to continue lower toward 1.1767. Patience on entry = better risk-reward.
Hellena | Oil (4H): SHORT to 100% Fibo (59.144).As for oil, a major ABC correction in wave B of a higher order continues.
Wave “C” should be approximately equal to wave “A”, so I expect a correction in wave ‘B’ to the level of 63.789, followed by a decline in wave “C” to the level of 100% Fibonacci extension 59.144.
There is a possibility of wave “A” extending into the same area, but a correction before the decline seems more attractive and correct.
Manage your capital correctly and competently! Only enter trades based on reliable patterns!
Bitcoin Bottom?Bitcoin has dropped 41% from the recent highs. That's "normal," even in a bull market.
If this is a bear market, then 41% is well in proportion with the diminished upside that we saw during the bull (less than a 2X from the previous cycle highs).
I see no reason to go down 80% if we never saw the huge upside move.
I would be surprised if we go below the $60K area (200 MA), just over a 50% drawdown.
All of that said, Bitcoin currently is STILL holding a higher low - the dip over night took price $80 above the April lows. By this rationale, the bullish trend remains intact.
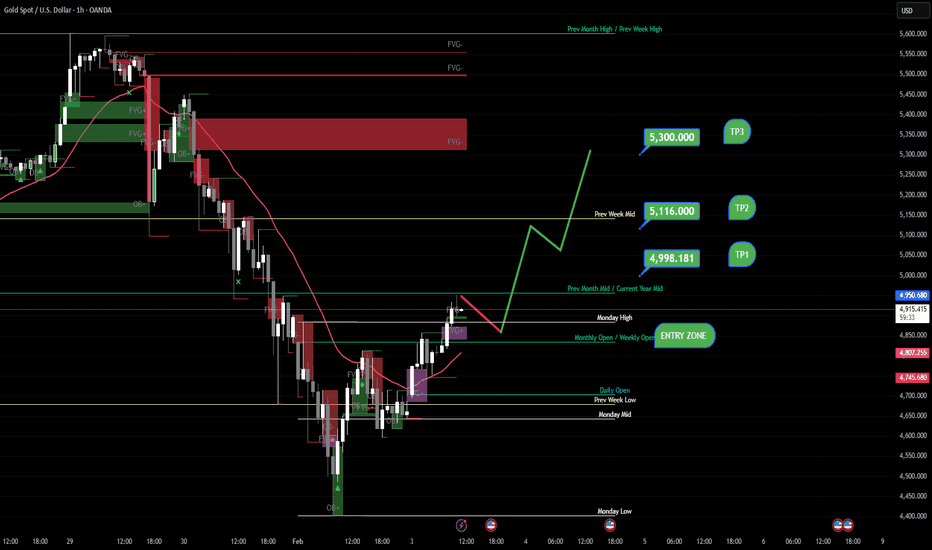
Gold 6% up, Strong bullish signs to take us back to $5300?Gold delivered a strong reaction yesterday, rallying $300+ into the first resistance zone at $4945, as outlined in the prior analysis.
After a ~20% correction, price action is now showing renewed buying interest, with geopolitical risk still elevated. Structurally, Gold is attempting to re-establish bullish momentum, but execution depends on pullback behavior.
I’m watching a pullback into the $4850 area as a potential entry zone. Acceptance above this level keeps the bullish continuation scenario intact.
LEVELS:
Entry zone: 4850
Targets: 4998 → 5116 → 5300
No chase at resistance. Execution requires confirmation.
Exact execution rules and continued analysis are shared in my free Telegram (link in profile).
#CCUSDT- Bullish Cup and Handle While Crypto Market Bleeds
Yello Paradisers!, Are you noticing how #CCUSDT continues to build a high-probability bullish structure despite the broader crypto market showing weakness?
💎#CCUSDT has been developing a well-structured cup and handle formation over the past 2.5 months, what makes this formation particularly notable is that it is occurring while overall crypto indices are trending down, yet #CC is outperforming the broader crypto market, even pushing toward new highs. This type of divergence is something experienced technical analysts always pay close attention to.
💎Price is currently compressing directly above resistance, which clearly signals supply absorption. Each pullback attempt is getting weaker, indicating that sellers are fading and demand is gradually taking control. In classical pattern trading, this tightening behavior at resistance is often the final phase before a volatility expansion to the upside.
💎The handle structure remains clean and controlled, without aggressive selling pressure. The $0.1060 level, marking the bottom of the handle, is the key technical support and invalidation level for the pattern. As long as price holds above this zone, the bullish thesis remains intact.
💎Another important technical factor is the lack of visible resistance above the breakout area. From a pure price-action standpoint, there are no significant supply zones overhead, which increases the probability of a smooth continuation.
💎Applying the measured-move principle based on the depth of the cup, the projected upside target aligns around $0.5400. This level represents the natural resistance area where momentum is statistically more likely to pause or consolidate after a confirmed breakout.
That is why we are playing it safe right now, Paradisers. If you want to be consistently profitable, you need to be extremely patient and always wait only for the best, highest probability trading opportunities.
MyCryptoParadise
iFeel the success🌴
Kaynes Technology India Ltd – Bullish Setup near Key Support |Instrument: Kaynes Technology India Limited
Exchange: NSE
Timeframe: Daily
Market Structure:
The stock is trading in an overall higher high – higher low structure,
indicating a primary bullish trend.
Observation:
Price has retraced towards a key support zone near the previous breakout area.
Buying interest is visible near support, suggesting potential demand.
No major structural breakdown is observed at this level.
Trade Plan:
Entry: Sustaining above 3580
Stop Loss: 3290
Targets: 4181/ 5300
Risk–Reward:
Approx 1:2 or better
Invalidation:
A daily close below 3325 will invalidate this bullish setup.
Note:
Wait for confirmation as per individual trading strategy and risk management.
Disclaimer:
This idea is shared for educational purposes only.
It is not financial advice.
Oil: A Volatile Playground with Measured Long OpportunitiesOil is an adventure for the faint of heart—gaps on openings and sharp moves are all part of this instrument. Perhaps only natural gas is more unpredictable.
Nevertheless, I currently see a decent opportunity to go long, with a fairly tight stop at 65.20—today’s low.
On the hourly chart, the price sits at the 50-period moving average, and from past experience since early January, we’ve repeatedly bounced up from this level.
Thus, I’ll try—my stop is about 1%—with a first target of 68.20 (around 3.75% gain) and a second target at 72.5, nearly 10 to 11% return.
Gold’s Bounce Is a Correction — Structure Still Favors SellersGold on the 1H timeframe remains structurally bearish. After the impulsive sell-off from the $5,599 high, price respected the Fibonacci downside extension and printed a clear five-wave decline, bottoming near $4,404. That low aligns with the 0.000–0.236 retracement zone, marking a logical short-term exhaustion area not a trend reversal.
The current move higher is best interpreted as an ABC corrective rebound. Price is reacting from wave (5) into wave (A) and may extend toward $4,827 and potentially $5,006, where prior structure, EMA resistance, and liquidity overlap. As long as gold trades below $5,006–$5,100, upside remains corrective and vulnerable to renewed selling pressure.
Key levels to watch
- Support: $4,404 (structure low / invalidation level)
- Corrective resistance: $4,827 → $5,006
- Trend invalidation: Acceptance above $5,100
Bottom line:
Gold is bearish by structure, corrective by position. Until price reclaims key structure above $5,100, rallies should be treated as sell-the-bounce opportunities, not confirmation of a new bullish trend.
Time To BUY USDJPY now...USDJPY has been in a clear uptrend for the last few weeks but recently dropped a slight bit in the last 24 hours down to a powerful support level! It is currently held by strong support levels which means it is extremely likely to keep heading to the upside for much longer. The next target will be the fibonacci extension zone which is shown on the chart. USDJPY has struggled to break below support but has constantly been breaking through resistance levels. time to BUY USDJPY.
CADCHF: When Can It Resume The Bullish TrendCADCHF: When Can It Resume The Bullish Trend
CADCHF is suffering from a prolonged downtrend due to issues that I will not explain in much detail.
CADCHF reached a historical low of 0.5600. This area has been tested three times so far and has bounced back up, indicating that we have strong interest from buyers.
There is a high possibility that CADCHF will slowly rise again to the top of the structure near 0.5845. Near that area we need to be careful because the price may move down again.
The uptrend will start if the price manages to cross 0.5845. It is all we need for the price to start the uptrend this time.
I am explaining CADCHF this way because I have recently had some requests from many members who are holding bags in the CADCHF trade.
You may find more details in the chart.
Thank you and good luck! 🍀
❤️ If this analysis helps your trading day, please support it with a like or comment ❤️
Sentient SENT price analysis🧠 How can the “Sentient” project become a unicorn?
Easy — just follow the scenario we’ve already drawn 😏
(Current market cap: ~$250M)
📊 On OKX:SENTUSDT , we’re seeing:
• solid trading volumes
• price hitting a liquidity zone
• a correction already in progress
📉 Key idea: The weaker the correction, the stronger the next impulsive move.
🔻 Correction levels are marked on the chart.
Critical zone: $0.25
Below that level, #SENT loses attractiveness for us.
🛡 Conservative approach: Wait for price to securely break and hold above the trendline, then consider entries.
For now: 👀 Observe
📐 Make your own decisions
😴 …or simply ignore it
❓Do you see #SENT as a future unicorn, or just another short-term hype?
______________
◆ Follow us ❤️ for daily crypto insights & updates!
🚀 Don’t miss out on important market moves
🧠 DYOR | This is not financial advice, just thinking out loud
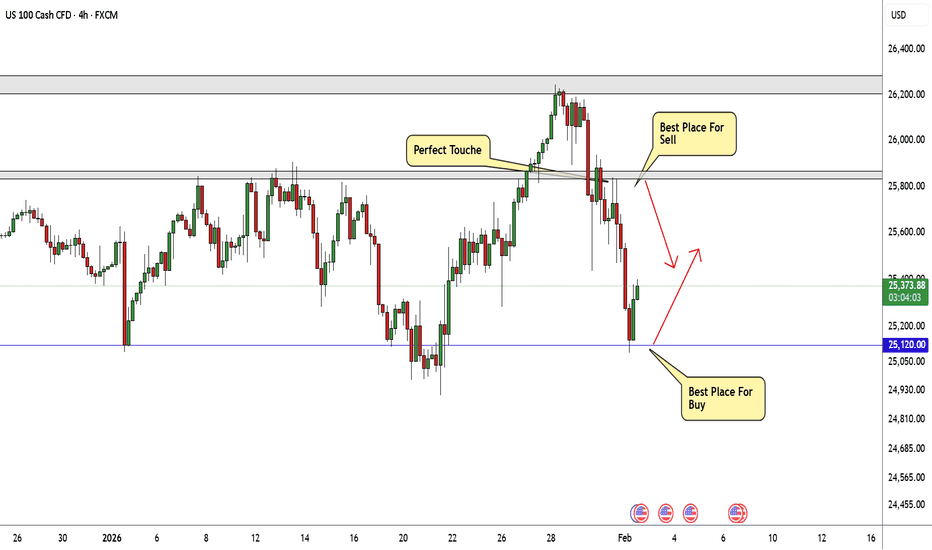
Nasdaq Best Places To Buy And Sell Cleared , 800 Pips Waiting !Here is m y opinion on NASDAQ On 4H T.F , We have a Huge movement To Downside as i mentioned in my last Analysis About Nasdaq & Then to Upside Now , and we have a good range for buy and sell started between 25120.00 to 25800.00 so we can buy and sell n\Nasdaq This Week from 2 areas , 25120.00 will be the best place for Buy and 25800.00 will be the best place for Sell , now the price very near buy area so we can Enter a buy trade when the price back to retest the area one more time and targeting 25800.00 and when the price touch it and give us a good bearish P.A , we can enter a sell trade and targeting 25120.00 , It`s All Depend On Price action , if we have a daily closure below our support then this idea will not be valid anymore .
Entry Reasons :
1- Lowest Level The Price Touch It
2- Broken Res .
3- New Support Touched .
4- Clear Price Action .
5- Clear Support & Res .
6- Price Range Cleared .


