XAUUSDHello Traders! 👋
What are your thoughts on Gold?
Gold experienced a sharp decline last week, but found support around the $4,000 zone, leading to a modest rebound.
Since then, the price has entered a range-bound phase, oscillating between key support and resistance levels.
Current Outlook:
The next directional move depends on a breakout from this consolidation range:
A break above the resistance zone could trigger a move toward the previous high.
Conversely, a break below the support zone would likely signal a deeper bearish continuation and formation of new lows.
For now, gold remains in a neutral range, and it’s best to wait for a confirmed breakout before taking new positions.
Don’t forget to like and share your thoughts in the comments! ❤️
Community ideas

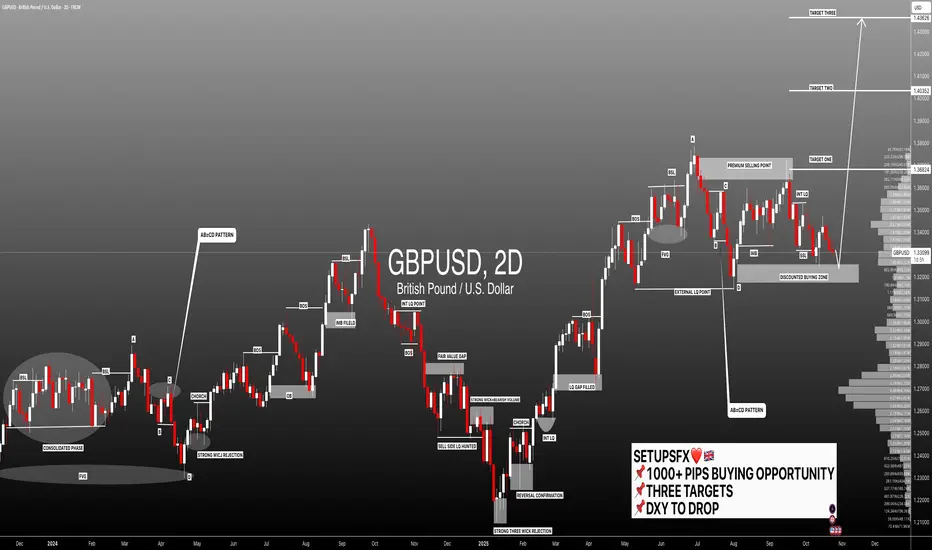
#GBPUSD:+1000 Pips Highly Probable Target! Agree with the idea? GBPUSD is currently trading at a highly probable point where we may see a strong bullish volume emerge in the market. This key level is only valid if the US dollar declines further, as a weak dollar will push our prices towards our target zones, helping us gain a higher risk-to-reward trade setup. Please like and comment on the ideas, even if you disagree. Sharing thoughts will help us all.
There are three major targets, and they accumulate to a +1000 pips trade setup. Set your take profit and stop loss based on your own analysis.
Team Setupsfx_
Gold Preparing to Continue Its Bullish Move After ConsolidationHello traders, I want share with you my opinion about Gold. Gold has maintained a strong bullish structure over the recent period, forming a clear ascending channel that has been respected multiple times. Each correction has been followed by strong bullish impulses, confirming that buyers remain in control of the long-term direction. After reaching the 4,368 Resistance Level — which coincides with the upper boundary of the channel — the market entered a range phase, signaling consolidation after an extended rally. The current price action has formed a secondary support zone near 4,050 – 4,080, also aligned with the ascending support line of the broader channel. Currently, the price is moving inside a range structure (Buyer Zone to Seller Zone), consolidating just above the main ascending support line. In my opinion, this area represents a critical accumulation zone, where buyers are likely preparing for another upward push. I expect that after testing the Buyer Zone, the price will find strong support and initiate a new bullish wave toward the Seller Zone and the Resistance Level at 4,368. A confirmed breakout above the resistance line of the local descending structure would validate this bullish continuation scenario. Please share this idea with your friends and click Boost 🚀

Lingrid | GOLD Weekly Price Analysis: Parabolic Pause or Peak?OANDA:XAUUSD experienced significant turbulence this week, initially pushing higher before encountering firm resistance and subsequently breaking down sharply toward the critical $4,000 psychological support level. This aggressive pullback, fueled by rising volume, signals a potential exhaustion of the parabolic rally seen in recent weeks. A move toward $3,900 is not a collapse, but a necessary, healthy correction — allowing momentum to reset and positioning the market for a sustainable next leg higher.
The 4H chart shows that after an explosive run into the all-time high zone near $4,380, price met fierce resistance. The subsequent drop formed a textbook corrective channel, confirming the market’s need to digest gains. What we should watch most closely? The upward trendline remains intact, acting as a dynamic support level. As long as price holds above this upward trendline and the broader upward channel, the primary uptrend remains alive. A break below $3,900 would be a red flag; a bounce from there could ignite a powerful retest of the ATH zone.
Zooming into the 1H chart, we see the formation of a classic double top pattern at the resistance area, followed by a decisive breakdown. This bearish signal was quickly countered by a strong rebound, now forming an ascending triangle. This pattern is inherently bullish — it represents consolidation before a breakout. The key trigger? A decisive close above the triangle’s upper resistance line would confirm the continuation of the bullish trend and likely propel gold toward new highs, targeting the $4,400 level.
In essence, gold is not broken — it’s breathing. The market is resetting its momentum, and the technical structure still favors the bulls. We should watch the $3,900 - $4,000 support and the ascending triangle breakout like a hawk. The next move could be explosive.
If this idea resonates with you or you have your own opinion, traders, hit the comments. I’m excited to read your thoughts!

XAUUSD: Healthy Pullback or the Start of a Downtrend?👋Hello everyone! What do you think about the current trend of OANDA:XAUUSD ?
Looking at last week’s movement, gold experienced a pullback after nine consecutive weeks of gains. By the end of Friday’s session, price action remained relatively calm, consolidating around the $4115 area while maintaining the psychological support near $4000.
From a technical perspective, it’s still too early to conclude whether this marks the beginning of a bearish trend or just a temporary correction. However, in the short term, from my view — and that of many others — this looks more like a healthy correction than a full trend reversal.
The fundamental reasons supporting gold’s strength haven’t disappeared. The U.S. government shutdown continues, meaning we’re not receiving key economic data — increasing overall uncertainty. Meanwhile, central banks like Russia and China keep accumulating gold aggressively, and ongoing geopolitical tensions surrounding the war in Ukraine continue to support gold as a safe-haven asset.
Technically, after forming a double top, gold has entered an accumulation phase, potentially setting up for a new bullish structure. If price can break above the current resistance zone, it could open the door for a strong upward continuation.
And you — what’s your view on the future of this precious metal? 💬 Share your thoughts in the comments below!

The Next Explosion, Hidden Clues in Price BehaviorCan you really feel the next Bitcoin explosion just by reading the charts?
The market looks calm, but deep down something big is shifting.
When everyone expects a crash, history shows that’s when the biggest moves begin.
Hello✌️
Spend 2 minutes ⏰ reading this educational material.
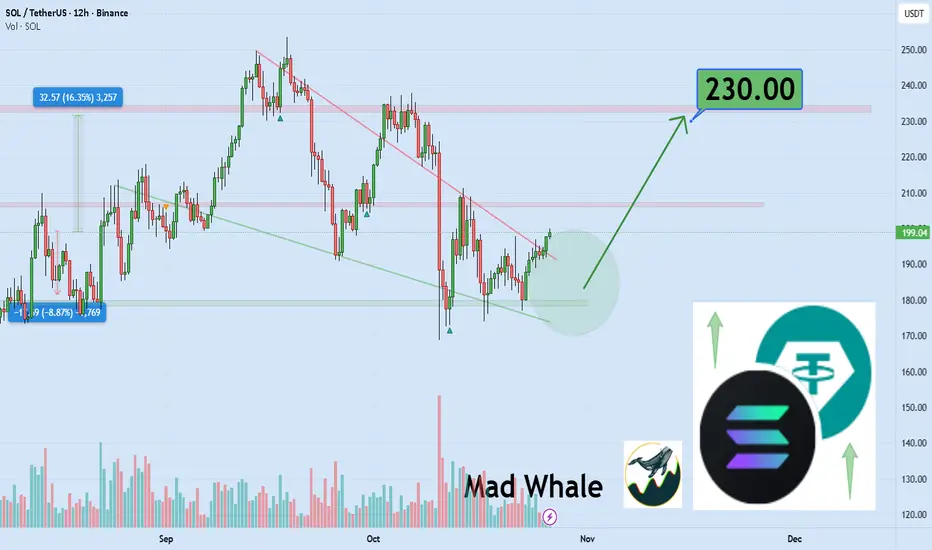
🎯 Analytical Insight on Solana:
BINANCE:SOLUSDT is testing a key daily support; holding this zone could spark a 16% rally, targeting $230. 📈🛡️
Now , let's dive into the educational section,
🌋 The Calm Before the Storm
The crypto market is like the ocean before a tsunami quiet but full of hidden energy. On higher timeframes, candles look small and boring, yet trading volume is rising. That mix of silence on the surface and pressure underneath is exactly what happens before every strong bull run.
💡 Hidden Clues in Price Behavior
Bitcoin’s price has been building quiet support for weeks, while big transactions are slowly increasing in the background. This usually means that smart investors are buying without drawing attention. Rising volume with little price movement is often the first signal that accumulation has started.
🚀 Bitcoin The Engine of the Next Explosion
In every cycle, Bitcoin moves first. Breaking major resistance levels and holding above them is a sign of growing confidence. When Bitcoin dominance starts to drop and altcoin volume goes up at the same time, that’s when the whole crypto market gets ready for a collective takeoff.
🧠 Trader Psychology During Market Silence
Most traders fear a quiet market, but experienced ones see it as the best setup. When the media talks about stagnation and panic, the big players are quietly building long positions. The difference between average and professional traders is simple: one sees silence as danger, the other as opportunity.
🔍 The Path to Spotting the Next Big Move
To catch the move early, start with volume. When volume rises at support levels without breaking previous lows, it usually means smart money is buying. A positive divergence between price and RSI often appears right before momentum flips. Then watch for a bullish MACD cross on the daily chart when all three signals align, the explosion is close.
⚙️ TradingView Tools That Reveal Market Explosions
TradingView offers powerful tools that can help you detect big moves before they happen.
1. Volume Profile
Shows where most buying and selling happened. Heavy zones are usually where whales make their decisions.
2. MACD
Reveals when market momentum is changing direction. A bullish cross in the negative zone often signals the start of a reversal.
3. RSI
Measures the strength of buyers versus sellers. When RSI breaks above 50, a new bullish phase is often beginning.
4. Alert System
Highly underrated! Set alerts for your favorite indicators so when they align, you get notified instantly.
5. Multi-Timeframe Analysis
Use multiple timeframes to avoid fake signals. Comparing daily and 4-hour charts gives a much clearer picture of big moves.
⚡ Summary
All signs point to a massive move ahead. Bitcoin’s calmness is deceiving, but the data doesn’t lie. Stay patient, follow your signals, and you might witness one of the strongest uptrends in years.
🧭Golden Tips for Smart Traders
Patience beats excitement. The biggest profits go to those who wait for confirmation, not those who rush in
Ignore the crowd’s emotions. When the mood is darkest, opportunities are often the brightest.
Trust the chart, not your fear. The market always tells the truth if you take the time to listen.
✨ Need a little love!
We pour love into every post your support keeps us inspired! 💛 Don’t be shy, we’d love to hear from you on comments. Big thanks, Mad Whale 🐋
📜Please make sure to do your own research before investing, and review the disclaimer provided at the end of each post.
WTI Crude Oil Forms Major Head and Shoulders BreakdownHi guys.
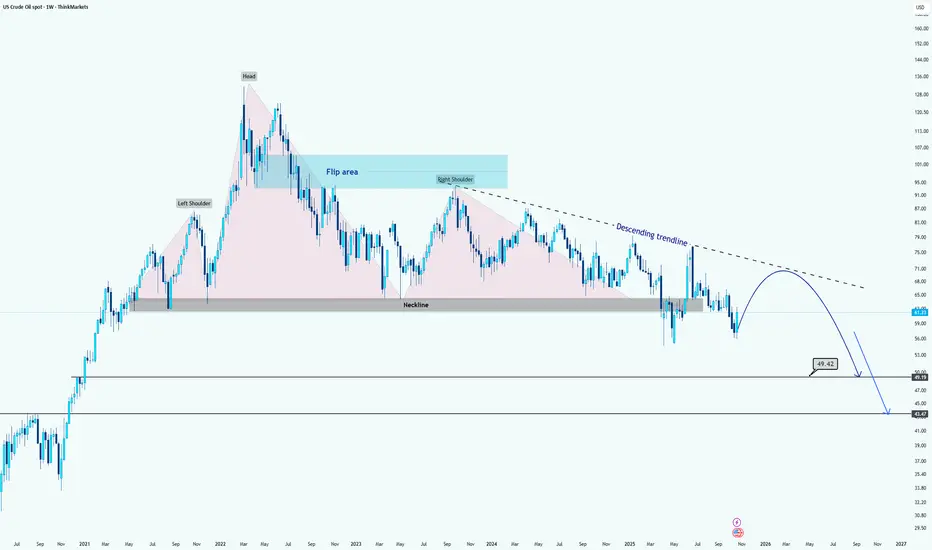
WTI has formed a massive Head and Shoulders pattern on the weekly timeframe, signaling a potential long-term bearish reversal structure.
After the right shoulder completed, price decisively broke below the neckline around the $67–$70 range, confirming the pattern breakdown. This neckline now acts as a major resistance zone and aligns closely with the descending trendline, adding confluence to the bearish bias.
The recent rebound appears to be a corrective pullback toward the neckline or flip area, before potentially continuing to the downside. As long as WTI remains below the descending trendline and neckline zone, bearish momentum is expected to dominate.
The projected measured move target from the pattern suggests two possible support objectives:
First target: around $49.40, corresponding to prior consolidation and structural support.
Final target: near $43.40, aligning with historical demand and the full measured move projection from the Head and Shoulders formation.
Overall, unless WTI reclaims and sustains above the $70 area, the medium- to long-term bias remains bearish, with corrective rallies likely to face selling pressure.
Disclaimer: As part of ThinkMarkets’ Influencer Program, I am sponsored to share and publish their charts in my analysis.
EURUSD Short: Retest of Resistance Before Next Leg DownHello traders! The overall market structure for EURUSD continues to favor the bears, following a sharp rejection from the 1.1720 supply zone. This area marked a strong pivot point where the price failed to sustain any further bullish momentum and began forming a clear descending channel, establishing a consistent pattern of lower highs and lower lows.
Currently, the pair is trading within this descending channel, maintaining strong downside momentum. After a short-term recovery attempt, the price reached the upper boundary of the channel and reacted with a noticeable rejection from the resistance line, reinforcing bearish pressure.
My scenario for the next move suggests that this corrective rally is now complete. I expect the price to resume its downward trajectory from this resistance area and move toward the 1.1560–1.1540 demand zone, where the next key reaction level lies.If sellers remain dominant and manage to break through this demand area, the next wave could extend toward new lows, continuing the broader bearish trend. Therefore, my target (TP) is set at 1.1560, anticipating the continuation of the main downward impulse. Manage your risk.

BTCUSDT: Bounce from Support Could Ignite Rally Toward $114KHello everyone, here is my breakdown of the current Bitcoin setup.
Market Analysis
Bitcoin (BTCUSDT) has recently transitioned from a bearish phase to a bullish structure after breaking out of a prolonged downward channel. The market had been forming a sequence of lower highs and lower lows until it found strong demand in the support zone around 110,000. From there, price began consolidating, indicating that sellers were losing control.A decisive breakout from the channel marked the end of bearish pressure, and since then, BTC has been moving inside a new upward channel, forming higher highs and higher lows — a clear sign of bullish momentum returning.
Currently, the price is approaching the resistance zone near 113,600–114,000, which previously acted as a key supply area. The ongoing structure suggests that buyers are attempting to push through this level and confirm a breakout continuation.
My Scenario & Strategy
In my view, BTC may attempt to retest the local support area near 111,000 before resuming its move higher. A successful bounce from this level would confirm that the new upward channel remains intact and provide a favorable long opportunity targeting the 114,000–115,000 zone.
If price breaks and holds above this resistance zone, it will likely open the door for a stronger bullish continuation toward 118,000 and beyond.
However, if BTC fails to maintain the channel support, a temporary correction back to the 110,000 area could occur before the next upward impulse.
That's the setup I'm tracking. Thank you for your attention, and always manage your risk.

AUD/USD Breakout Bullish continuation AUD/USD price had been consolidating for a while, buyers were slowly building pressure, forming higher lows.
Each new push from buyers showed more strength, and each rejection from sellers grew weaker, momentum was clearly shifting.
Finally, buyers broke with conviction, showing strong bullish intent.
That breakout confirms buyer dominance and signals the potential start of a new impulsive move higher.

GOLD 1H CHART ROUTE MAP UPDATE & TRADING PLAN FOR THE WEEKHey Everyone,
Please see our updated 1h chart levels and targets for the coming week.
We are seeing price play between two weighted levels with a gap above at 4134 and a gap below at 4090. We will need to see ema5 cross and lock on either weighted level to determine the next range.
We will see levels tested side by side until one of the weighted levels break and lock to confirm direction for the next range.
We will keep the above in mind when taking buys from dips. Our updated levels and weighted levels will allow us to track the movement down and then catch bounces up.
We will continue to buy dips using our support levels taking 20 to 40 pips. As stated before each of our level structures give 20 to 40 pip bounces, which is enough for a nice entry and exit. If you back test the levels we shared every week for the past 24 months, you can see how effectively they were used to trade with or against short/mid term swings and trends.
The swing range give bigger bounces then our weighted levels that's the difference between weighted levels and swing ranges.
BULLISH TARGET
4134
EMA5 CROSS AND LOCK ABOVE 4134 WILL OPEN THE FOLLOWING BULLISH TARGETS
4174
EMA5 CROSS AND LOCK ABOVE 4174 WILL OPEN THE FOLLOWING BULLISH TARGET
4236
EMA5 CROSS AND LOCK ABOVE 4236 WILL OPEN THE FOLLOWING BULLISH TARGET
4288
EMA5 CROSS AND LOCK ABOVE 4288 WILL OPEN THE FOLLOWING BULLISH TARGET
4331
EMA5 CROSS AND LOCK ABOVE 4331 WILL OPEN THE FOLLOWING BULLISH TARGET
4360
BEARISH TARGETS
4090
EMA5 CROSS AND LOCK BELOW 4090 WILL OPEN THE FOLLOWING BEARISH TARGET
4042
EMA5 CROSS AND LOCK BELOW 4042 WILL OPEN THE SWING RANGE
4122
4075
EMA5 CROSS AND LOCK BELOW 4075 WILL OPEN THE SECONDAARY SWING RANGE
3987
3939
As always, we will keep you all updated with regular updates throughout the week and how we manage the active ideas and setups. Thank you all for your likes, comments and follows, we really appreciate it!
Mr Gold
GoldViewFX

EURUSD Breakdown Looms: Sellers Target 1.1560 Support ZoneHello traders, I want to share my opinion about the current EURUSD setup. After an extended bearish movement, EURUSD continues to trade within a descending channel, clearly defined by a Resistance Line connecting recent lower highs and a Support Line connecting the local lows. This structure outlines the ongoing corrective trend that has been developing over the past weeks. Recently, the price made a moderate bullish correction after rebounding from the Buyer Zone (1.15600–1.15800) — a key demand area where strong buying activity had previously emerged. However, this rebound brought EURUSD back into the Seller Zone, aligning with the upper boundary of the descending channel and the Resistance Level near 1.16600. At this stage, the market is showing early signs of bearish pressure from this confluence area. If sellers continue to hold the upper boundary, a rejection from the Resistance Line would confirm the continuation of the descending trend structure. I expect the price to rotate back down toward the Buyer Zone near 1.15600, which remains the main local support area. A confirmed breakdown below this level could trigger further momentum toward lower support targets, while a strong rebound could indicate the start of a potential accumulation phase. As of now, my scenario favors a short-term bearish continuation from resistance toward the 1.15600 target zone (TP1). Please share this idea with your friends and click Boost 🚀

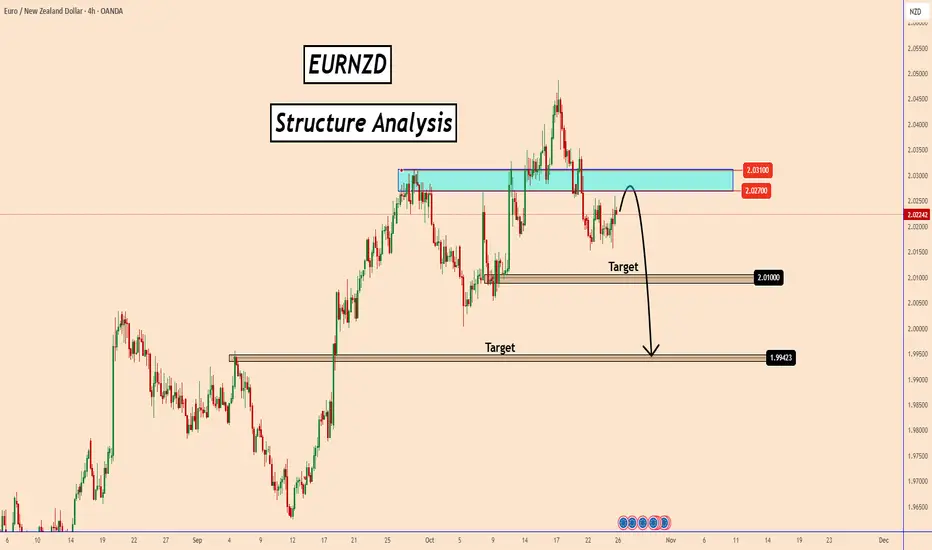
EURNZD Structure Signals Potential Downside MoveEURNZD Structure Signals Potential Downside Move
EURNZD is currently testing a key resistance zone between 2.0270 and 2.0310, an area that has acted as a strong supply zone in the past. The pair has shown multiple rejections around this level, suggesting that buyers are losing momentum and sellers may soon regain control.
The price structure indicates a potential bearish reversal if the pair fails to break and close above the resistance area. The first target for the downside move lies near 2.0100, followed by the second and more significant target around 1.9940, where strong demand previously pushed the price higher.
If bearish momentum strengthens from the current structure, EURNZD could continue to drop toward those levels in the coming days.
You may find more details in the chart!
Thank you and Good Luck!
❤️PS: Please support with a like or comment if you find this analysis useful for your trading day❤️
BTCUSDT – When the Bullish Wave ReturnsBitcoin is showing a notable recovery phase after a series of previous corrections. On the daily timeframe, price continues to move within an ascending channel that has been forming since the beginning of Q3.
Currently, BTC is approaching the midline of the channel around 115,000–116,000 USD , with key support at 106,700 USD and upper resistance near 127,700 USD.
If the price retests the 112,000–113,000 USD zone and holds, this could become a perfect “launchpad” for the next bullish move.
From a fundamental perspective, expectations of a Fed rate cut and South Korea’s more open stance toward crypto are providing positive momentum for risk assets like Bitcoin. However, signals from the options market and investor sentiment still show some caution, meaning the upward move may be gradual and range-bound rather than explosive.
Overall, BTC remains under bullish control , and as long as the price holds above the 106,000–107,000 USD zone, the gradual climb toward 127,000 USD remains the most likely scenario.

Gold Rebound SetupGold (XAU/USD) is testing the support trend line around 4030. If it holds, price may rebound toward resistance levels at 4160 and 4236, with a potential target near 4370. A break below the trend line could indicate further downside pressure.

Bitcoin broke the falling trendline and now Pump ahead As observed on the chart, the price is currently testing a major daily support zone. Furthermore, the area below $108K is considered one of the most favorable accumulation zones for institutional investors ("whales"). Concurrently, as evident on lower timeframes, the price has executed a decisive breakout above the prevailing falling trendline. This technical development suggests the asset is primed for a potential upward move, initially targeting the $120K resistance zone, with a confirmed base forming between the $109K-$110K support region.
DISCLAIMER: ((trade based on your own decision))
<<press like👍 if you enjoy💚

EURUSD – When the Green Light Begins to ShineHello traders,
On the 4-hour chart, EURUSD is showing signs of shifting from a consolidation phase to a clearer mild uptrend . The price has found a solid base near the 1.1595–1.1600 area, rebounding from the ascending trendline and now aiming for resistance around 1.1710 — a level where a stronger breakout could occur if buying momentum strengthens.
Not just technically, but also fundamentally, recent Eurozone economic data such as PMI and consumer confidence beating expectations , combined with a softer USD as markets await the Federal Open Market Committee (FOMC) decision, are creating a favorable backdrop for the euro to attract capital inflows.
Thus, the most likely short-term scenario is that EURUSD might dip slightly toward ~1.1600 for momentum , then bounce up toward ~1.1710. If this move is confirmed by a clean breakout above resistance, it could mark the start of a more sustainable bullish trend.
In short, traders should wait for technical confirmation from support and a breakout above resistance before stepping in. It may not be a dramatic surge, but it’s a steady and promising bullish opportunity — the “golden bull” of EURUSD looks ready to move.

What Do Global Experts Say About the XAUUSD Trend?👋Hello everyone , great to see you again! Let’s take a closer look at OANDA:XAUUSD today.
At the start of this new trading week, gold is showing a mild pullback, trading around $4,070 — down more than $44 at the time of writing.
In the short term, many Wall Street analysts are leaning toward a sideways or bearish outlook for gold. Among them, Jim Wyckoff, a veteran analyst at Kitco, predicts that gold will remain volatile with a downside bias this week:
“Large swings are pushing both buyers and sellers out of the market in the same session. When speculators retreat due to risk aversion, the trend often tilts lower.”
However, he also emphasizes that medium- to long-term support for gold remains intact. The U.S. government shutdown has now extended into its fourth week, and the lack of key economic data is adding to uncertainty — a backdrop where gold continues to serve as a safe-haven asset.
From my personal perspective, gold currently appears to be moving sideways and entering a phase of accumulation. The metal market looks somewhat exhausted after multiple strong rallies, and many traders seem to be waiting for a deeper correction before re-entering. The key support zone to watch lies around $4,030–$4,000 . If this level breaks, I would avoid buying immediately and wait for a more stable setup to emerge.
What about you — how do you see the gold trend unfolding next?
💬Share your thoughts in the comments below, and good luck with your trades!

THE KOG REPORTTHE KOG REPORT:
In last week’s KOG Report we said we would be looking at two levels as potential for the long trades and target for the short trades. We ideally wanted price to push upside and complete the long target before turning and then completing the short target. During the early part of the week, we activated short and gave caution on longs only to see the aggressive decline which hit our short target and completed our bias level and red box targets for the week.
All in all, a decent week in Camelot with Excalibur guiding and the EA hitting another full house of completed targets on Gold.
So, what can we expect in the week ahead?
We're pondering on this bearish move and it’s giving us hints of a swing low so for that reason we’ve given the red box bias level at 4095 which will need to break for us to see a continuation of the move. Above there, we have immediate support at 4104 which if held can give us another bounce in the early sessions giving us a move upside into the 4140-50 regions initially.
Above that level there is a level sticking out sitting at 4173 with the extension level 4192 which if targeted is the level to keep an eye on for us. A break above there and it’s likely we will attempt to swing high from a lot higher up which we will need to navigate level to level. But a RIP there would be ideal if it happens with a clean reversal.
On the flip, we do want to see lower pricing on gold as we feel it’s not only needed, but it will give buyers better opportunities to get in for better positioning to carry trades upside into the higher target levels we have active. As we approach the end of the month, it's going to be another whipsaw and we would hope to complete the move, or, we'll most likely see some sideways accumulation leading into the next week.
KOG’s bias for the week:
Bullish above 4095 with the ideal target 4274
Bearish below 4095 with the ideal target 4025
RED BOX TARGETS:
Break above 4115 for 4123, 4125 and 4140 in extension of the move
Break below 4095 for 4080, 4065 and 4050 in extension of the move
Please do support us by hitting the like button, leaving a comment, and giving us a follow. We’ve been doing this for a long time now providing traders with in-depth free analysis on Gold, so your likes and comments are very much appreciated.
As always, trade safe.
KOG

EURUSD – Trapped in a Falling Channel👋 Hello everyone , great to see you again in today’s market discussion!
At the moment, FX:EURUSD is trading around 1.1620, continuing to follow its short-term bearish trend within a well-defined descending channel. After a brief rebound to retest the upper resistance zone near 1.1700, the pair failed to break through and is now showing renewed signs of weakness. Both the EMA 34 and EMA 89 are still sloping downward, confirming that bearish momentum remains dominant.
From a fundamental perspective, the euro continues to face pressure from weak economic data and a slower pace of monetary tightening compared to the Federal Reserve. Meanwhile, the U.S. dollar remains supported by high Treasury yields, attracting capital flows into the greenback.
The preferred scenario suggests that price could move back down to retest the 1.1550 support zone, a level where the market previously showed strong reactions. Let’s watch how the pair behaves around this area to look for potential opportunities.
What about you — do you think EURUSD will recover soon, or will it keep falling further? 💬Share your thoughts in the comments below!

XAU/USD : Gold Breaks $4,000 Support – Can Bulls Hold the Line?By analyzing the Gold (XAUUSD) chart on the 2-hour timeframe, we can see that after rising to $4,138 and entering the marked supply zone, gold faced strong selling pressure and continued to drop, finally breaking below the $4,000 support and reaching $3,971.
As shown on the chart, this area is a key demand zone, and we expected a reaction here.
If gold manages to hold above the current level, we could see a short-term bounce toward $4,015. This analysis will be updated soon!
Please support me with your likes and comments to motivate me to share more analysis with you and share your opinion about the possible trend of this chart with me !
Best Regards , Arman Shaban

Lingrid | SUIUSDT Bearish Trend Shorting OpportunityBINANCE:SUIUSDT is rebounding from the channel’s lower boundary after forming a solid bottom near the support level. The structure still respects a broad descending channel while holding above a minor range base. A break above 2.71 would confirm short-term continuation toward mid-range resistance as buyers regain momentum. Price action suggests a corrective rebound phase within the prevailing bearish macro channel.
⚠️ Risks:
Failure to hold the current support zone may renew downside pressure.
Strong USD data or hawkish Fed comments could cap recovery momentum.
Channel resistance near 2.7 remains a potential rejection point before breakout confirmation.
If this idea resonates with you or you have your own opinion, traders, hit the comments. I’m excited to read your thoughts!

#CADJPY +2300 Pips Swing Buy With Three Major Targets| Possible?The CADJPY has nicely formed a swing bullish pattern that is confirmed. One strong entry zone lies between these prices, 109 and 106, which remain a critical level. As described in the chart, there are three targets to focus on. We strongly recommend thoroughly examining the charts and reading them carefully, as this description is brief due to the detailed chart.
Here’s what to look for:
- Look for a continued or repeated pattern to better understand the next possible move.
- Look for volume when it emerges; enter with the trend momentum.
- Don’t forget to like and comment on the chart!
Team Setupsfx_
