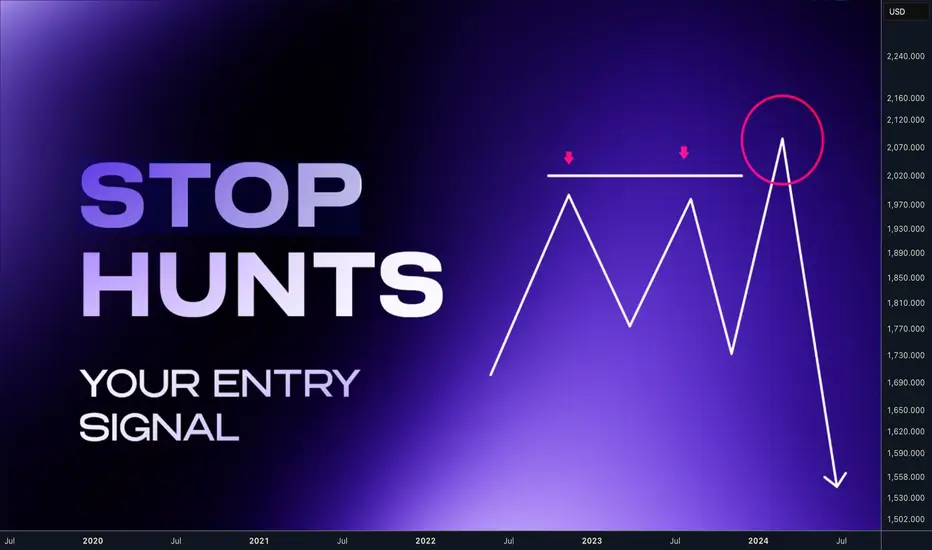
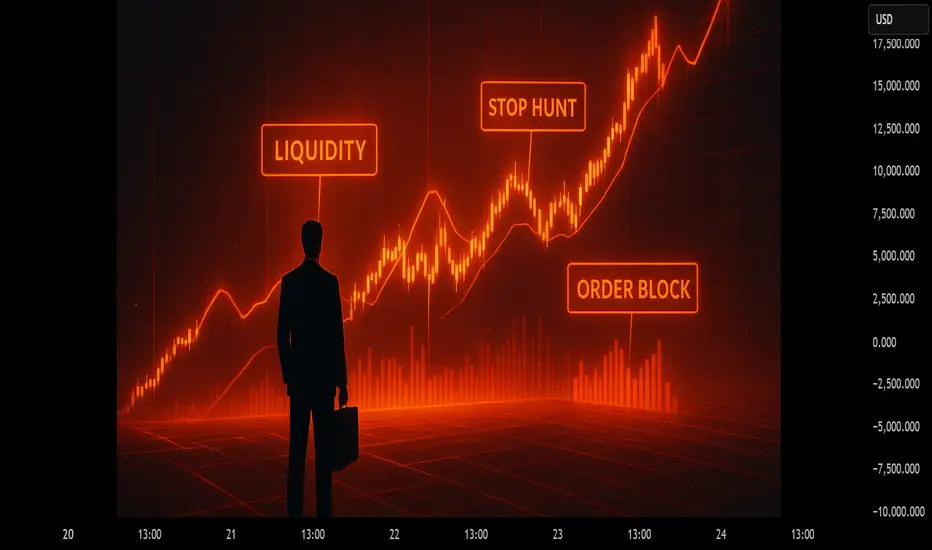
The Art of the Stop Hunt Trading. Hey traders In this post, you’ll learn how to the liquidity is engendered and how to avoid being stop hunted and actually use stop hunts to your advantage
📌If you placing your stop loss below the level before it was visited to grab the liquidity, you will become the liquidity. In the fact market makers doesn't care about your or mine stop loss, its too small money. But they come there because they have to in order to move the market. 📌 Every trader has seen it happen: you take a position at the “obvious” level, only to get stopped out by a quick wick — and then the market runs exactly where you expected. That wasn’t bad luck. That was stop hunt in other words liquidity grab ‼️ Don't be a liquidity
Price doesn’t move randomly inside ranges. It hunts liquidity at the edges.
• Retail trap: Traders pile orders right at the Double top / bottoms and ranges
• Smart money: Hunt's double top / bottoms and ranges starting the move.
📌 Double Top / Double bottom
sometimes price leave this formation, sometime even triple top / Bottom. It's on purpose and its telling us price will go there again, Im using these as the targets. Traders still think that if price rejected somewhere for few times that its strong level and its safe to put stop loss above or below and thats the problem. As many traders thinks this way its create a huge stop loss cluster = Liquidity zone which is attractive for the market makers.
‼️ If you see a double top / bottom then never enter before price dip in to it. Not even when there is clear trend line break its trap. Wait , you will get much sharper and better risk reward trade. If a pivot level gets tapped multiple times, it's on purpose. Smart money are creating illusion of strong support / Resistance so they cant manipulate price above / bellow where they grab the liquidity and reverse the market.
🧪 Example 1 - Triple top stop hunt, if you enter before you would serve as liqudity 🧪 Example 2 - Triple top stop hunt, even if you are right with the direction, not eating for the stop hunt first will ruin your trade 🧪 Example 3 - Double top stop hunt - he was nice trend line break which attracted more sellers and as you can see they been right with the direction but setting your stop loss just right above double top is not working 🧪 Example 4 - market makers used triple top used to offload positions above this liquidity level. 💊 Les informed traders trades patterns like : Double bottom, Double top and they put the stop losses above the range - This creates a Liquidity cluster which smart money needs to execute their orders. They will come for it before the real move happen. 🧩 How to use this information for your advantage
train your eyes and focus on the double tops / bottoms thats where the liquidity mostly will be resting. Always wait for the stop hunt after that is your time enter the market. Im looking for the trades always after the stop hunt in other words range manipulation. Let's check few ideas bellow.
🧪 EURUSD - after double top liquidity manipulated Im targeting opposing double bottom liquidity. 🔗 Click the picture to see price action development 👇https://www.tradingview.com/chart/EURUSD/OI08qVGB-EURUSD-I-Weekly-Range-I-Manipulation-Time-for-pullback/ 🧪 DOLLAR - Weekly Range Low liquidity was taken - now targeting double top liquidity as easy target. 🔗 Click the picture to see price action development 👇 🧪 USDCHF - Double bottom liquidity taken, targeting opposing side 🔗 Click the picture to see price action development 👇https://www.tradingview.com/chart/USDCHF/2AbnD2TR-USDCHF-I-Daily-CLS-range-I-Key-Level-FVG-I-HTF-CLS/ 🧪 DOGE - Liquidity take and targeting opposing range. 🔗 Click the picture to see price action development This is happening over and over again across all assets
👉Once you see it you cant unsee it. Focus on the stop hunts and you will see the market structure differently. Not like higher highs, higher lows and vice versa but rather something like this.
📌 Uptrend
Price is in a bullish move and is consistently breaking abovehighs and rejecting below lows. (Sweeping liquidity) - heading to HTF liqudity 📌 Downtrend
Price is in a bearish move and is consistently breaking below lows and rejecting above highs.(Sweeping liquidity) - heading to HTF range liquidity whole new world will open for you. You will be entering only after stop hunts.
⭐ I have whole strategy build on that click the picture below for more inspiration and the most powerful thing is that price is fractal what you just learned in the post above is possible to scale down. So for example you analyze Monthly range manipulation and you have opposing target. Its target for the next few weeks until the price reaches the monthly target and if you scale down to Daily then you trade Daily ranges in the Monthly range sequence.
📌 Bullish LTF Range within HTF Range
Analyze HTF range and define models, then drop it to your TF and trade your ranges with the HTF range. Always follow the same process only on the LTF - Lower timeframe. 📌BearishLTF Range within HTF Range
Analyze HTF range and define models, then drop it to your TF and trade your ranges with the HTF range. Always follow the same process only on the LTF - Lower timeframe. Shift from being the exit liquidity to being the trader who patiently waits, confirms, and executes with precision.
🩸 Spot the Liquidity. 🩸 Wait for stop hunt. 🩸 Trade with intention.
Don't trust me and check this on your chart find the true.
David Perk aka Dave FX Hunter
Community ideas
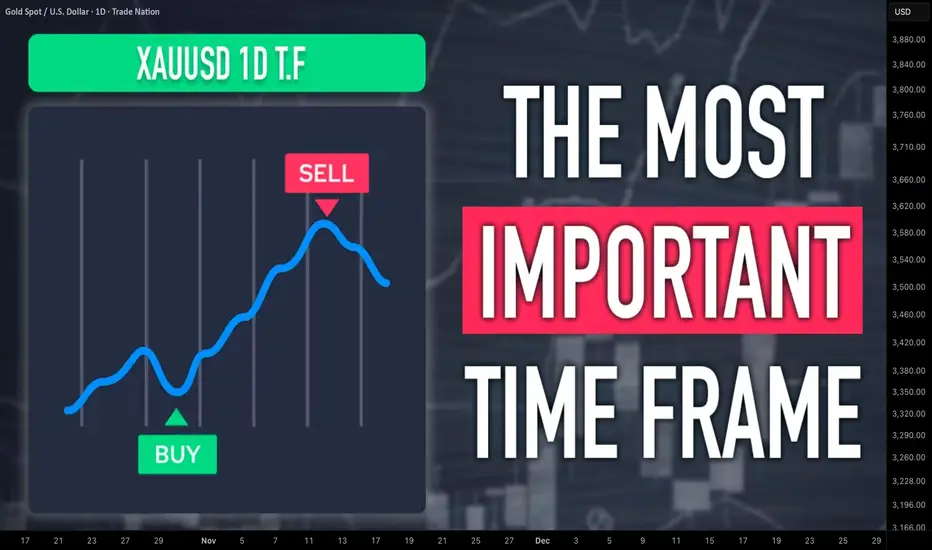
How to Analyze Daily Time Frame on Gold. 5 Important Things
There are 5 important things that you should analyze on Gold on a daily time frame to accurately predict long term, midterm and short term movements.
In this article, I will share with you a step-by-step guide for daily time frame analysis that you can apply on Gold or any other financial instrument.
1 - Identify the market trend
When you analyze a daily time frame, you should identify long term, midterm and short term market trends.
Long-term trend is based on the analysis of one year long price action.
In the example above, Gold is trading in a long term bullish trend because the price keeps setting new higher high and new higher lows during the year.
Midterm trend is based on the analysis of a price action for the last 4–5 months.
Above, we can clearly see that a mid-term trend is bullish because again, the price sets new higher highs and higher lows over time.
Short-term trend is based on the analysis of price movements for the last 2 months.
Short-term price action is also bullish on Gold, with a clear sequence of higher highs and higher lows.
According to the trend analysis, long-term, mid-term and short-term trends are bullish.
2 - Identify the directional bias
The directional bias defines a highly probable future direction on the market.
In our example, we can anticipate that Gold will keep growing among all the dimensions: long-term, mid-term and short-term.
3 - Execute structure analysis
Identify important historic horizontal and vertical structures.
That will be the points from where you should look for trading opportunities.
When you analyze key levels, identify the structures that are lying close to the current price levels.
Make sure that all the structures that you spotted were respected by the market in the past.
4 - Look for price action patterns
Price action patterns are the language of the market.
Proper identification of the patters will help you correctly understand the intentions of the market participants.
You can see that a bearish breakout of a rising channel triggered a correctional movement on the market.
Gold started to fall steadily within a bullish flag pattern and after it tested a key support, the price violated the resistance of the flag.
5 - Analyze candlesticks
Candlestick patterns can provide extra clues and confirmations.
You can see that the market formed multiple rejections from key support, an inside bar formation and bullish engulfing candle.
Violation of the inside bar to the upside with a strong bullish candle is an important bullish signal.
Combining trend analysis, structure analysis, price action and candlestick analysis, and you can make predictions and look for trading opportunities.
You can also make your analysis even more sophisticated, for example, analyzing fundamental analysis or applying technical indicators.
❤️Please, support my work with like, thank you!❤️
I am part of Trade Nation's Influencer program and receive a monthly fee for using their TradingView charts in my analysis.
What to Do When the Market Is in an Uptrend?Hello everyone,
When the market is rising , most traders get excited. Every price push feels like a wave of enthusiasm – everyone believes they are on the winning side. But in reality, even in the most favorable conditions, not everyone makes a profit . The simple reason: a rising market does not automatically mean a win; it’s about knowing when to buy and when to wait . I’ve seen many traders jump into positions just because the price is going up, only to be surprised when the market pulls back . An uptrend is not a straight line up, but a series of higher highs – pullbacks – higher highs , and the winners are those who know how to choose the right timing.
Confirm the Trend – Don’t Confuse Uptrend with a Technical Rebound:
Before placing a trade , the first step is to confirm whether the market is truly in an uptrend . A proper uptrend should have higher highs and higher lows , with the price staying above moving averages like EMA 20, EMA 50, or above the Ichimoku Kumo cloud . If the price just bounced from a low after a sharp decline, it may only be a technical rebound , and confusing the two can make you buy at the top . For example, when gold keeps forming new highs at 1,920 – 1,940 USD/ounce, while the lows remain higher than the previous ones, the money flow clearly supports the uptrend .
Buy on Pullbacks – “Buy the Dip” Is a Smart Entry:
Once the uptrend is confirmed, the next step is to choose the right entry point . Don’t rush to follow the price when the market is flying , as every uptrend has pause phases . Each minor correction or pullback is a chance to buy the dip . Watch important support zones , such as Fibonacci 0.5 or 0.618 or unfilled FVG areas . When the price touches these levels and shows a reversal signal , it is usually the highest probability entry point .
Note: even in an uptrend , the market may experience shakes due to profit-taking or short-term adjustments . This is normal and should not cause panic. In fact, the pullback is an opportunity to buy at a better price . Wait for a confirmation signal from candlestick reversals or indicators like RSI not oversold . For example, if gold rises from 1,900 to 1,940 and then pulls back slightly to 1,915 – 1,920, this can be a good entry , instead of chasing at the peak .
Risk Management – Stop Loss and Take Profit:
Even when the market is rising , risk management is crucial. Place Stop Loss below higher lows or the nearest support zone to protect against sharp pullbacks. Take Profit can be set at the next resistance zone , or use trailing stop to lock in profits as the price continues upward. For example, buying gold at 1,915 USD/ounce , you could place SL below 1,905 and TP near the resistance at 1,950 USD.
Monitor Macro News – Don’t Let Big Waves Sweep Away Profits:
A strong trend always has a reason behind it: monetary policies , inflation data , or global capital flows . Staying informed helps you avoid being caught off guard.
I’ve covered this part, you can click here to read more.
Patience and Discipline – Two Weapons to Survive an Uptrend:
One of the biggest challenges for traders is… standing still . When the market keeps rising , FOMO (fear of missing out) can make you jump in immediately, but most hasty trades end up buying right before a pullback . I’ve made this mistake many times – buying when the price is flying , then watching the position turn red in a few hours. Later, I realized that in an uptrend , patience to wait for a pullback is the key to winning. Wait for the price to return to a support zone , wait for a confirmation signal , then enter.
Discipline is not only about entry timing but also risk management . Place Stop Loss below the nearest low , Take Profit at the next resistance zone , and if the price continues upward , move SL favorably – trailing stop protects profits without exiting too early. Emotions are the biggest enemy of a trader ; greed or rushing leads to wrong decisions. Following your plan and discipline avoids unnecessary losses.
An uptrend is a perfect time to increase profits , but it can also make traders complacent . If you can identify the trend , wait for the right entry , and maintain discipline , you will not only ride the wave but also survive it. Is the market rising? The question is not whether to buy or not , but whether you have enough patience to wait for the right moment .

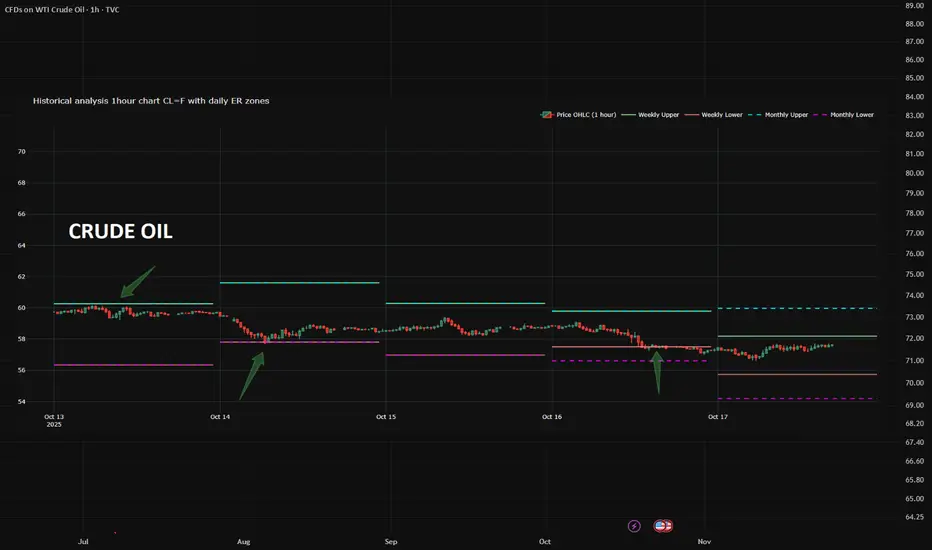
ER: The Hidden Tool 95% of Traders Ignore (But Shouldn’t)What if I told you there’s a free, stats-backed tool that shows you where price is likely to stop or reverse — with 68% confidence?
Meet Expected Range (ER) — not a magic bullet, but a massive edge when used right.
✅ Based on CME data & Nobel-winning math
✅ Defines high-probability support/resistance zones
✅ Free from CME website.
I never trade without checking ER anymore.
It turns noise into structure.
👉 Check the screenshots yourself — see how price reacted at each edge last week.
The only thing you need to do?
→ Grab ER data from the CME website daily
→ Apply a simple conversion formula
→ Plot it on your futures chart
That’s it.
Now you’ve got statistically grounded levels right in front of you.
Depending on your market view, you can:
• Short from the upper ER boundary
• Use it as a trend support entry zone
• Hide stops beyond the range — because price statistically won’t reach them
⚠️ Caveat: ER isn’t a crystal ball.
But in normal markets - ER zones hold ~4 out of 5 times.
Question for you:
Are you using ER? Or still guessing support/resistance?
Transparency first. No hype. Just real results.
The Next Crypto Winter or Just a Cold PauseThe past few months in the crypto market feel strangely quiet.
Volatility has slowed down, emotions are swinging between fear and confusion, and trading volume has dropped noticeably.
But is this just a calm pause before the next bull runor the early whisper of another crypto winter?
Hello✌️
Spend 2 minutes ⏰ reading this educational material.
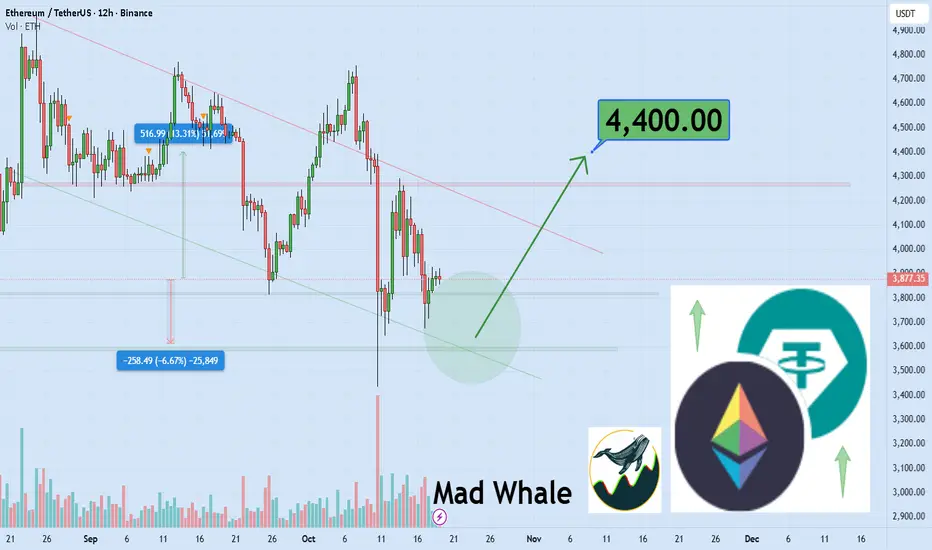
🎯 Analytical Insight on Ethereum:
Ethereum is testing the lower boundary of its bullish channel and key daily support 📉.
If this level holds, a potential 13% upside could target $4,400$🚀.
Now , let's dive into the educational section,
❄️ What Does “Crypto Winter” Really Mean?
A Crypto Winter is not just a price drop. It’s a long period when market excitement fades, liquidity dries up, and investors lose confidence.
During this phase, traders turn cautious, smaller projects disappear, and overall volume falls sharply.
We’ve seen this before most notably in 2018 and 2022 when Bitcoin crashed from all-time highs and stayed frozen for months.
📉 Current Signals: Are the Cold Nights Coming Back?
Recent data shows patterns that can’t be ignored.
Massive leveraged positions have been liquidated, exchange volumes are shrinking, and activity in DeFi projects is fading.
Many traders complain about the lack of momentum. In short, the engine of the market seems to be cooling down.
🧠 Market Psychology: When Fear Overpowers Greed
The Fear & Greed Index is once again leaning toward “Extreme Fear.”
This is when inexperienced traders panic and pull out their funds—while the smart money starts to accumulate quietly.
In these phases, separating logic from emotion becomes the trader’s greatest skill.
Fear blinds, but data reveals opportunity.
🧭 Educational Section: Using TradingView Tools to Spot Market Winters
If you want to visualize this on your charts, TradingView offers everything you need.
Start with the Volume Profile Visible Range indicator—it helps identify zones where the most trading activity occurred, showing where “smart money” might be hiding.
Next, try the Fear & Greed Index Indicator by searching it in the Indicators tab.
Then add the Moving Average Ribbon; when multiple averages compress or align downward on higher timeframes like Daily or Weekly, it’s often a sign of market exhaustion.
Finally, keep an eye on RSI (Relative Strength Index). If RSI stays below 40 for an extended period, buyers are losing control.
Combining these tools gives a realistic view of whether the market is cooling down.
Traders who master these indicators can stay objective and confident while others are led by noise—exactly the kind of analysis TradingView editors love to highlight.
🔍 Do the Data Confirm a Real Winter?
According to sources like Fool, CoinTracker, and BankRate, the signs are cautious but not final.
Bitcoin remains above key support levels in some timeframes, and on-chain data doesn’t show a complete capitulation of long-term holders.
So right now, we’re standing at a crossroads—one that could lead to either a deeper freeze or a quiet recovery.
💡 Final Advice for Traders
In times like this, your most powerful tools aren’t indicators or news—they’re your mindset and risk control.
If the market feels cold, slow down your trading, tighten your stops, and keep your liquidity flexible.
Sometimes, a winter is not a punishment—it’s an invitation to rest, learn, and prepare for the next move.
🪶 Summary
The crypto market is balancing on a fine line.
The cold signs are visible, yet hope still breathes beneath the surface.
Focus on data, emotion control, and TradingView tools to stay ahead of the crowd.
Don’t fear the frost sometimes, opportunity is hidden in the ice.
💡golden recommendations
Always define your exit and stop loss before entering.
Enter trades only when your mind is calm, not emotional.
✨ Need a little love!
We pour love into every post your support keeps us inspired! 💛 Don’t be shy, we’d love to hear from you on comments. Big thanks, Mad Whale 🐋
📜Please make sure to do your own research before investing, and review the disclaimer provided at the end of each post.
The Rise of Blockchain in Global Trading1. Introduction
The financial world has been continuously evolving with the help of emerging technologies, and among the most transformative is blockchain. Originally conceptualized as the underlying framework of Bitcoin, blockchain has now transcended its initial purpose to revolutionize a wide range of industries—especially trading and finance. The introduction of blockchain-based trading platforms has redefined how assets are exchanged, tracked, and settled globally.
In essence, blockchain trading refers to the use of distributed ledger technology (DLT) to record, verify, and settle trades in a transparent, secure, and decentralized manner. It eliminates intermediaries such as brokers, clearing houses, and banks, allowing participants to transact directly. From cryptocurrency trading to tokenized assets, blockchain technology is reshaping how markets function and how value is transferred.
2. Understanding Blockchain Technology
At its core, a blockchain is a decentralized, immutable digital ledger that records transactions across multiple computers, ensuring transparency and security. Each transaction is grouped into a “block,” linked chronologically to previous ones, forming a “chain.”
Key features of blockchain include:
Decentralization: No single authority controls the network.
Transparency: All participants can view the ledger’s records.
Immutability: Once recorded, data cannot be altered.
Security: Cryptographic algorithms protect transactions.
These features are particularly valuable in the trading world, where trust, speed, and transparency are crucial.
3. Evolution of Trading Systems
Traditionally, trading systems relied heavily on centralized intermediaries. For example, in stock trading, a buyer and seller do not interact directly; instead, their orders are processed through brokers, exchanges, and clearinghouses. This structure ensures trust but adds costs, delays, and risks such as counterparty default.
With the introduction of electronic trading in the late 20th century, markets became faster but still retained centralized control. The next logical evolution is blockchain-based trading, which removes unnecessary middle layers and offers real-time peer-to-peer settlement.
4. Blockchain in Financial Markets
Blockchain’s integration into trading is already visible in multiple segments of the financial market:
Cryptocurrency Exchanges:
These platforms allow the trading of digital currencies like Bitcoin, Ethereum, and stablecoins. They can be centralized (Binance, Coinbase) or decentralized (Uniswap, PancakeSwap).
Tokenized Securities:
Stocks, bonds, or real estate can be “tokenized” — represented as digital tokens on a blockchain. This allows fractional ownership, global accessibility, and faster settlement.
Smart Contracts in Derivatives Trading:
Smart contracts are self-executing contracts coded on the blockchain. They automatically enforce the terms of agreements without intermediaries, ideal for futures, options, or swaps.
Commodity and Forex Trading:
Blockchain can streamline supply chain verification in commodities and ensure transparency in forex settlements using stablecoins or central bank digital currencies (CBDCs).
5. How Blockchain Enhances Trading Efficiency
Blockchain improves trading systems in several critical areas:
a. Transparency
Every participant on a blockchain can view and verify transactions. This openness reduces fraud, market manipulation, and insider trading, fostering a more trustworthy market environment.
b. Real-Time Settlement
Traditional trading systems often take two to three days for trade settlement (T+2). Blockchain enables instant settlement (T+0), freeing up capital and reducing counterparty risk.
c. Reduced Intermediaries
Blockchain allows direct peer-to-peer transactions, reducing fees charged by brokers, clearinghouses, and custodians.
d. Security and Fraud Prevention
The cryptographic structure of blockchain ensures that transactions cannot be tampered with. This makes fraudulent alterations or hacking extremely difficult.
e. Accessibility
Blockchain platforms operate globally and are accessible 24/7. This democratizes trading, allowing individuals from any country to participate in financial markets.
6. Types of Blockchain Trading Platforms
There are primarily three models of blockchain trading ecosystems:
Centralized Exchanges (CEXs):
Run by private entities that control user data and funds. Examples: Binance, Kraken. These offer liquidity and user-friendly interfaces but compromise decentralization.
Decentralized Exchanges (DEXs):
Operate on smart contracts without intermediaries. Examples: Uniswap, SushiSwap. Users retain full control over their funds and trade directly from their wallets.
Hybrid Exchanges:
Combine the liquidity of CEXs and the autonomy of DEXs. They offer regulated trading environments while maintaining blockchain transparency.
7. Tokenization: The New Frontier in Trading
Tokenization refers to the process of converting real-world assets (RWAs) such as stocks, real estate, commodities, or even art into digital tokens stored on a blockchain.
For instance:
A $1 million property can be divided into 1,000 tokens worth $1,000 each.
Investors worldwide can trade these tokens, creating liquidity in traditionally illiquid assets.
Benefits of Tokenization:
Increased liquidity for physical assets.
Global market participation.
Fractional ownership opportunities.
Automated compliance through smart contracts.
Tokenized assets are becoming a cornerstone of blockchain-based trading, with major financial institutions exploring blockchain infrastructure for digital securities issuance and settlement.
8. Smart Contracts: Automating the Trading Process
Smart contracts are self-executing programs that perform predefined actions when certain conditions are met. In trading, they enable:
Automated settlement of trades once both parties meet conditions.
Execution of derivatives based on market triggers.
Instant clearing without manual intervention.
For example, in a decentralized options trading setup, a smart contract automatically releases funds when a price reaches a target level. This reduces disputes, delays, and operational costs.
9. Blockchain in Commodity and Supply Chain Trading
Blockchain is not limited to financial instruments—it’s transforming commodity trading and supply chain finance as well.
In oil trading, blockchain tracks shipments, verifies authenticity, and automates payment on delivery confirmation.
In agriculture and metals, blockchain ensures ethical sourcing and transparency, helping traders comply with global regulations.
For instance, companies like Vakt and Komgo use blockchain to digitalize post-trade processes in commodity markets, significantly cutting costs and paperwork.
10. Role of Stablecoins and CBDCs in Blockchain Trading
Volatility is a major concern in cryptocurrency markets. Stablecoins—cryptocurrencies pegged to fiat currencies like USD—bridge this gap by offering stability and liquidity.
Similarly, Central Bank Digital Currencies (CBDCs), issued by national authorities, can integrate directly into blockchain trading platforms, enabling regulated digital settlements with the efficiency of crypto transactions and the trust of fiat currency.
11. Regulatory Challenges and Risks
While blockchain offers immense potential, several challenges hinder its mainstream adoption in trading:
Regulatory Uncertainty:
Governments worldwide are still formulating policies around digital assets and decentralized platforms.
Market Manipulation and Scams:
Lack of oversight in some exchanges can lead to pump-and-dump schemes or rug pulls.
Security Risks:
Smart contract vulnerabilities or poor wallet management can lead to fund losses.
Scalability and Energy Consumption:
Early blockchains like Bitcoin face scalability issues and high energy usage, though newer models (like Proof-of-Stake) are solving this.
Lack of Interoperability:
Different blockchains often operate in isolation, making cross-platform trading complex. However, emerging technologies like cross-chain bridges and interoperable protocols are addressing this.
12. Blockchain-Based Trading in Practice
Major financial institutions are already adopting blockchain for trading operations:
JP Morgan’s Onyx platform uses blockchain for real-time interbank settlements.
Nasdaq and London Stock Exchange are experimenting with blockchain for securities issuance and post-trade processes.
DeFi (Decentralized Finance) platforms like Aave and Compound enable borrowing, lending, and yield trading directly through blockchain networks.
These developments mark a shift from blockchain as a niche technology to a mainstream financial infrastructure.
13. Advantages for Traders and Investors
Blockchain trading offers multiple benefits for both retail and institutional participants:
Faster settlement cycles (T+0)
Lower transaction fees
Enhanced transparency and security
24/7 global access
Improved liquidity through tokenization
Reduced counterparty and credit risks
This creates a more inclusive, efficient, and secure financial environment, empowering individuals and reducing dependency on traditional institutions.
14. Future of Trading with Blockchain
The future of trading will likely be defined by digital integration, automation, and decentralization. Blockchain will play a central role in enabling:
Global decentralized exchanges for all asset classes
Interoperable networks connecting banks, regulators, and traders
Tokenized stock markets and real estate platforms
AI-powered blockchain analytics for predictive trading
As blockchain merges with Artificial Intelligence (AI), Internet of Things (IoT), and quantum computing, trading systems will become smarter, more transparent, and self-regulating.
15. Conclusion: The New Era of Trustless Trading
Blockchain has introduced a paradigm shift in the trading ecosystem. By eliminating intermediaries, enabling transparency, and automating settlements, it provides a trustless yet trustworthy infrastructure. Traders gain greater control, investors enjoy faster access to opportunities, and institutions achieve operational efficiency.
While challenges remain in terms of regulation, scalability, and global standardization, the trajectory is clear — blockchain is redefining the future of trading. From cryptocurrencies to tokenized equities and beyond, this technology is laying the foundation for a decentralized financial world where efficiency, trust, and innovation coexist seamlessly.

How Smart Money Hunts Liquidity on Gold🔶 1. Understanding Liquidity in the Market
Liquidity represents the orders resting above or below obvious price levels — mainly stop-losses and pending orders placed by retail traders.
In simple terms, where you see equal highs, equal lows, or strong swing points, that’s where liquidity pools exist.
On Gold (XAUUSD), because of its volatility, liquidity often accumulates near:
Double tops or double bottoms.
Previous day highs/lows.
Fair value gaps (imbalances).
Psychological round levels like $2300, $2350, $2400, etc.
These zones attract both buyers and sellers — and that’s exactly where Smart Money (institutional traders) aims to act.
🔶 2. What Smart Money Actually Does
Smart Money doesn’t follow retail moves — it creates them.
When price consolidates and retail traders position themselves early, institutions push price beyond these zones to:
Trigger retail stop losses.
Fill their own large institutional orders at better prices.
Remove weak hands from the market.
This process is called a Liquidity Hunt or Stop Hunt.
It’s not manipulation in a malicious sense — it’s simply how large players execute size efficiently in a decentralized market.
🔶 3. The Classic Gold Liquidity Hunt Pattern
Let’s break down a typical Smart Money setup on XAUUSD:
Step 1:
Price builds equal highs (or equal lows) — retail traders see it as a breakout zone.
Step 2:
Institutions push price slightly beyond that area, creating a false breakout.
Stop-losses of early traders are triggered — this is the liquidity grab.
Step 3:
Immediately after the sweep, structure shifts (Change of Character / CHoCH).
This confirms that Smart Money has completed its collection phase and is now ready to move price in the intended direction.
Step 4:
Price often retraces back into the order block or fair value gap left behind by displacement.
This is where the high-probability entry lies — the Smart Money entry point.
🔶 4. Why Gold (XAUUSD) Shows This So Clearly
Gold is one of the most liquid and manipulated markets on the planet — ideal for studying Smart Money behavior.
Because it trades heavily during London and New York sessions, liquidity is constantly generated and removed.
This is why you’ll frequently see:
Sudden spikes before major sessions open.
Sharp sweeps before news events (CPI, NFP, FOMC).
Rapid reversals after stop-hunts.
Institutions use gold as a liquidity engine, often hunting both sides of the market before the real move.
🔶 5. How to Identify a Real Liquidity Hunt (Checklist)
Use this professional checklist to train your eye:
✅ Look for equal highs/lows forming before the move.
✅ Wait for a stop-hunt candle — a long wick piercing liquidity zone.
✅ Confirm a market structure shift (MSS or CHoCH) in lower timeframe.
✅ Entry only after displacement and a clean retracement into an order block.
Avoid reacting emotionally to every breakout — Smart Money uses time + patience to trick impulsive traders.
🔶 6. Practical Educational Example
Suppose Gold forms equal highs at $2380 during the London session.
Many retail traders place buy stops above $2380 expecting a breakout.
Institutions see that as a liquidity pool.
Price suddenly spikes to $2385, sweeps those buy stops, and then drops to $2360 — that’s your liquidity hunt.
Once the structure shifts bearish after the sweep, Smart Money has filled sell orders at a premium — and the downtrend resumes.
🔶 7. Educational Takeaway
Smart Money doesn’t predict — it reacts to liquidity.
By understanding where traders are trapped, you align your trades with institutional flow instead of retail emotion.
📘 Key Principles:
Trade after the liquidity grab, not before.
Always wait for confirmation through structure shift.
Focus on zones of interest, not random breakouts.
Observe timing — most liquidity hunts occur during session opens or high-impact news.
💬 Final Note:
Every chart tells a story — but only those who understand liquidity can read the true language of price.
Study it, practice it, and you’ll see how Smart Money creates opportunity through manipulation and order flow.
📘 Follow me for more professional educational content on Smart Money, Liquidity, and Gold market behavior.
Reserve Currency Dominance: Mechanisms, History, and Future OutlIntroduction
In the complex fabric of the global economy, the concept of reserve currency dominance plays a crucial role in shaping international trade, finance, and geopolitical power. A reserve currency is a foreign currency that central banks and major financial institutions hold in large quantities for international transactions, investments, and to stabilize their own currencies. Dominance in reserve currency status means that one currency—historically the U.S. dollar—acts as the world’s primary medium of exchange, store of value, and unit of account in the global financial system.
Reserve currency dominance is not merely a matter of economics; it embodies political influence, military strength, and institutional trust. Over time, it has dictated global trade patterns, shaped capital flows, and influenced monetary policy decisions across nations. This essay explores the evolution, mechanisms, and implications of reserve currency dominance, with particular focus on the U.S. dollar’s supremacy and emerging challenges in a multipolar world.
Historical Evolution of Reserve Currency Dominance
The concept of a reserve currency is centuries old. Historically, the dominant reserve currency has always been associated with the world’s leading economic and military power. During different eras, currencies such as the Venetian ducat, Spanish silver real, Dutch guilder, and British pound sterling held global reserve status. Each period of dominance reflected the geopolitical and economic influence of the issuing nation.
1. The British Pound Era (19th to early 20th century)
During the 19th century, the British Empire’s global reach made the pound sterling the leading reserve currency. London emerged as the world’s financial capital, and the gold standard provided monetary stability. Nations held pounds because they trusted Britain’s financial institutions and its vast trade networks. The sterling system symbolized confidence, liquidity, and convertibility into gold.
2. Transition to the U.S. Dollar (Post-World War II)
World War II shifted the economic balance of power. The United States emerged as the world’s industrial powerhouse, holding the majority of global gold reserves. The Bretton Woods Agreement (1944) institutionalized the U.S. dollar as the world’s primary reserve currency, pegged to gold at $35 per ounce. Other currencies were pegged to the dollar, effectively making it the world’s anchor currency.
3. Post-Bretton Woods and Dollar Supremacy
In 1971, President Richard Nixon ended the dollar’s convertibility to gold, marking the collapse of Bretton Woods. Yet, the dollar retained its dominance due to the Petrodollar system, in which oil prices were denominated in dollars, and the global reliance on U.S. financial markets. The U.S. economy’s depth, liquidity, and stability continued to attract foreign reserves, even without a gold peg.
Mechanisms Sustaining Reserve Currency Dominance
For a currency to dominate global reserves, several interlinked mechanisms must operate effectively:
1. Economic Scale and Stability
A dominant reserve currency is typically issued by the world’s largest and most stable economy. The United States accounts for a significant share of global GDP and trade, providing the dollar with a vast network of transactions. Economic scale ensures that the currency is widely used and trusted.
2. Deep and Liquid Financial Markets
Reserve currencies require large, stable, and liquid financial markets. The U.S. Treasury market, for example, is the most liquid in the world, allowing investors and central banks to buy and sell assets without major price fluctuations. The reliability of these markets gives central banks confidence in holding dollar-denominated assets.
3. Institutional Trust and Rule of Law
The credibility of the issuing nation’s institutions—its central bank, judiciary, and regulatory bodies—is vital. The U.S. Federal Reserve and the country’s legal system offer transparency, predictability, and strong investor protections. This institutional trust is a cornerstone of reserve currency dominance.
4. Network Effects
Once a currency becomes dominant, it benefits from self-reinforcing network effects. Global trade, finance, and commodities become priced in that currency, making it more convenient and efficient for countries to hold it as reserves. The more it is used, the more valuable it becomes for global participants.
5. Geopolitical and Military Influence
Reserve currency dominance often parallels military and political power. The U.S., through its global alliances and defense capabilities, has maintained a secure international environment that underpins confidence in its currency. Countries tend to hold the currency of a politically stable superpower rather than that of a regional or unstable state.
The Dollar’s Global Dominance
The U.S. dollar remains the world’s undisputed reserve currency, despite growing talk of diversification and de-dollarization. According to the International Monetary Fund (IMF), roughly 58% of global foreign exchange reserves are held in U.S. dollars (as of 2025). The euro follows with around 20%, while other currencies such as the Japanese yen, British pound, and Chinese yuan make up smaller portions.
1. Role in Global Trade
Approximately 80% of global trade transactions are invoiced in U.S. dollars. Even countries not directly trading with the U.S. use the dollar as a reference currency. This global acceptance simplifies pricing, invoicing, and payment settlements.
2. Dollar in Financial Markets
Global commodities—including oil, gold, and agricultural products—are predominantly priced in dollars. Additionally, international debt issuance and cross-border banking rely heavily on dollar-denominated assets, reinforcing the greenback’s global reach.
3. U.S. Treasury Securities
Central banks hold U.S. Treasury bonds as a primary form of reserves due to their safety and liquidity. During times of crisis, investors typically rush to U.S. assets, further strengthening the dollar’s position—a phenomenon known as the “flight to safety.”
Benefits of Reserve Currency Dominance
For the United States, reserve currency dominance brings numerous advantages that few other nations enjoy:
1. Lower Borrowing Costs
Because global demand for U.S. Treasury securities remains strong, the U.S. government can borrow at lower interest rates. This allows America to finance large fiscal deficits with relative ease—a phenomenon referred to as the “exorbitant privilege.”
2. Global Influence
The dollar’s dominance gives the U.S. substantial geopolitical leverage. Economic sanctions, trade restrictions, and financial controls imposed through the dollar-based system can effectively isolate nations from global finance.
3. Economic Stability
Global demand for dollars helps stabilize the U.S. economy by attracting continuous capital inflows. The dollar’s safe-haven status often cushions the U.S. from financial turbulence affecting other economies.
Costs and Risks of Dominance
While reserve currency dominance offers power and privilege, it also entails structural challenges:
1. Trade Deficits
To supply the world with dollars, the U.S. must run persistent current account deficits. This structural imbalance, known as the Triffin Dilemma, means that the U.S. must provide global liquidity even at the cost of domestic imbalances.
2. Policy Constraints
Because of the global demand for dollars, U.S. monetary policy has international consequences. Interest rate hikes or cuts by the Federal Reserve can trigger capital flows, currency fluctuations, and inflationary pressures across emerging markets.
3. Financial Overdependence
Excessive global reliance on the dollar creates vulnerabilities. Any disruption in the U.S. financial system—such as the 2008 crisis—spreads rapidly worldwide. The dollar’s centrality amplifies systemic risks.
Challenges to Dollar Dominance
Although the dollar remains unrivaled, several forces are gradually reshaping the reserve currency landscape.
1. Rise of the Euro
The euro, since its introduction in 1999, has become the second most held reserve currency. The European Union’s large economy and integrated financial systems support its use, though political fragmentation and lack of a unified fiscal policy limit its potential to dethrone the dollar.
2. The Chinese Yuan (Renminbi)
China’s yuan has been gaining recognition, particularly after its inclusion in the IMF’s Special Drawing Rights (SDR) basket in 2016. The Belt and Road Initiative (BRI), expansion of the Cross-Border Interbank Payment System (CIPS), and increasing yuan-denominated trade have supported China’s long-term ambitions for currency internationalization. However, capital controls and limited market transparency remain major obstacles.
3. Digital Currencies and CBDCs
The emergence of Central Bank Digital Currencies (CBDCs) and blockchain-based payment systems presents potential alternatives to traditional reserve systems. China’s digital yuan, for example, aims to reduce dependency on the dollar-dominated SWIFT system. Similarly, discussions of a BRICS currency or digital gold-backed instruments indicate growing interest in multipolar monetary frameworks.
4. De-dollarization Trends
In recent years, several nations have diversified their reserves away from the dollar. Russia, China, and members of the BRICS alliance have increased holdings of gold and other currencies. Moreover, countries are exploring bilateral trade in local currencies, particularly in energy and defense sectors.
Future Outlook: Multipolar Currency Order
The global financial architecture is gradually shifting from unipolar to multipolar. While the dollar’s dominance will likely continue in the medium term, structural trends suggest a slow diversification of global reserves.
Short-term outlook (2025–2035):
The dollar will remain dominant due to trust, liquidity, and institutional strength. Alternative systems may gain traction but won’t replace the dollar outright.
Medium-term outlook (2035–2050):
A multipolar system may emerge with the euro, yuan, and possibly digital assets sharing reserve functions. The share of the dollar could decline to around 40–45%.
Long-term outlook:
Global reserve systems may evolve into digital or commodity-backed models, reducing dependence on any single national currency. The rise of blockchain-based settlement systems may redefine monetary sovereignty and financial autonomy.
Conclusion
Reserve currency dominance has always been a reflection of global power structures—economic, political, and institutional. The U.S. dollar’s supremacy, forged after World War II, remains the cornerstone of the modern financial system. Its strength lies in America’s vast economic capacity, transparent markets, and geopolitical influence. Yet, this dominance is not guaranteed forever.
As the world transitions toward multipolarity—with the rise of China, the European Union’s consolidation, and the emergence of digital currencies—the foundations of the dollar-based order are being tested. While no alternative yet offers the same combination of trust, liquidity, and stability, the long-term trajectory suggests a gradual diversification of global reserves.
Ultimately, the future of reserve currency dominance will depend not only on economic fundamentals but also on technological innovation, geopolitical cooperation, and the resilience of global financial institutions. The dollar’s reign may persist, but the seeds of a new, more balanced monetary order are already being sown.

Indicator Trading vs Price Action TradingIn the world of trading, most people start with Indicator Trading , but only those who truly understand the market eventually evolve into Price Action Trading.
These two approaches aren’t enemies — they’re actually two stages in the mindset evolution of a professional trader.
1. Indicator Trading – When You Trade the “Consequences” of Price
Indicators are tools built from historical data.
They measure strength, momentum, and direction of price movements.
For example:
RSI tells you whether the market is overbought or oversold. EMA reflects the average trend. MACD shows the momentum behind the move.
However, the core weakness of indicators lies in their lag.
By the time you see a buy signal, the price has already moved.
If you rely solely on indicators, you’ll always be reacting to the market instead of leading it.
💡 Indicator trading gives you structure and discipline — but sometimes that same structure makes you miss the real rhythm of the market.
2. Price Action Trading – When You Trade the “Story” Behind Price
Price Action requires no indicators.
It teaches you to read the emotions of the market through every candle, every price zone, and every false break.
Here, the market is no longer a series of numbers — it’s a story between buyers and sellers.
When you start to understand:
Why price forms higher lows — showing buyers gaining control.
Why a long wick appears — showing weaker players trying to fight back.
Why a “liquidity grab” happens — showing how smart money traps retail traders.
That’s when you no longer need signals — because you’ve learned to speak the language of price itself.
Price Action teaches you not just to trade with your eyes, but with your mind.
3. The True Essence – It’s Not About Choosing a Side, But Choosing a Perspective
A professional trader doesn’t “hate” indicators nor “worship” price action.
They understand one simple truth:
Indicators are the map — Price Action is the terrain.
A map gives you direction.
But if you only stare at the map without observing the terrain, you’ll fall off a cliff.
And if you only look at the ground without knowing where you’re headed, you’ll get lost.

Global Shadow Banking SystemIntroduction
The global financial system is vast and complex, with countless institutions facilitating the movement of money, credit, and investment around the world. While traditional banking systems — composed of central banks, commercial banks, and regulated financial intermediaries — are well known and strictly supervised, another parallel financial network operates mostly outside traditional regulatory frameworks. This network is known as the shadow banking system.
Shadow banking plays a crucial role in providing liquidity and credit to global markets, but it also introduces significant risks due to its lack of transparency and oversight. Understanding this system is vital to grasp how modern finance truly functions — both its strengths and its vulnerabilities.
What Is Shadow Banking?
The term “shadow banking” was first coined by economist Paul McCulley in 2007 to describe credit intermediation that occurs outside the traditional banking system. In simple terms, shadow banking involves non-bank financial intermediaries that perform similar functions as banks — such as lending, borrowing, and credit creation — but are not subject to the same regulatory oversight.
These entities can include:
Money market funds
Hedge funds
Private equity firms
Structured investment vehicles (SIVs)
Finance companies
Insurance companies (in certain activities)
Peer-to-peer (P2P) lenders
Securitization conduits
Investment banks (in off-balance-sheet activities)
Although they do not take deposits like traditional banks, shadow banking entities borrow funds and provide credit through instruments like repos (repurchase agreements), asset-backed securities, and commercial paper.
Origins and Evolution of the Shadow Banking System
The shadow banking system began to grow rapidly in the 1980s and 1990s, coinciding with financial deregulation and the rise of securitization. The following developments shaped its evolution:
Financial Innovation:
The creation of mortgage-backed securities (MBS) and collateralized debt obligations (CDOs) allowed banks to offload loans from their balance sheets. These securities were then sold to investors, enabling more lending without increasing regulatory capital requirements.
Regulatory Arbitrage:
Traditional banks faced strict capital and liquidity rules. To circumvent these constraints, financial institutions began creating off-balance-sheet entities, such as SIVs and conduits, that could perform similar lending and investment functions without being bound by regulatory limits.
Globalization of Finance:
As capital markets became interconnected, the shadow banking system evolved into a global network of credit intermediation. Funds flowed freely between developed and emerging markets, creating a vast pool of liquidity.
The 2008 Financial Crisis:
Before the global financial crisis, the U.S. shadow banking system grew to rival the size of the traditional banking system. However, when the housing bubble burst, many shadow banking entities collapsed due to a sudden liquidity freeze. Lehman Brothers, Bear Stearns, and various SIVs exemplified the dangers of excessive leverage and opacity.
Post-Crisis Restructuring:
Following 2008, regulators introduced measures like the Dodd-Frank Act in the U.S. and Basel III globally. Yet, the shadow system adapted — new forms emerged in fintech, asset management, and private credit markets, making the sector once again a central force in global finance.
Structure and Functioning of Shadow Banking
The shadow banking system performs credit intermediation in several steps, often involving complex chains of transactions:
Funding Sources:
Shadow banks obtain short-term funding from institutional investors, money market funds, or repo markets.
Credit Transformation:
These funds are used to purchase long-term, higher-yield assets — such as loans or securities — thereby transforming short-term liabilities into long-term investments.
Maturity Transformation:
Just like banks, shadow entities borrow short-term and lend long-term, earning profit from the difference in interest rates (the “maturity spread”).
Liquidity Transformation:
Illiquid loans are converted into marketable securities through securitization, increasing liquidity and investor access.
Leverage:
Shadow banks often rely heavily on leverage to amplify returns. This amplifies both profits and risks, particularly during market downturns.
Essentially, shadow banking acts as an alternative credit channel, fueling corporate financing, real estate investment, and consumer lending, especially when traditional banks are constrained by regulation or risk aversion.
Major Components of the Global Shadow Banking System
1. Money Market Funds (MMFs)
MMFs provide short-term financing to corporations and financial institutions. They invest in low-risk securities but can become unstable during crises when investors rapidly withdraw funds.
2. Securitization Vehicles
Entities like SIVs package loans (such as mortgages or auto loans) into tradable securities. These instruments spread credit risk across investors but can become opaque and risky when underlying asset quality deteriorates.
3. Hedge Funds and Private Credit Funds
Hedge funds engage in high-leverage strategies, while private credit funds lend directly to corporations, especially mid-sized firms that cannot easily access bank financing.
4. Repurchase Agreement (Repo) Markets
Repos are short-term collateralized loans between institutions. They are a vital funding source for shadow banks but can dry up quickly during financial stress.
5. Fintech and Peer-to-Peer (P2P) Lending
In the modern era, technology-driven platforms offer loans directly to consumers and businesses, bypassing banks entirely. These digital intermediaries are a fast-growing segment of shadow banking.
Benefits of Shadow Banking
Despite its “shadowy” reputation, the system provides several key benefits:
Credit Expansion:
Shadow banking supplements traditional lending, ensuring that households and businesses have access to credit even when banks tighten lending standards.
Market Liquidity:
By transforming illiquid assets into tradable securities, it enhances market depth and efficiency.
Innovation and Competition:
Shadow banks often pioneer financial products and technologies that traditional banks later adopt.
Diversified Funding:
Companies can raise funds through multiple channels, reducing dependency on commercial banks.
Global Capital Mobility:
Cross-border shadow banking allows global investors to access emerging market opportunities, promoting financial integration.
Risks and Challenges
While shadow banking provides flexibility and liquidity, it also poses significant systemic risks due to its structure and lack of oversight:
1. Lack of Transparency
Many shadow banking activities occur off-balance-sheet, making it difficult for regulators and investors to assess true risks.
2. Leverage and Liquidity Mismatch
Borrowing short-term to fund long-term assets creates vulnerability to sudden funding withdrawals — the same dynamic that triggered the 2008 crisis.
3. Contagion Risk
Although shadow banks are “non-banks,” they are deeply interconnected with the traditional financial system through repo markets, derivatives, and investment linkages. A shock in one sector can rapidly spread across the financial network.
4. Regulatory Arbitrage
Since shadow banks operate outside strict capital rules, they may engage in riskier behavior for higher returns, undermining the purpose of banking regulations.
5. Market Volatility
Shadow banks often amplify boom-and-bust cycles through speculative trading and leveraged investments.
6. Moral Hazard
Investors might assume that shadow banks, like regular banks, will receive government support during crises, encouraging excessive risk-taking.
Global Distribution and Scale
According to data from the Financial Stability Board (FSB), the global shadow banking system — or “non-bank financial intermediation (NBFI)” — manages over $60 trillion to $70 trillion in assets. Major regions include:
United States: Dominates global shadow banking through investment funds, securitization, and repo markets.
Europe: Hosts large asset management and insurance-linked shadow banking entities.
China: Rapidly expanded shadow banking via trust companies and wealth management products, though regulatory tightening has slowed growth.
Emerging Markets: Growing involvement through fintech lending, private credit, and offshore investments.
This vast scale means that shadow banking now accounts for nearly half of global financial assets, making it indispensable — but also potentially destabilizing.
Regulatory Responses and Reforms
Post-2008, global regulators recognized the need to monitor and manage shadow banking risks more effectively.
1. Financial Stability Board (FSB) Framework
The FSB introduced a global framework to track and regulate non-bank financial intermediation. It classifies entities by their risk profile and potential for systemic impact.
2. Basel III and Capital Requirements
Stricter capital and liquidity rules for banks have indirectly reduced risky off-balance-sheet exposures, though some activities migrated further into the shadows.
3. Dodd-Frank Act (U.S.)
Improved transparency for derivatives, money market funds, and securitized products, requiring higher disclosure and stress testing.
4. European Union Regulation
The EU introduced the Alternative Investment Fund Managers Directive (AIFMD) and Money Market Fund Regulation to supervise hedge funds and MMFs.
5. China’s Crackdown
Since 2017, China has aggressively regulated its shadow banking sector, consolidating wealth management products and reducing trust loan exposures.
Despite these measures, the system remains dynamic and elusive, constantly evolving to exploit new loopholes or technological innovations.
The Role of Fintech and Digital Shadow Banking
The rise of fintech, cryptocurrencies, and decentralized finance (DeFi) has ushered in a new era of shadow banking. These platforms offer credit, trading, and yield generation outside traditional supervision.
Examples include:
Stablecoins acting as quasi-deposits.
Crypto lending platforms mimicking traditional money markets.
Decentralized protocols providing automated liquidity and lending.
While innovative, these systems introduce fresh risks — from cybersecurity and fraud to the absence of legal recourse — that mirror early shadow banking vulnerabilities in new digital forms.
Future Outlook
The global shadow banking system is unlikely to disappear. Instead, it will continue to evolve and expand, driven by three forces:
Financial Innovation:
As new financial technologies emerge, shadow banking will adapt to meet the demand for alternative funding and investment products.
Regulatory Gaps:
Tighter banking regulations often push activities into less-regulated areas. Unless global oversight becomes more comprehensive, risk migration will persist.
Investor Demand for Yield:
In an environment of fluctuating interest rates and low returns, investors seek higher-yielding products — a demand that shadow banks readily fulfill.
However, global financial stability depends on balancing innovation with regulation. Enhanced data sharing, transparency requirements, and coordinated international supervision are essential to prevent another systemic crisis.
Conclusion
The global shadow banking system represents both the ingenuity and the fragility of modern finance. By providing liquidity, credit, and market flexibility, it complements traditional banking and fuels economic growth. Yet its opacity, interconnectedness, and potential for contagion make it a double-edged sword.
As the boundaries between banking, capital markets, and technology blur, understanding and regulating shadow banking is one of the most important challenges facing policymakers and investors today. The key lies in ensuring that the system’s light — innovation and liquidity — is not overshadowed by its dark side of hidden risk and instability.
The Market is a Mirror — Not a Battlefield“Most traders fight the market.
The wise quietly observe — and realize they were fighting themselves.”
Every trader begins with the same illusion:
That the market is an opponent.
That success means winning against it.
But the truth is deeper — and quieter.
The market doesn’t fight you, test you, or trick you.
It simply reflects you : your fear, greed, patience, and discipline.
Why Most Traders Struggle?
When you call the market your enemy, you create conflict.
You start reacting emotionally to every candle.
You chase wins to heal your losses.
You overtrade to prove your worth.
And every chart becomes a battlefield of ego.
The Mirror View
Every loss points to your impatience.
Every missed entry points to your need for control.
Every winning trade tests your ability to stay humble.
That’s not punishment — it’s reflection.
When you begin to see this, your mindset changes:
You stop forcing trades.
You stop fighting.
You start listening.
How to Practice This
Pause before every trade and ask: “What am I feeling?”
Journal not just your entries, but your state of mind.
Watch your reactions more than your P&L.
Let silence between trades sharpen your awareness.
Trading mastery isn’t found on the chart —
It’s found in the mirror .
The moment you stop fighting the market,
you begin to understand it.
📘 Shared by @ChartIsMirror
If this perspective resonates with you, share your reflection below —
What do you see in your market mirror?

Eurodollar Secrets: The Hidden Engine of Global FinanceIntroduction
The Eurodollar market is one of the least understood yet most powerful forces in the global financial system. Despite its name, the Eurodollar has nothing to do with Europe’s single currency, the euro. Instead, it refers to U.S. dollar deposits held in banks outside the United States, primarily in Europe but also across the world.
The Eurodollar system operates largely beyond the control of U.S. regulators, making it a key component of the global shadow banking system. It underpins international trade, corporate borrowing, global liquidity, and even central bank policy — all while functioning outside traditional monetary oversight.
In this article, we will uncover the origins, mechanics, advantages, risks, and modern relevance of the Eurodollar market, revealing why it remains the hidden backbone of global finance.
1. Origins of the Eurodollar Market
The Eurodollar market traces its roots back to the 1950s Cold War era. The term “Eurodollar” was coined because large dollar deposits were held by European banks outside the jurisdiction of the United States.
The origins are tied to two main developments:
a. Post-War Dollar Dominance
After World War II, the U.S. dollar emerged as the world’s reserve currency under the Bretton Woods system. Global trade and reconstruction efforts required vast amounts of dollars, leading many foreign banks to hold U.S. dollar deposits for international transactions.
b. Avoiding U.S. Regulation
During the Cold War, the Soviet Union and Eastern Bloc nations wanted to keep their dollar holdings outside the U.S. banking system to avoid potential asset freezes. Thus, they placed their dollars in European banks — particularly in London.
By the late 1950s, British banks began actively accepting and lending these offshore dollars, creating the Eurodollar market. London’s light regulation and time zone advantage made it the ideal hub. Over time, this market exploded in size, becoming the center of global dollar liquidity.
2. Understanding What a Eurodollar Is
A Eurodollar is simply a U.S. dollar deposit held outside the United States — whether in a London bank, a Swiss financial institution, or a Singapore branch.
These deposits are not subject to U.S. Federal Reserve reserve requirements or U.S. banking regulations. That means banks can offer higher interest rates and greater flexibility.
Example:
A Japanese corporation might deposit $50 million in a London bank account denominated in U.S. dollars. That deposit is a Eurodollar. The London bank may then lend those dollars to a Canadian energy company — all in dollars, but outside the U.S. banking system.
This offshore system has created a parallel dollar-based economy, vast in scale and largely invisible to the average investor.
3. How the Eurodollar Market Works
The Eurodollar market functions through a network of offshore banks, corporations, and financial institutions engaged in borrowing and lending U.S. dollars.
a. Depositors
Corporations, governments, and investors deposit their U.S. dollars in offshore banks to earn interest or finance international operations.
b. Borrowers
Multinational corporations, hedge funds, and even governments borrow Eurodollars to fund trade, investment, or speculative activities.
c. Interbank Market
Much of the Eurodollar trading occurs between banks themselves — known as the interbank market — where banks lend and borrow dollars to manage liquidity.
Interest rates in this market are often benchmarked to the London Interbank Offered Rate (LIBOR) (now replaced by SOFR and other benchmarks). For decades, LIBOR served as the heartbeat of Eurodollar lending.
4. Advantages of the Eurodollar Market
The Eurodollar system provides several key benefits that made it indispensable to global finance:
a. Regulatory Freedom
Eurodollars exist outside U.S. banking regulation. Offshore banks are not subject to Federal Reserve requirements, allowing them to operate with greater leverage and flexibility.
b. Higher Yields
Because offshore banks face fewer regulatory costs, they can offer higher interest rates to depositors. This attracted vast inflows of funds from corporations and investors.
c. Global Liquidity
The Eurodollar market acts as a global liquidity pool. It ensures that U.S. dollars are available around the world, facilitating trade, investment, and financial transactions.
d. Efficient Funding
Corporations and banks can access dollar-denominated loans without needing to go through U.S. institutions, making cross-border finance more efficient.
5. The Hidden Power: Eurodollars and Global Monetary Policy
Perhaps the most important — and least understood — aspect of Eurodollars is their influence on global monetary policy.
While the Federal Reserve controls the supply of base dollars inside the U.S., the Eurodollar market creates offshore dollars through bank credit expansion, effectively multiplying the global dollar supply beyond the Fed’s control.
a. Shadow Money Creation
When a London bank makes a $100 million Eurodollar loan, it is essentially creating dollar credit outside the U.S. system. This credit functions like real dollars in global trade and finance.
b. Implications for the Federal Reserve
The Fed’s control over global dollar liquidity is limited. Even if it tightens domestic policy, offshore banks can continue to expand dollar credit abroad, influencing global interest rates and capital flows.
c. Global Dependence on Dollar Liquidity
Countries, corporations, and banks worldwide rely on Eurodollar funding for transactions and debt servicing. When Eurodollar liquidity tightens (as in 2008 or 2020), the entire world feels the squeeze.
6. Eurodollars and the Rise of the Shadow Banking System
The Eurodollar market is a cornerstone of what economists call the “shadow banking system” — financial institutions and instruments that perform bank-like functions without traditional regulation.
Offshore banks, money market funds, and repo markets all interconnect with Eurodollar flows. This system provides immense liquidity but also systemic risk, since it operates largely outside regulatory oversight.
Key Shadow Components:
Eurodollar deposits
Offshore repo agreements
Eurobond markets
Synthetic dollar funding via derivatives
Together, these elements create a web of global credit that underpins everything from corporate loans to emerging market debt.
7. The Eurodollar Futures Market
To manage interest rate risk, traders developed Eurodollar futures — standardized contracts that allow participants to hedge or speculate on future U.S. dollar interest rates.
These contracts, traded on the Chicago Mercantile Exchange (CME) since 1981, became one of the world’s most liquid financial instruments.
How It Works:
Each Eurodollar futures contract represents a $1 million three-month deposit. The price moves inversely to interest rates — when rates rise, the futures price falls.
Uses:
Banks hedge funding costs.
Corporations manage borrowing exposure.
Speculators bet on central bank policy changes.
Even after LIBOR’s phaseout, Eurodollar futures remain crucial for managing short-term dollar rate exposure.
8. Eurobonds and Eurocredit: Expanding the Ecosystem
The Eurodollar market paved the way for Eurobond and Eurocredit markets — global debt instruments denominated in foreign currencies but issued outside the issuer’s home country.
For example, a Japanese company might issue a Eurodollar bond in London to raise dollar funds. Investors love such bonds for their higher yields and flexibility.
Eurocredit loans
These are large, syndicated loans in the Eurodollar market — often used by governments or multinational corporations. The Eurocredit market boomed in the 1970s and 1980s, financing everything from oil projects to emerging market infrastructure.
9. Risks and Crises in the Eurodollar System
Despite its efficiency, the Eurodollar system carries significant risks, primarily due to its opacity and lack of regulation.
a. Lack of Central Bank Backstop
Unlike U.S. banks, offshore Eurodollar institutions cannot access the Federal Reserve’s emergency lending facilities. In crises, they face funding shortages.
b. Contagion Risk
Because the system is interconnected, a liquidity crunch in one part (e.g., London) can quickly ripple through Asia or Latin America.
c. 2008 Global Financial Crisis
The 2008 crisis exposed the fragility of the Eurodollar system. When U.S. funding markets froze, offshore banks could not roll over short-term dollar debt, leading to a global dollar shortage. The Fed had to intervene with swap lines to supply offshore liquidity.
d. Regulatory Blind Spot
Since Eurodollars are created outside the U.S., no single regulator tracks their total supply or leverage. Estimates suggest the offshore dollar system could exceed $15–20 trillion, but the true figure is unknown.
10. Modern Evolution: From LIBOR to SOFR and Beyond
In recent years, the Eurodollar market has undergone transformation. The phaseout of LIBOR (due to manipulation scandals) led to new benchmarks like the Secured Overnight Financing Rate (SOFR) in the U.S. and SONIA in the U.K.
While these reforms aim to improve transparency, the Eurodollar ecosystem remains resilient. Offshore dollar deposits and loans continue to dominate international finance, especially as global trade and digital banking expand.
11. Eurodollars in the 21st Century: Digital and Decentralized Future
The next evolution may involve digital Eurodollars — tokenized U.S. dollar deposits or stablecoins like USDT and USDC. These digital assets function as modern Eurodollars, circulating globally outside U.S. regulation but denominated in dollars.
a. Stablecoins as New Eurodollars
Stablecoins backed by U.S. dollar reserves essentially replicate the Eurodollar structure — offshore, unregulated dollar liquidity.
b. Central Bank Digital Currencies (CBDCs)
In response, central banks are exploring CBDCs to regain control over global dollar flows. The digital dollar could one day reshape how Eurodollar liquidity operates.
12. Why the Eurodollar Still Matters
The Eurodollar market remains the lifeblood of global trade and finance.
Over 80% of international trade is invoiced in U.S. dollars.
Emerging markets depend on Eurodollar funding for growth.
Global corporations borrow and lend in this market daily.
Even though it operates outside official channels, the Eurodollar market’s health directly affects interest rates, liquidity, and financial stability worldwide.
Conclusion: The Invisible Dollar Empire
The Eurodollar system is one of the greatest financial innovations — and enigmas — of modern capitalism. Born from geopolitical necessity, it evolved into a vast offshore network that creates and circulates U.S. dollars beyond U.S. borders.
Its power lies in its invisibility: it influences global liquidity, shapes monetary policy, and fuels international trade, all without direct oversight.
However, with great power comes great risk. The Eurodollar market’s opacity and lack of regulation mean it can amplify crises when liquidity dries up. Understanding its mechanics is crucial for grasping how global finance truly operates beneath the surface.
In essence, the “Eurodollar secret” is that the world runs not on official U.S. dollars alone, but on a shadow network of offshore dollars — a system both indispensable and dangerously fragile.
As global finance shifts toward digital assets and decentralized networks, the spirit of the Eurodollar — global, flexible, and unregulated — may continue to define the next era of money itself.

HOW-TO: Trade-o-Scope Plot Custom Data v2This is a short HOW-TO on using the Trade-o-Scope "Plot Custom Data v2" indicator

Competitive Currency War: An In-Depth AnalysisIntroduction
A competitive currency war, often termed a currency devaluation war, refers to a situation where countries deliberately devalue their currencies to gain a trade advantage over others. In essence, nations engage in a race to weaken their currencies to make exports cheaper and imports costlier, thereby stimulating domestic production and employment. However, while it may provide short-term gains to an individual nation, a widespread currency war can destabilize the global economy, heighten financial volatility, and strain international relations.
The term “currency war” became popular after Brazil’s finance minister Guido Mantega used it in 2010 to describe the growing wave of monetary interventions by major economies after the global financial crisis. Since then, the world has witnessed multiple instances of competitive devaluations, especially during times of economic stress—such as the 2008 crisis, the U.S.–China trade war, and the post-COVID recovery phase.
This essay explores the origins, mechanisms, historical examples, implications, and future trajectory of currency wars in an increasingly globalized and digital financial environment.
1. The Concept and Mechanics of Currency War
A currency war typically arises when multiple countries attempt to depreciate their currencies simultaneously to gain a competitive edge. The underlying mechanism involves monetary policy tools, foreign exchange interventions, and fiscal adjustments.
1.1 Key Mechanisms
Monetary Easing:
Central banks reduce interest rates or adopt quantitative easing (QE) to increase liquidity. Lower interest rates tend to weaken the currency, making exports cheaper.
Foreign Exchange Intervention:
Governments or central banks directly buy foreign currencies (like the U.S. dollar) while selling their own currency to suppress its value in the forex market.
Capital Controls:
Some nations impose restrictions on foreign capital inflows to prevent their currency from appreciating excessively.
Fiscal Expansion:
By increasing government spending or subsidies on export sectors, governments can indirectly stimulate output and trade competitiveness.
1.2 The Economic Logic
The basic idea is simple: if a country’s currency is cheaper relative to others, its exports become more competitive globally, while imports become more expensive. This can improve the trade balance, boost GDP, and create employment. However, this logic fails when every nation follows the same strategy — leading to global instability and inflationary pressures.
2. Historical Background of Currency Wars
Currency wars are not a new phenomenon. They have shaped the global economic order for more than a century, reflecting the interplay between national interests and international stability.
2.1 The Interwar Period (1920s–1930s)
Following World War I, countries abandoned the gold standard to devalue their currencies and support domestic recovery. The United Kingdom’s decision to leave the gold standard in 1931 triggered a wave of competitive devaluations, with nations like the U.S. and France soon following. The result was chaotic: trade collapsed, global demand shrank, and the Great Depression deepened.
2.2 The Bretton Woods System (1944–1971)
In response to interwar chaos, the Bretton Woods Agreement established a system of fixed exchange rates anchored to the U.S. dollar, which itself was convertible to gold. This arrangement aimed to stabilize exchange rates and prevent competitive devaluations. However, by the late 1960s, U.S. fiscal imbalances (due to the Vietnam War and social spending) eroded confidence in the dollar, leading President Richard Nixon to end gold convertibility in 1971 — effectively collapsing the system.
2.3 The 1980s: The Dollar and the Plaza Accord
During the early 1980s, the U.S. dollar surged due to tight monetary policy under Paul Volcker and Reagan-era fiscal expansion. This appreciation hurt U.S. exports and created large trade deficits, prompting the 1985 Plaza Accord. Under this agreement, major economies — the U.S., Japan, West Germany, France, and the U.K. — coordinated to weaken the dollar through joint interventions. This is one of the most successful examples of coordinated currency management in modern history.
2.4 The 2008 Global Financial Crisis and Modern Currency Wars
After 2008, central banks worldwide adopted ultra-loose monetary policies, driving down interest rates and flooding markets with liquidity. The U.S. Federal Reserve’s quantitative easing was followed by similar measures in Europe and Japan. Emerging markets, especially Brazil and China, accused developed nations of starting a “currency war” by artificially suppressing exchange rates through excessive money printing.
2.5 The 2010s: U.S.–China Currency Tensions
China was often accused of manipulating its currency, the yuan, to maintain export competitiveness. The U.S. claimed that China’s undervalued yuan hurt American manufacturing. Although China gradually allowed more flexibility in its exchange rate, tensions resurfaced during the Trump administration, when tariffs and currency rhetoric became central tools in the trade war.
3. The Economic Consequences of Currency Wars
While currency devaluation may offer short-term benefits, its long-term consequences are often counterproductive for both domestic and global economies.
3.1 Short-Term Gains
Boost in Exports:
A weaker currency makes exports more affordable in global markets, improving trade balances.
Inflation Control (in Deflationary Contexts):
Devaluation can prevent deflation by raising import prices, stimulating spending and investment.
3.2 Long-Term Costs
Imported Inflation:
Weaker currencies make imports more expensive, leading to rising prices for essential goods such as energy, food, and technology.
Erosion of Investor Confidence:
Persistent devaluation discourages foreign investment, as investors fear currency losses.
Retaliatory Policies:
Competing nations may also devalue their currencies, neutralizing any advantage and sparking global instability.
Debt Burden Escalation:
Countries with high levels of foreign-denominated debt face higher repayment costs when their currencies fall.
Global Imbalances:
Uncoordinated devaluations can distort trade flows and fuel protectionism, undermining international cooperation.
4. Modern Dynamics: Currency Wars in the Digital Era
In the 21st century, currency wars have become more complex, influenced by technological innovation, digital finance, and geopolitical realignments.
4.1 Central Bank Digital Currencies (CBDCs)
The rise of CBDCs — digital forms of fiat currency issued by central banks — could transform how nations compete monetarily. For instance, China’s digital yuan (e-CNY) aims to internationalize its currency and reduce dependence on the U.S. dollar-dominated SWIFT system. This digital shift introduces new dimensions of currency competition based on technological infrastructure and cross-border payment dominance.
4.2 Artificial Intelligence and Algorithmic Trading
AI-driven trading systems now play a significant role in foreign exchange markets, amplifying the speed and scale of currency adjustments. Automated capital flows can accelerate devaluations or appreciations beyond the control of policymakers, increasing market volatility.
4.3 The De-Dollarization Movement
Many emerging economies are actively seeking to reduce dependence on the U.S. dollar for international trade. BRICS nations — Brazil, Russia, India, China, and South Africa — have proposed alternative payment mechanisms and a potential shared currency. This shift poses a strategic challenge to U.S. monetary dominance and adds a new layer to currency competition.
4.4 Geopolitical Dimensions
Currency strategies increasingly intersect with geopolitics. Sanctions, trade restrictions, and financial exclusion (as seen with Russia post-Ukraine conflict) have turned monetary tools into instruments of geopolitical power. As countries seek to protect their financial sovereignty, competitive currency strategies are becoming more politically motivated.
5. Case Studies of Recent Currency Conflicts
5.1 Japan’s Abenomics (2013–2020)
Under former Prime Minister Shinzo Abe, Japan implemented aggressive monetary easing to fight deflation and revive growth. The Bank of Japan’s asset purchases significantly weakened the yen, boosting exports but drawing criticism from trade partners who viewed it as a form of currency manipulation.
5.2 U.S.–China Trade and Currency Tensions
In 2019, the U.S. Treasury officially labeled China a “currency manipulator” after the yuan fell past the symbolic 7-per-dollar level. Although the label was later removed, it highlighted the deep-rooted suspicions surrounding exchange rate practices and the link between trade policy and currency valuation.
5.3 Emerging Market Vulnerabilities
Countries like Argentina and Turkey have repeatedly used currency depreciation as a policy tool, often resulting in runaway inflation and capital flight. These cases illustrate how uncoordinated devaluations can spiral into economic crises if not supported by structural reforms.
6. Policy Responses and Global Coordination
To mitigate the risks of currency wars, international coordination is essential. Several mechanisms have evolved to maintain monetary stability:
International Monetary Fund (IMF):
The IMF monitors exchange rate policies and provides financial assistance to stabilize economies under currency pressure.
G7 and G20 Frameworks:
These platforms promote policy coordination among major economies to prevent destructive currency competition.
Regional Arrangements:
Asian and European monetary frameworks (like the European Monetary System) have been developed to ensure exchange rate stability within regions.
Transparency and Communication:
Clear communication from central banks regarding policy objectives can help reduce market misinterpretation and speculative attacks.
However, in practice, such coordination is often difficult to sustain, as nations prioritize domestic growth over global harmony.
7. The Future of Currency Wars
The future of competitive currency strategies will depend on several evolving trends:
Digitalization of Money:
CBDCs and blockchain-based financial systems could shift competitive dynamics from traditional exchange rate manipulation to digital payment dominance.
De-Dollarization and Multipolarity:
The gradual emergence of alternative global currencies — like the yuan, euro, and rupee — could weaken the dollar’s monopoly, creating a more fragmented but competitive global system.
Climate and Economic Resilience:
Currency policies may increasingly align with sustainability objectives, as nations consider the long-term environmental implications of growth-driven devaluations.
AI-Driven Monetary Forecasting:
Artificial intelligence may enable more precise, data-driven currency management — reducing human error but possibly intensifying algorithmic competition.
Conclusion
The competitive currency war embodies the tension between national economic goals and global financial stability. While currency devaluation can temporarily stimulate exports and growth, it often triggers retaliation, inflation, and uncertainty — eroding trust in international systems. History shows that no country truly “wins” a currency war; all participants eventually bear the costs through reduced global trade, volatility, and weakened economic cooperation.
In the modern era, with digital currencies, AI-driven finance, and shifting geopolitical alliances, currency competition is evolving beyond traditional devaluation. The challenge for policymakers lies in balancing national interest with collective responsibility. Only through transparent policies, cooperative frameworks, and digital innovation can the world avoid sliding into another era of destructive monetary rivalry.
De-Dollarization and the Emerging Global Currency WarIntroduction
For over seven decades, the U.S. dollar has been the backbone of the global financial system. It serves as the world’s dominant reserve currency, the primary medium of exchange in international trade, and the benchmark for commodities such as oil and gold. However, in recent years, a powerful shift has been gaining momentum—de-dollarization, a global trend in which nations seek to reduce their reliance on the U.S. dollar in favor of alternative currencies or mechanisms of trade. This movement is not merely economic; it carries profound geopolitical implications, signaling a potential currency war that could reshape the global monetary order.
De-dollarization has been driven by a combination of strategic, economic, and political motivations—ranging from the desire for financial sovereignty and protection from U.S. sanctions to the ambition of rising powers like China and Russia to challenge the dollar’s hegemony. As this shift accelerates, global markets, trade systems, and geopolitical alliances are being redefined.
Historical Background: How the Dollar Became Dominant
The dollar’s supremacy began after World War II, when the Bretton Woods Agreement (1944) established the U.S. dollar as the anchor of the international monetary system. Under this system, the dollar was pegged to gold at $35 per ounce, and other currencies were tied to the dollar. This arrangement created a foundation for global trade stability and positioned the U.S. as the world’s economic leader.
After the collapse of the Bretton Woods system in 1971, when President Richard Nixon ended the dollar’s convertibility to gold, the world transitioned to a fiat currency system. Despite this, the dollar retained its dominance due to several factors:
The U.S. economy’s size and stability.
The depth and liquidity of U.S. financial markets.
The role of the dollar in global trade, particularly in oil transactions (the "petrodollar system").
The trust in U.S. institutions and political stability.
These elements allowed the U.S. to maintain what many economists call an “exorbitant privilege”—the ability to print the world’s reserve currency, borrow cheaply, and influence global financial flows.
The Roots of De-Dollarization
The movement toward de-dollarization did not happen overnight. It is the result of cumulative tensions and global transformations over the past two decades. Several major developments have fueled this shift:
1. U.S. Sanctions and Financial Weaponization
The United States has frequently used its control over the global financial system as a tool of foreign policy. Countries like Russia, Iran, Venezuela, and China have faced economic sanctions that restrict their access to dollar-based systems such as SWIFT (the Society for Worldwide Interbank Financial Telecommunication). This has motivated these nations to develop alternative payment systems and trade arrangements that bypass the dollar.
2. The Rise of Multipolar Geopolitics
The post-Cold War era saw the U.S. as the sole superpower. However, the 21st century has ushered in a multipolar world, with China, Russia, India, and regional alliances (like BRICS and ASEAN) asserting greater influence. These nations aim to diversify their reserves and promote the use of their own currencies in international trade, challenging U.S. financial dominance.
3. The Decline of Trust in U.S. Fiscal Policy
Massive U.S. debt levels, persistent fiscal deficits, and the use of the dollar as a domestic political tool have raised concerns among global investors. The dollar’s long-term stability has been questioned as the U.S. continues to issue trillions in debt, leading to fears of inflation and currency depreciation.
4. Technological and Financial Innovations
The rise of digital currencies, blockchain technology, and central bank digital currencies (CBDCs) offers nations new tools to settle international transactions without relying on the U.S. dollar. China, for example, has launched the digital yuan (e-CNY), which could become a key instrument in cross-border trade within the Belt and Road Initiative.
Key Players in the De-Dollarization Movement
1. China
China is the leading force behind de-dollarization. Its goals are twofold: reduce dependence on the U.S. financial system and elevate the renminbi (yuan) as a global currency.
China has signed bilateral currency swap agreements with over 40 countries.
The Petro-yuan—China’s push to settle oil contracts in yuan—has gained traction, particularly with Russia, Iran, and Saudi Arabia.
The Belt and Road Initiative (BRI) also promotes trade in local currencies.
The launch of Cross-Border Interbank Payment System (CIPS) serves as an alternative to SWIFT.
2. Russia
Since facing Western sanctions after the annexation of Crimea in 2014—and more aggressively after the 2022 invasion of Ukraine—Russia has led efforts to abandon the dollar in trade and reserves.
Moscow now settles most of its energy exports with China and India in yuan, rubles, or rupees.
Russia’s central bank has drastically reduced its dollar holdings, replacing them with gold and Chinese currency.
The Kremlin has been actively promoting BRICS financial cooperation to build a non-dollar-based monetary framework.
3. BRICS Bloc
The BRICS alliance (Brazil, Russia, India, China, and South Africa)—expanded in 2024 to include nations like Saudi Arabia, Iran, and the UAE—is exploring the creation of a common reserve currency or digital settlement unit. This currency, backed by a basket of commodities or national currencies, could eventually rival the dollar in trade among emerging economies.
4. Middle East and Africa
Oil producers in the Gulf Cooperation Council (GCC), notably Saudi Arabia, have begun accepting non-dollar payments for oil exports. The Saudi-China oil settlement in yuan marks a historic break from the petrodollar era. Similarly, African nations are exploring local currency trade mechanisms to reduce dollar dependency.
Mechanisms of De-Dollarization
De-dollarization is taking place through multiple channels, including:
Bilateral trade settlements using local currencies (e.g., India-Russia trade in rupees and rubles).
Reserve diversification by central banks—reducing U.S. Treasury holdings and increasing gold or other currency reserves.
Alternative payment systems, such as China’s CIPS, Russia’s SPFS, and regional financial networks.
Commodity pricing reforms, particularly in energy markets, moving away from the dollar standard.
Use of CBDCs and digital assets for cross-border transactions.
The Emerging Currency War
The term “currency war” refers to the competition among nations to devalue or manipulate their currencies for trade advantages or to gain influence in global finance. In the modern context, it has evolved into a geostrategic battle for monetary dominance—a conflict over who controls the mechanisms of trade and capital flow.
1. U.S. Response
The U.S. continues to leverage its financial institutions, global alliances, and sanctions power to maintain dollar dominance. Washington’s focus remains on safeguarding the dollar’s role as the world’s reserve currency, but growing deficits and domestic political polarization may weaken its position.
2. China’s Monetary Strategy
China’s approach is subtle but strategic. It does not aim to immediately dethrone the dollar but rather build parallel systems that gradually erode the dollar’s centrality. Through regional trade blocs, the Asian Infrastructure Investment Bank (AIIB), and digital yuan experiments, Beijing is laying the groundwork for a multipolar financial order.
3. BRICS Common Currency Proposal
If BRICS successfully introduces a shared settlement currency, backed by commodities like gold or oil, it could serve as a credible alternative for trade among emerging markets. This would mark the first real institutional challenge to the dollar since the creation of the euro.
4. U.S.-China Economic Rivalry
The de-dollarization trend is tightly intertwined with the broader U.S.-China geopolitical rivalry. Both nations are competing for technological supremacy, trade dominance, and control over digital financial infrastructure. The outcome of this rivalry will likely define the contours of the 21st-century monetary order.
Economic Implications of De-Dollarization
1. For the United States
Reduced global demand for U.S. Treasuries could push up borrowing costs and weaken fiscal flexibility.
The loss of seigniorage benefits (profits from issuing currency used globally) would strain U.S. finances.
Dollar depreciation could occur if confidence erodes significantly.
However, the U.S. still maintains strong institutional and market trust, which makes a sudden collapse unlikely.
2. For Emerging Economies
De-dollarization could enhance monetary sovereignty and reduce vulnerability to U.S. interest rate policies.
It may stabilize trade between developing nations through local currency settlements.
However, the lack of liquidity and convertibility of alternative currencies poses short-term challenges.
Coordination issues among BRICS members could also limit effectiveness.
3. For Global Trade and Investment
A multipolar currency system could reduce systemic risk by diversifying reserve holdings.
It might complicate global transactions, as exchange rate volatility increases.
Gold and digital assets could become more prominent as neutral reserve assets.
The Role of Digital Currencies and Blockchain
Central bank digital currencies (CBDCs) represent the next frontier in the currency war.
China’s digital yuan has already been used in pilot cross-border settlements.
The BRICS Pay system aims to facilitate digital settlements without SWIFT.
The U.S. Federal Reserve is cautiously exploring a digital dollar, wary of losing financial privacy and control.
Blockchain-based payment networks could fundamentally alter international finance by reducing transaction costs, bypassing sanctions, and enhancing transparency.
Challenges and Limitations of De-Dollarization
While the movement is accelerating, full de-dollarization faces structural barriers:
The dollar still accounts for around 58–60% of global reserves (as of 2025).
Most global trade contracts and commodity pricing remain dollar-based.
Financial markets in other currencies lack the liquidity and trust of U.S. assets.
The network effect of the dollar—its widespread use reinforcing its dominance—is difficult to dismantle quickly.
Hence, while de-dollarization is real, it is more of a gradual rebalancing than an abrupt replacement.
Future Outlook
In the coming decade, the global monetary system is likely to evolve into a hybrid multipolar model rather than a unipolar one. The dollar will remain dominant but with reduced influence, sharing space with the yuan, euro, and possibly a BRICS-linked currency. The race will depend on:
The technological adoption of digital currencies,
The economic strength of emerging markets, and
The geopolitical realignments of global trade networks.
If current trends continue, by 2035, global reserves could become more evenly distributed among major currencies, diminishing U.S. leverage in economic diplomacy.
Conclusion
De-dollarization and the ensuing currency war represent one of the most significant shifts in global economics since the fall of Bretton Woods. The world is witnessing the gradual decline of U.S. monetary hegemony and the rise of a multipolar financial ecosystem. While the dollar’s dominance is unlikely to vanish overnight, its uncontested status is being eroded by strategic alliances, technological innovation, and geopolitical transformation.
Ultimately, the outcome will depend not only on economic policies but also on trust—the most valuable currency of all. Whether nations continue to trust the U.S. dollar or pivot toward a diversified basket of currencies will shape the architecture of the 21st-century global economy.

What is the CPI and how is it measuredUnderstanding the Consumer Price Index (CPI)
The Consumer Price Index (CPI) is one of the most important economic indicators used globally to measure inflation, the cost of living, and the general price level of goods and services over time. It serves as a key tool for policymakers, economists, researchers, businesses, and the public to understand how prices are changing and how those changes affect households and the economy.
In simple terms, the CPI measures the average change over time in the prices paid by consumers for a basket of goods and services. This basket represents typical consumption patterns of households and includes items such as food, clothing, housing, transportation, medical care, education, recreation, and other essentials. By tracking changes in the cost of this basket, the CPI gives an indication of how much prices have risen or fallen, which is crucial for assessing inflation and purchasing power.
Why CPI is Important
Indicator of Inflation:
Inflation reflects the rate at which the general level of prices for goods and services is rising. CPI is the most widely used measure of inflation because it directly reflects consumer experiences. Rising CPI indicates higher inflation, meaning the cost of living is increasing, while a falling CPI may suggest deflation.
Policy Formulation:
Governments and central banks, such as the Reserve Bank of India or the Federal Reserve in the U.S., rely on CPI to set monetary policy. For example, if CPI shows high inflation, a central bank may raise interest rates to reduce money supply and control inflation. Conversely, low CPI or deflation may prompt the central bank to lower interest rates.
Adjusting Income and Wages:
CPI is used to adjust wages, pensions, and social security payments to maintain purchasing power. For instance, if inflation is 5%, wages might be increased by a similar percentage to ensure that people can maintain their standard of living.
Economic Analysis:
Economists use CPI to compare price levels over time, analyze trends in consumer spending, and study the health of the economy. It is also used to deflate nominal values in economic statistics, such as GDP, to account for the effect of price changes.
How CPI is Measured
The process of measuring CPI is rigorous and involves several steps. Although methodologies may vary slightly from country to country, the core principles remain consistent.
Step 1: Defining the Basket of Goods and Services
The first step in calculating CPI is to determine what goods and services are included. These items are selected based on household consumption patterns, which are determined through surveys such as the Consumer Expenditure Survey (CES). These surveys collect data on how households spend their income across different categories.
The basket typically includes categories like:
Food and beverages: Rice, wheat, fruits, vegetables, dairy products, meat, beverages.
Housing: Rent, utilities, maintenance.
Clothing and footwear: Apparel for men, women, and children.
Transportation: Public transport, fuel, vehicles.
Healthcare: Medicines, medical services, hospital charges.
Education: School fees, books, and supplies.
Recreation and entertainment: Movies, hobbies, sporting activities.
Miscellaneous goods and services: Personal care, insurance, and other everyday expenses.
Each item in the basket is assigned a weight that represents its relative importance in household expenditure. For example, in countries where households spend a significant portion of income on food, the weight of food in the CPI basket will be higher. These weights are essential because they ensure that changes in prices of commonly purchased items have a bigger impact on the CPI than items that are rarely bought.
Step 2: Collecting Price Data
Once the basket is defined, the next step is to collect price data. Prices are collected periodically (usually monthly) from a range of retail outlets, service providers, online platforms, and markets to reflect real consumer spending. Data collectors ensure the information represents different regions, urban and rural areas, and various types of stores.
Price collection is meticulous and considers factors such as:
Product quality and specifications: Prices for the same product should be comparable over time.
Availability: Prices are collected from multiple sources to account for variation.
Regional differences: CPI may include regional price indices if consumption patterns differ widely between areas.
Types of CPI
Many countries compute multiple types of CPI to cater to different analytical purposes:
CPI for All Urban Consumers (CPI-U): Measures prices for urban households.
CPI for Rural Consumers (CPI-R): Measures prices in rural areas.
Core CPI: Excludes volatile items such as food and energy to give a clearer picture of underlying inflation trends.
CPI-W: For wage earners, often used to adjust social security benefits.
Each type helps policymakers understand how inflation affects different groups in society.
Challenges in Measuring CPI
While CPI is widely used, it is not without challenges:
Substitution Bias: Consumers may switch to cheaper alternatives when prices rise, but traditional CPI assumes a fixed basket.
Quality Changes: Improvements or deterioration in product quality can affect prices but are difficult to adjust for accurately.
New Products: Rapid technological changes introduce new goods that may not be immediately included in the CPI basket.
Regional Differences: Prices can vary widely across regions, making national CPI an approximation.
Housing Costs: Different methods, such as rent or owner-equivalent rent, can influence CPI calculations.
Applications of CPI
Economic Policy: Governments monitor CPI for monetary and fiscal decisions.
Cost-of-Living Adjustments (COLAs): CPI ensures wages, pensions, and contracts keep up with inflation.
Business Decisions: Companies use CPI trends for pricing strategies, forecasting, and budgeting.
Investments: Investors analyze CPI to make decisions on stocks, bonds, and commodities, as inflation affects returns.
Conclusion
The Consumer Price Index is a critical economic tool that quantifies changes in the cost of living and provides a window into the inflationary trends of an economy. Its meticulous calculation—from selecting a representative basket of goods to weighting, pricing, and aggregation—ensures that it reflects the everyday experiences of consumers. While it has limitations, CPI remains essential for policymakers, businesses, researchers, and households to make informed decisions, maintain purchasing power, and understand the dynamics of an economy.
By understanding CPI, one can not only track the rise or fall in prices but also comprehend broader economic trends, making it a foundational concept in economics and personal finance.
Global Commodity Trends: An In-Depth Analysis1. Overview of Commodity Categories
Commodities can broadly be categorized into three segments:
Energy Commodities – including crude oil, natural gas, coal, and renewable energy components.
Metal Commodities – comprising precious metals (gold, silver, platinum) and industrial metals (copper, aluminum, nickel, lithium).
Agricultural Commodities – such as grains, oilseeds, coffee, cotton, and sugar.
Each sector operates under different economic drivers but shares common threads: cyclical demand, global trade dependency, and vulnerability to geopolitical and climatic disruptions.
2. Energy Commodities: Shifting Power Dynamics
Oil Market Evolution
Crude oil remains the most influential commodity, dictating the rhythm of the global economy. After years of volatility, oil prices in 2025 have stabilized between $75–$90 per barrel, balancing between OPEC+ production controls and demand recovery in post-pandemic industrial economies. Key trends influencing the oil market include:
Geopolitical Tensions: Conflicts in the Middle East, Russia-Ukraine tensions, and sanctions have repeatedly disrupted supply routes and reshaped trade alliances.
Energy Transition: Many nations are reducing fossil fuel dependence, creating dual effects—investment withdrawal from oil projects and short-term supply tightness.
US Shale Resurgence: Technological improvements have revived U.S. shale production, moderating price spikes and diversifying global supply sources.
Natural Gas and LNG Boom
The liquefied natural gas (LNG) market has become a critical player in global energy security. Europe’s pivot away from Russian pipeline gas has spurred demand for LNG imports from the U.S., Qatar, and Australia. Asian markets—particularly India, Japan, and South Korea—are also expanding their LNG infrastructure. Prices remain elevated due to limited shipping capacity and long-term contract negotiations.
Renewable Commodities
The renewable sector is emerging as a commodity class of its own. Materials essential for wind turbines, solar panels, and batteries—like lithium, cobalt, and rare earth elements—are now strategically significant. Nations rich in these resources, such as Chile (lithium), the Democratic Republic of Congo (cobalt), and China (rare earths), have gained economic leverage in the green transition era.
3. Metal Commodities: Industrial and Technological Backbone
Copper: The ‘New Oil’ of Electrification
Copper is a vital indicator of global industrial health and the clean energy revolution. With rising demand from electric vehicles (EVs), grid expansion, and renewable infrastructure, copper prices have remained strong, hovering near $9,000–$10,000 per metric ton in 2025. However, supply shortages from major producers like Chile and Peru continue to pressure the market. Technological exploration and recycling have become key to meeting demand sustainably.
Aluminum and Steel: Industrial Expansion
Global infrastructure projects—particularly in India, Southeast Asia, and Africa—have driven demand for aluminum and steel. China’s gradual construction slowdown has been offset by growth in emerging markets. Decarbonization efforts have also led to “green steel” innovations, with major producers investing in hydrogen-based smelting technologies.
Precious Metals: Inflation Hedges
Gold remains a preferred hedge against inflation, currency devaluation, and financial instability. In 2025, gold prices are resilient around $2,100 per ounce, supported by central bank purchases and investor uncertainty about global debt sustainability. Silver, platinum, and palladium also benefit from industrial use in electronics, solar energy, and automotive catalysis.
Critical Minerals and Rare Earths
The rise of electric mobility and digital technologies has made critical minerals central to geopolitical competition. Nations are now securing mineral supply chains to reduce dependence on single-country producers. The U.S. and EU have launched strategic mineral alliances to diversify sourcing and encourage domestic mining.
4. Agricultural Commodities: Weather, Demand, and Technology
Food Security Challenges
Global food prices have experienced volatility due to extreme weather, conflict disruptions, and changing consumption patterns. Droughts in key grain-producing regions (such as North America and Australia) have tightened wheat and corn supplies, while El Niño weather patterns have affected rice production in Asia.
Grains and Oilseeds
Wheat and Corn: Prices remain firm as global demand for animal feed and biofuels continues to grow.
Soybeans: Driven by rising protein consumption in developing economies and biofuel production in the U.S. and Brazil, soybean demand remains robust.
Rice: Export restrictions by major producers like India in 2024–25 have kept rice prices elevated, intensifying food inflation pressures in Africa and Asia.
Soft Commodities: Coffee, Cocoa, and Cotton
Coffee and cocoa markets face supply disruptions due to unpredictable weather and labor shortages. Meanwhile, cotton prices have stabilized as global textile demand recovers post-pandemic. However, sustainability standards and organic production are reshaping trade patterns, with premium pricing for ethically sourced materials.
Technological Innovation in Agriculture
Precision farming, AI-driven weather forecasting, and genetically resilient crops are transforming agricultural productivity. These innovations aim to balance yield improvements with sustainability and environmental preservation, reducing the carbon footprint of global agriculture.
5. Geopolitical and Economic Influences
Global commodity trends are closely tied to geopolitics and macroeconomics. Several key developments have reshaped the landscape:
Trade Wars and Sanctions: The U.S.–China trade rivalry and sanctions on Russia and Iran have disrupted traditional commodity flows, leading to new alliances among BRICS nations.
Currency Movements: A strong U.S. dollar often suppresses commodity prices by making them costlier for non-dollar economies. However, increasing talk of “de-dollarization” could redefine commodity pricing in the long term.
Global Inflation and Interest Rates: Higher interest rates have tempered speculative investments in commodities, yet inflationary pressures from supply chain disruptions continue to sustain price floors.
Environmental Regulations: Climate policies and carbon taxes are influencing production costs and trade competitiveness, particularly in energy and metals sectors.
6. Technological and Structural Shifts
Digitalization and Smart Commodities
Blockchain and AI technologies are revolutionizing commodity trading systems. Digital platforms now enable transparent pricing, efficient logistics, and reduced transaction costs. Smart contracts in blockchain-based trade reduce fraud and enhance traceability from mines to markets.
Green Commodities and ESG Investments
Investors increasingly favor environmentally and socially responsible commodities. ESG (Environmental, Social, and Governance) frameworks are pushing companies to disclose emissions data, human rights practices, and sustainability metrics. This shift is influencing how commodity-backed financial instruments are structured and traded.
Automation in Mining and Logistics
Robotics, automation, and remote monitoring have transformed mining and shipping operations, reducing costs and improving safety. Autonomous drilling and AI-based maintenance systems enhance operational efficiency across industries dependent on raw materials.
7. Regional Insights
Asia-Pacific
Asia remains the largest consumer of commodities, with China and India leading demand for energy, metals, and food. India’s industrial expansion and renewable energy programs are reshaping regional trade flows. Southeast Asian nations are emerging as key exporters of palm oil, rubber, and rare earths.
North America
The U.S. and Canada benefit from abundant energy and agricultural resources. The shale industry revival and strategic mineral exploration position North America as a stable supplier amidst global uncertainty.
Europe
Europe’s energy diversification post-Ukraine war has accelerated investment in renewables, hydrogen, and circular economy practices. High carbon pricing has also made European industries more sustainable but less cost-competitive globally.
Africa and Latin America
These regions are rich in untapped resources, from lithium in Chile and Argentina to cobalt in the DRC and oil in Nigeria. However, political instability and infrastructure challenges hinder full potential. Strategic partnerships with China and Western investors aim to modernize extraction and processing industries.
8. Challenges Ahead
Despite progress, several structural challenges persist in global commodity markets:
Supply Chain Fragmentation: Geopolitical rivalries threaten trade connectivity.
Climate Risks: Extreme weather events continue to impact yields, mining operations, and energy supply.
Resource Nationalism: Governments are asserting greater control over natural resources, imposing export restrictions or windfall taxes.
Market Volatility: Speculative trading and financial derivatives amplify short-term price fluctuations, complicating investment planning.
Sustainability Pressure: Transitioning to low-carbon operations requires significant capital and policy alignment across nations.
9. The Future of Commodity Markets
Looking ahead to 2030 and beyond, the global commodity landscape is expected to be shaped by four major forces:
Energy Transition Acceleration: The world will see greater integration of renewables, hydrogen, and energy storage, reducing fossil fuel dependency but increasing demand for critical minerals.
Technological Integration: AI, blockchain, and predictive analytics will dominate commodity trading, making markets more transparent and efficient.
Sustainable Agriculture: Climate-resilient crops and smart irrigation will redefine global food systems.
Geopolitical Realignment: Multipolar trade networks among BRICS+ nations will challenge traditional commodity pricing systems dominated by Western economies.
Conclusion
Global commodity trends in 2025 reveal a dynamic interplay of energy transformation, technological evolution, and geopolitical recalibration. While oil and gas remain vital to short-term stability, the long-term trajectory points toward green minerals, digital commodities, and sustainable agriculture. The world is navigating a complex transition where supply chains, trade policies, and investment strategies must adapt to environmental and political realities. In essence, commodities have evolved from mere tradable goods into strategic instruments of power, policy, and progress. Managing this transformation with foresight, equity, and sustainability will define the resilience of the global economy in the years ahead.
Climate Change Impact on the Global MarketIntroduction
Climate change has emerged as one of the most pressing challenges of the 21st century, with consequences extending far beyond environmental degradation. It is reshaping the global economy, altering trade patterns, influencing investment flows, and redefining business strategies across industries. The rise in global temperatures, frequent natural disasters, and shifts in weather patterns have disrupted supply chains, reduced agricultural productivity, and challenged energy security. Consequently, climate change has become both a financial risk and an opportunity for innovation and sustainability in the global market.
This essay explores the multi-dimensional impact of climate change on the global market, analyzing its effects on various sectors, trade, finance, labor, and investment, while also addressing how governments and corporations are adapting to these transformations.
1. Economic Disruptions and Market Volatility
One of the most immediate effects of climate change on the global market is economic instability. Extreme weather events such as hurricanes, floods, droughts, and wildfires cause billions of dollars in damages annually. According to data from the World Bank, climate-related disasters have caused global economic losses exceeding $250 billion per year in recent years.
For example, the 2020 wildfires in Australia and California led to massive insurance claims, destroyed infrastructure, and disrupted business operations. Similarly, floods in South Asia and droughts in Africa have crippled agricultural production, leading to food shortages and price volatility in global commodity markets.
Climate-related disruptions increase market uncertainty, discouraging long-term investments and affecting stock market performance. Investors now monitor environmental risks as part of Environmental, Social, and Governance (ESG) criteria, integrating sustainability factors into financial decisions. As climate risks intensify, economies reliant on fossil fuels or resource-heavy industries face growing pressure, while green sectors gain prominence.
2. Agriculture and Food Supply Chains
Agriculture is one of the most climate-sensitive sectors in the world economy. Rising temperatures, unpredictable rainfall, and soil degradation have significantly affected crop yields. The Intergovernmental Panel on Climate Change (IPCC) estimates that global crop yields for staple foods such as wheat, rice, and maize could decline by 10–25% by 2050 if current trends persist.
These changes influence global trade and food prices. Developing countries—especially in Africa, South Asia, and Latin America—are most vulnerable because their economies depend heavily on agriculture. Declining productivity affects exports, rural incomes, and food security, which in turn increases social unrest and migration pressures.
Meanwhile, developed nations face challenges related to food imports, quality control, and supply chain resilience. The shift in agricultural zones—such as wine production moving from southern to northern Europe—reflects how industries are adapting to new climatic realities. However, such transitions require significant capital and time.
3. Energy Markets and the Green Transition
The energy sector lies at the core of the climate–market relationship. Fossil fuels—oil, coal, and natural gas—have powered industrial growth for centuries but are now under scrutiny as major contributors to greenhouse gas emissions. As governments introduce carbon pricing, emission taxes, and renewable energy incentives, the global energy market is undergoing a structural transformation.
Countries are diversifying their energy portfolios by investing in solar, wind, hydro, and hydrogen technologies. The shift toward renewable energy is not only environmental but also strategic—reducing dependency on volatile fossil fuel markets. For instance, Europe’s transition to renewable energy accelerated after geopolitical disruptions such as the Russia-Ukraine conflict, highlighting how climate and politics intertwine.
However, this transition poses short-term challenges. Traditional energy sectors face stranded assets, where fossil fuel reserves lose value due to policy changes or technological advancements. Oil-dependent economies, such as those in the Middle East, must restructure their markets to remain competitive in a decarbonizing world.
On the other hand, the green energy market—including electric vehicles (EVs), battery storage, and carbon capture technologies—is rapidly expanding. BloombergNEF projects that global investment in clean energy could exceed $2 trillion annually by 2030, creating new jobs, industries, and trade patterns.
4. Trade and Global Supply Chains
Global trade networks are increasingly vulnerable to climate disruptions. Ports, transportation systems, and production hubs located in climate-sensitive regions face heightened risk. For example, rising sea levels threaten major coastal cities like Shanghai, Mumbai, and New York—key centers for global commerce.
Climate change affects logistics and insurance costs, as companies must adapt to new shipping routes or build resilient infrastructure. The 2021 Suez Canal blockage demonstrated how even temporary disruptions can ripple through global markets; climate-induced events could have far greater and longer-lasting effects.
Moreover, international trade policies are evolving to incorporate climate considerations. The European Union’s Carbon Border Adjustment Mechanism (CBAM), for instance, imposes tariffs on imports from countries with lax emission standards. This marks the beginning of carbon-based trade regulation, which will influence global competitiveness.
Developing economies may find it harder to compete if they lack the resources to implement green technologies, deepening economic inequality. However, climate-smart trade strategies—such as investing in sustainable manufacturing and regional cooperation—can offer resilience and growth opportunities.
5. Financial Markets and Investment Trends
Climate change has redefined the way financial markets operate. Investors, regulators, and institutions now view climate risk as financial risk. The rise of green finance, carbon markets, and ESG investing reflects the growing integration of environmental factors into financial decision-making.
Central banks, including the Bank of England and the European Central Bank, have begun incorporating climate stress tests into financial stability assessments. Insurers, too, are recalibrating models to account for climate-related losses, which affect premiums and underwriting practices.
The carbon credit market—where companies trade emission allowances—has become a multibillion-dollar sector, incentivizing corporations to reduce emissions. Similarly, green bonds and sustainability-linked loans finance projects related to renewable energy, conservation, and clean technology.
However, climate-related financial transitions also bring risks. For instance, the reallocation of capital from high-emission industries to sustainable alternatives can cause asset devaluation and job losses in traditional sectors. Policymakers must manage this transition carefully to avoid financial instability while ensuring a just and equitable shift.
6. Corporate Strategy and Innovation
Corporations are increasingly recognizing that climate resilience is essential for long-term profitability. Leading companies across industries are adopting sustainability strategies, investing in renewable energy, and rethinking production models to minimize environmental impact.
The rise of the circular economy—where materials are reused, recycled, or repurposed—represents a major shift in business philosophy. Companies like Apple, Unilever, and Tesla are pioneering sustainable practices, from sourcing ethical materials to reducing waste and emissions.
Climate change is also driving technological innovation. Advances in artificial intelligence (AI), big data, and remote sensing allow businesses to predict weather risks, optimize supply chains, and monitor emissions in real time. Green innovation is no longer a niche pursuit but a competitive necessity.
Moreover, corporate accountability is growing. Investors and consumers are demanding transparency in sustainability reporting, forcing firms to disclose environmental footprints under frameworks such as the Task Force on Climate-related Financial Disclosures (TCFD).
7. Labor Markets and Employment Shifts
Climate change affects global labor markets both directly and indirectly. On one hand, extreme heat and natural disasters threaten workers’ safety and productivity, particularly in agriculture, construction, and manufacturing. On the other hand, the green economy is generating millions of new jobs in renewable energy, waste management, and sustainable infrastructure.
According to the International Labour Organization (ILO), the green transition could create over 24 million new jobs globally by 2030, offsetting losses in fossil-fuel sectors. However, this shift demands reskilling and education programs to prepare workers for emerging industries.
Regions that depend heavily on carbon-intensive industries face structural unemployment if transitions are not managed fairly. Therefore, the concept of a “just transition”—ensuring social protection and equal opportunities—is becoming a key part of global climate policy.
8. Regional and Sectoral Disparities
The economic impacts of climate change are not evenly distributed. Developing nations in tropical and coastal areas bear the brunt of physical climate risks but often lack financial resources to adapt. In contrast, developed economies have better infrastructure, insurance systems, and technological capacity to mitigate damage.
Sectors such as tourism, agriculture, and fisheries are among the most affected. For example, coral reef degradation and rising sea levels threaten tourism industries in the Caribbean and Southeast Asia. Meanwhile, melting Arctic ice opens new shipping routes, benefiting some countries but raising geopolitical tensions.
Global inequality may deepen as climate change alters comparative advantages. Wealthy nations with access to advanced technology may gain from green innovation, while poor nations face resource scarcity, migration crises, and declining trade competitiveness.
9. Policy Responses and Global Cooperation
Governments and international institutions are increasingly aware that climate change is not just an environmental issue but a profound economic one. Agreements such as the Paris Climate Accord aim to limit global warming to 1.5°C by encouraging emission reduction targets (NDCs) and promoting sustainable development.
Carbon pricing mechanisms—like taxes and cap-and-trade systems—are being adopted worldwide to internalize the environmental cost of emissions. Public investments in clean energy, green infrastructure, and climate adaptation are reshaping fiscal priorities.
Multilateral organizations, including the World Bank, IMF, and UNEP, are developing climate finance initiatives to help vulnerable nations transition sustainably. However, the success of these programs depends on global cooperation, political will, and equitable access to resources.
10. Future Outlook: Risks and Opportunities
The coming decades will determine how the global market adapts to climate change. The risks—ranging from financial instability to resource conflicts—are significant. Yet, the opportunities for innovation, sustainable growth, and technological advancement are equally vast.
The global green economy could become the defining growth engine of the 21st century. Countries that invest early in renewable energy, circular production, and low-carbon technologies are likely to dominate future markets. Businesses that fail to adapt may face obsolescence as consumers and regulators favor sustainable alternatives.
In essence, climate change is transforming capitalism itself—from a model based on extraction and expansion to one grounded in resilience and regeneration.
Conclusion
Climate change is no longer a distant environmental concern; it is a present and pervasive economic force reshaping the global market. From agriculture to finance, from trade to technology, every sector is being redefined by the realities of a warming planet. The challenges are immense, but so are the opportunities for reinvention.
The global market’s response to climate change will determine not only economic prosperity but also the survival of ecosystems and future generations. Sustainable development, green innovation, and collective action are the cornerstones of a resilient economic future. The sooner markets internalize the true cost of carbon and embrace climate responsibility, the more stable and prosperous the world economy will become.
The Global Economy at Risk1. Introduction: The Fragility of Global Interdependence
Over the past century, the world has become deeply interconnected through trade, finance, technology, and communication. This interdependence has created both prosperity and vulnerability. A crisis in one part of the world can ripple across continents—affecting supply chains, financial systems, and consumer confidence. The 2008 global financial crisis was an early warning of how fragile the system can be when risks are underestimated. Today, new forms of instability—ranging from digital threats to ecological collapse—pose equally severe challenges.
Globalization has lifted millions out of poverty, but it has also intensified inequality and exposed economies to shared shocks. As countries rely on complex supply chains, international capital, and energy networks, the balance between efficiency and resilience becomes critical. The current era demands a reassessment of how global systems are designed to handle stress, volatility, and systemic disruption.
2. Geopolitical Tensions and Fragmentation
One of the most significant risks to the global economy arises from escalating geopolitical rivalries. The rivalry between the United States and China has reshaped trade, technology, and investment patterns. Trade wars, sanctions, and export restrictions have disrupted global supply chains, particularly in industries such as semiconductors, green technology, and artificial intelligence. Economic decoupling threatens to divide the world into competing blocs, undermining decades of progress in global integration.
Additionally, regional conflicts such as the war in Ukraine and tensions in the Middle East have impacted global energy and food prices. Sanctions on Russia, disruptions in grain exports, and volatility in oil and gas markets have intensified inflationary pressures worldwide. In Asia, disputes over Taiwan and the South China Sea create further uncertainty for global trade routes and security alliances.
As nationalism and protectionism rise, the principles of free trade and multilateral cooperation weaken. The World Trade Organization (WTO), International Monetary Fund (IMF), and United Nations face challenges in enforcing rules and mediating disputes. The fragmentation of global governance could lead to economic inefficiency, duplication of efforts, and reduced collaboration in addressing shared problems like climate change or pandemics.
3. Climate Change and Environmental Instability
Climate change poses perhaps the most profound long-term risk to the global economy. Extreme weather events—such as droughts, floods, wildfires, and hurricanes—are becoming more frequent and severe. These disasters disrupt agriculture, damage infrastructure, and displace populations. For instance, droughts in Africa and Asia threaten food security, while floods in Europe and North America cause billions in losses annually.
Rising sea levels endanger coastal cities, which are home to a significant portion of the global population and economic output. The transition to a low-carbon economy is essential, yet costly. Industries reliant on fossil fuels face structural decline, while renewable energy sectors require massive investment in technology, grid infrastructure, and workforce reskilling.
Climate change also exacerbates inequality. Developing countries, which contribute the least to greenhouse gas emissions, suffer the greatest consequences. The resulting economic disparities can trigger migration, social unrest, and political instability, creating feedback loops that further strain global growth. The World Bank estimates that climate-related disruptions could push an additional 130 million people into poverty by 2030 if unaddressed.
4. Inflation, Debt, and Financial Instability
Global financial systems are also under pressure from inflationary trends and mounting debt. The COVID-19 pandemic forced governments worldwide to implement massive fiscal stimulus measures. While these interventions prevented deeper recessions, they also inflated public debt to record levels. As central banks raised interest rates to combat inflation, borrowing costs surged, threatening the stability of emerging markets and highly leveraged corporations.
The global debt-to-GDP ratio now exceeds 330%, according to the Institute of International Finance. High debt levels constrain fiscal flexibility, limiting governments’ ability to respond to future crises. Simultaneously, high interest rates risk triggering defaults, especially in developing economies reliant on foreign capital.
Inflation remains persistent due to disrupted supply chains, energy price volatility, and labor shortages. Central banks walk a tightrope between curbing inflation and maintaining growth. Overly aggressive tightening could lead to recessions, while inaction risks currency devaluation and loss of investor confidence. Financial markets, therefore, remain on edge, with the possibility of another debt crisis looming.
5. Technological Disruption and Cybersecurity Risks
Technological innovation drives modern growth, yet it also introduces systemic vulnerabilities. Artificial intelligence (AI), automation, and digitalization transform industries, enhance efficiency, and create new opportunities. However, they also displace workers, intensify inequality, and increase cyber risks.
The rise of AI-driven decision-making in finance, logistics, and manufacturing can lead to algorithmic errors or systemic failures if not properly regulated. Meanwhile, cyberattacks on critical infrastructure—such as banking systems, energy grids, and government networks—pose growing threats. The digital economy’s dependence on data and connectivity means that a single cyber incident can have global repercussions.
Moreover, technological dominance is increasingly politicized. Nations compete for supremacy in semiconductors, quantum computing, and AI, leading to technology bans, export controls, and espionage allegations. This “tech war” between major powers could slow innovation, fragment digital ecosystems, and hinder global collaboration on emerging technologies.
6. Inequality and Social Unrest
Economic inequality, both within and between nations, continues to rise. The benefits of globalization and technological progress have disproportionately favored capital owners and skilled workers, leaving large segments of society behind. This growing divide fuels political polarization, populism, and distrust in institutions.
In developing nations, limited access to healthcare, education, and financial systems constrains social mobility. Meanwhile, automation threatens low-skilled jobs in manufacturing and services, increasing unemployment risk. Social discontent often manifests as protests, strikes, or political instability—conditions that undermine investor confidence and disrupt economic activity.
The COVID-19 pandemic further exposed inequality, as wealthier nations secured vaccines and recovery funds while poorer ones lagged behind. As inequality widens, governments face pressure to expand welfare spending, increase taxation on the wealthy, and regulate corporations more strictly—potentially reshaping global capitalism itself.
7. Energy Transition and Resource Scarcity
The global shift from fossil fuels to renewable energy represents both a challenge and an opportunity. While the transition is necessary to combat climate change, it disrupts traditional industries and geopolitical alliances. Oil-dependent economies face declining revenues, while countries rich in critical minerals—like lithium, cobalt, and nickel—gain strategic importance.
However, the demand for these minerals creates new dependencies and supply risks. Mining operations in unstable regions can lead to environmental degradation and labor exploitation. Additionally, the race for green technology dominance—particularly in electric vehicles and battery production—intensifies global competition.
Energy security has re-emerged as a central concern. Europe’s reliance on Russian gas, exposed during the Ukraine conflict, highlighted the vulnerabilities of over-dependence on single suppliers. Future energy systems must balance sustainability, affordability, and security—a complex equation that requires international cooperation and innovation.
8. Global Trade and Supply Chain Vulnerabilities
The COVID-19 pandemic revealed how fragile global supply chains can be. Lockdowns, labor shortages, and transportation bottlenecks led to delays, price hikes, and product shortages across industries. Although supply chains have since improved, the experience has prompted many firms to adopt “de-risking” strategies—relocating production closer to home or diversifying suppliers.
However, reshoring and regionalization could reduce efficiency and raise costs, contributing to inflationary pressures. The challenge lies in creating supply networks that are both resilient and cost-effective. Trade policies must adapt to a world where security and reliability take precedence over pure economic efficiency.
Digital trade, e-commerce, and logistics technologies offer potential solutions, but they require harmonized regulations and robust cybersecurity. Without coordinated policies, supply chain disruptions may continue to threaten global growth.
9. Demographic Shifts and Labor Market Challenges
Demographic trends are reshaping the global workforce. Advanced economies like Japan, Germany, and South Korea face aging populations, shrinking labor forces, and rising healthcare costs. Conversely, developing regions such as Africa and South Asia experience youth bulges, creating pressure for job creation and education reform.
Migration could theoretically balance these disparities, but political resistance to immigration remains high in many developed nations. As populations age, pension systems and social services become strained, potentially leading to fiscal crises and slower growth.
Automation and AI may help offset labor shortages, but they also risk widening inequality if new technologies are not matched by investments in skill development. The future of work will depend on education systems that prepare workers for digital, green, and service-oriented economies.
10. Conclusion: Building Resilience in a Risk-Laden World
The global economy stands at a pivotal moment—defined by opportunity yet shadowed by risk. Geopolitical fragmentation, climate change, financial instability, technological disruption, and social inequality collectively challenge the very foundation of globalization. The interconnectedness that once powered global growth now exposes nations to shared vulnerabilities.
To navigate these risks, the world must prioritize resilience over efficiency, cooperation over competition, and sustainability over short-term profit. Strengthening multilateral institutions, reforming financial systems, and investing in renewable energy and human capital are essential steps. Global leaders must also embrace technological innovation responsibly, ensuring that its benefits are widely distributed.
In an age of uncertainty, adaptability becomes the cornerstone of survival. The future of the global economy depends not only on economic policy but on collective wisdom—an acknowledgment that in a deeply connected world, no nation can thrive alone. By confronting risks with foresight and unity, humanity can transform today’s threats into the foundation of a more stable, equitable, and sustainable global future.

Central Bank Digital Currencies (CBDCs)Introduction
In recent years, Central Bank Digital Currencies (CBDCs) have emerged as a transformative force in the global financial landscape. These digital currencies, issued and regulated by central banks, represent a significant evolution from traditional physical currencies. Unlike cryptocurrencies, which operate on decentralized networks, CBDCs are centralized and aim to combine the benefits of digital innovation with the stability of government-backed money. This essay delves into the role of CBDCs in the world market trading system, exploring their types, functionalities, advantages, challenges, and their potential to reshape global trade and finance.
Understanding CBDCs
CBDCs are digital forms of a country's fiat currency, issued and regulated by its central bank. They are designed to coexist with physical cash and are fully backed by the central bank, ensuring their value and stability. There are two primary types of CBDCs:
Retail CBDCs: These are intended for use by the general public, functioning similarly to physical cash but in a digital format. They aim to provide a secure, efficient, and inclusive means of payment for everyday transactions.
Wholesale CBDCs: These are designed for use by financial institutions for interbank settlements and large-value transactions. They facilitate faster, more secure, and cost-effective cross-border payments and capital market operations.
The Role of CBDCs in Global Trade
CBDCs have the potential to revolutionize the global trading system in several key ways:
Enhancing Payment Efficiency: Traditional cross-border payments often involve multiple intermediaries, leading to delays, high costs, and increased risk. CBDCs can streamline these processes by enabling direct transactions between parties, reducing the need for intermediaries and thus lowering transaction costs and time.
Improving Financial Inclusion: By providing a digital form of central bank money, CBDCs can offer unbanked and underbanked populations access to secure and efficient financial services, fostering greater financial inclusion globally.
Strengthening Monetary Policy Implementation: CBDCs provide central banks with a new tool to implement monetary policy more effectively. They can offer real-time data on economic activity and enable more precise control over money supply and interest rates.
Facilitating Cross-Border Trade: Wholesale CBDCs can simplify and expedite cross-border trade by reducing currency conversion costs, mitigating exchange rate risks, and enhancing the transparency and security of international transactions.
Advantages of CBDCs
The adoption of CBDCs offers several advantages:
Security and Trust: As government-backed digital currencies, CBDCs offer a high level of security and trust, reducing the risks associated with private digital currencies.
Cost Reduction: By eliminating intermediaries and streamlining payment processes, CBDCs can significantly reduce transaction costs.
Speed and Efficiency: CBDCs can facilitate near-instantaneous transactions, enhancing the speed and efficiency of financial operations.
Transparency and Traceability: The digital nature of CBDCs allows for enhanced transparency and traceability of transactions, aiding in the fight against money laundering and other illicit activities.
Challenges and Considerations
Despite their potential, the implementation of CBDCs presents several challenges:
Privacy Concerns: The digital nature of CBDCs raises concerns about user privacy and data security. Striking a balance between transparency and privacy is crucial.
Cybersecurity Risks: As digital assets, CBDCs are susceptible to cyberattacks and require robust security measures to protect against potential threats.
Regulatory and Legal Issues: The introduction of CBDCs necessitates comprehensive regulatory frameworks to address issues related to legal tender, cross-border transactions, and financial stability.
Technological Infrastructure: Developing and maintaining the technological infrastructure for CBDCs requires significant investment and expertise.
Market Disruption: The introduction of CBDCs could disrupt existing financial systems and markets, necessitating careful planning and coordination to mitigate potential negative impacts.
Global Initiatives and Developments
Numerous countries are exploring or piloting CBDCs:
China: The People's Bank of China has been at the forefront, launching the digital yuan (e-CNY) and conducting extensive pilot programs across various cities.
European Union: The European Central Bank is exploring the digital euro, focusing on enhancing payment efficiency and financial inclusion within the Eurozone.
United States: The Federal Reserve is researching the potential benefits and risks of a digital dollar, with ongoing studies and consultations.
India: The Reserve Bank of India has initiated pilot projects for the digital rupee, aiming to modernize the payment infrastructure and enhance financial inclusion.
These initiatives reflect a global recognition of the potential benefits of CBDCs and a concerted effort to integrate them into the existing financial ecosystem.
Impact on Global Financial Markets
The integration of CBDCs into global financial markets could have profound effects:
Market Liquidity: CBDCs can enhance market liquidity by providing a new form of central bank money that can be easily traded and settled.
Capital Flows: The ease of cross-border transactions facilitated by CBDCs can lead to more efficient capital flows, potentially altering investment patterns and global financial dynamics.
Currency Competition: The widespread adoption of CBDCs could lead to increased competition among currencies, influencing exchange rates and monetary policies.
Financial Stability: While CBDCs can enhance financial stability by providing a secure and efficient means of payment, they also introduce new risks that need to be carefully managed.
Conclusion
Central Bank Digital Currencies represent a significant advancement in the evolution of money and finance. Their potential to enhance payment efficiency, improve financial inclusion, and strengthen monetary policy implementation positions them as a cornerstone of the future global trading system. However, their successful integration requires careful consideration of privacy, security, regulatory, and technological challenges. As countries continue to explore and implement CBDCs, their impact on global trade and finance will unfold, potentially reshaping the financial landscape in profound ways.

My Plan To Improve My Win/Loss Ratio In Forex TradingThe trading plan that I have been designing based on SMC was amazingly beautful in terms of its mechanics. Yet, it had a terrible Win/Loss ratio.
Because I loved its mechanics, I didn't want to drop it all together, and was looking for ways to enhance it. I tried to merge it with the classical school and with some Volume indicator, but things still went south.
Finally, I came by some educational material that showed me a couple of things on using Stochastic. I loved it, and this will be my addition, and what I will test in the coming week.
My plan will include the same SMC rules, and the Stochastic. I will draw the support and resistance zones and maybe trendlines.
I will be using the daily timeframe on two different sets of settings for the stochastic, one is long term and another is shorter term.
I will be coming back with my test results next week.

Top-Down Analysis Strategy: How I Open and Manage TradesLearn how I use top-down analysis from senior to junior timeframes to find high-probability entry points and confidently follow through on trades.
On the weekly chart, I identify point A and the presumed point B — this is my idea. Then, gradually shifting through the timeframes, I need to confirm this idea. I get confirmation when volume appears on the chart.
On the daily chart, I note the formation of a new trading range, which arises as a result of the interaction of the price with the key level. I determine the POI in the form of a daily FVG — my idea is confirmed, and the price is ready to move towards point B.
I also note the daily SNR as a potential zone of interest. If the price reacts to the SNR, it will mean that I am working in a strong trend. If the reaction occurs on the FVG, the movement simply continues along the trend.
If you are interested in the topic of working in ranges, write in the comments — I will definitely cover it.
As a result of the daily SNR test, the price confirms the presence of volume through the formation of a 4-hour True SNR. You can open a position from it with a limit order with a target beyond point B and fix the risk/profit ratio at 1:2.
If you found this article interesting and my method useful, I would appreciate your support — please like, share, and help promote this article so that it reaches more traders.

Broker Platform Selection in the World MarketIntroduction
In the ever-evolving world of financial markets, broker platforms play a pivotal role as the primary gateway between investors and global trading opportunities. Whether an individual investor, institutional trader, or algorithmic system, the selection of a reliable broker platform determines not only the ease of trading but also the safety, cost-efficiency, and overall success of investment strategies. As financial globalization deepens and digital technology revolutionizes access to assets, understanding how to select the right brokerage platform in the world market has become a critical skill.
The broker selection process involves evaluating several dimensions—such as regulation, cost structure, asset variety, technology infrastructure, customer service, and market reputation. This essay explores the key considerations for broker platform selection, analyzes leading global brokers, and highlights future trends shaping the brokerage industry worldwide.
1. The Role of Broker Platforms in the Global Market
A broker platform acts as an intermediary that allows clients to access financial markets such as equities, commodities, currencies, and derivatives. In the pre-digital era, brokers were physical intermediaries operating through phone orders and manual execution. However, today’s brokerages provide seamless, technology-driven platforms offering real-time price feeds, advanced charting tools, and automated trade execution.
The global brokerage ecosystem is divided broadly into retail brokers (serving individual investors) and institutional brokers (serving hedge funds, banks, and large-scale investors). Retail platforms such as Interactive Brokers, eToro, TD Ameritrade, Saxo Bank, and IG Markets have made global investing accessible to millions of individuals. Institutional platforms like Goldman Sachs, Morgan Stanley, and JP Morgan serve large portfolios through direct market access and specialized trading infrastructure.
2. Key Factors to Consider When Choosing a Broker Platform
Selecting a broker platform requires a careful balance between regulatory security, technological efficiency, and cost-effectiveness. Below are the major factors influencing this choice:
a. Regulation and Security
Regulation is the cornerstone of trust in brokerage services. Regulated brokers are supervised by recognized financial authorities that enforce rules for client protection, fair trading, and fund segregation. Some of the world’s leading regulatory bodies include:
U.S. Securities and Exchange Commission (SEC) and Financial Industry Regulatory Authority (FINRA) – United States
Financial Conduct Authority (FCA) – United Kingdom
Australian Securities and Investments Commission (ASIC) – Australia
Cyprus Securities and Exchange Commission (CySEC) – Europe (EU Passporting)
Monetary Authority of Singapore (MAS) – Asia
Choosing a broker regulated by these authorities ensures investor protection against fraud, misuse of funds, or unfair market practices. Regulation also affects the level of leverage and investor compensation schemes in case of insolvency.
b. Trading Instruments and Market Access
Different brokers specialize in specific asset classes. A good platform provides access to multiple markets such as:
Equities (stocks) – Global exchanges like NYSE, NASDAQ, LSE, BSE
Forex (currencies) – Major, minor, and exotic currency pairs
Commodities – Precious metals, energy, and agricultural products
Derivatives – Options, futures, and CFDs
Cryptocurrencies – Bitcoin, Ethereum, and other digital assets
Global traders often prefer multi-asset platforms (e.g., Interactive Brokers, Saxo Bank) that allow portfolio diversification under one account.
c. Trading Costs and Fees
Costs directly affect profitability. Traders must analyze the following cost structures:
Commissions – Fee per trade or per lot
Spreads – Difference between bid and ask price
Swap/Overnight Charges – For leveraged positions held overnight
Account Maintenance and Withdrawal Fees – Administrative costs
Discount brokers have disrupted traditional brokerage models by offering zero-commission trading on equities and ETFs. However, hidden costs such as wide spreads or payment-for-order-flow practices should also be considered.
d. Trading Technology and Platform Usability
The effectiveness of a broker often depends on its trading technology. Platforms must offer:
Real-time market data and low latency execution
Advanced charting tools and technical indicators
Algorithmic trading and API integration
Mobile and web trading accessibility
User-friendly interface with customizability
Platforms like MetaTrader 4/5, cTrader, and TradingView dominate global forex and CFD trading, while stock investors use Thinkorswim, TWS (Interactive Brokers), and SaxoTraderGO for professional-grade analysis.
e. Customer Support and Educational Resources
Efficient customer support builds trust, especially in fast-moving markets. Leading brokers provide 24/5 or 24/7 multilingual support via live chat, email, and phone. Additionally, brokers that offer educational resources, webinars, and market analysis attract both beginners and professionals aiming to refine their skills.
f. Deposit and Withdrawal Flexibility
Global investors seek seamless fund management. Platforms supporting multiple payment gateways—like bank transfers, credit/debit cards, PayPal, and digital wallets—offer convenience. Moreover, brokers with transparent and quick withdrawal processes stand out in terms of reliability.
3. Types of Broker Platforms in the Global Market
Different types of brokers cater to different trader profiles. Understanding these categories helps align one’s needs with the right platform.
a. Full-Service Brokers
Full-service brokers offer personalized investment advice, portfolio management, research insights, and dedicated support. They charge higher commissions but are suitable for long-term investors. Examples include Charles Schwab, Fidelity, and Morgan Stanley Wealth Management.
b. Discount Brokers
Discount brokers provide basic trading services with low or no commissions. They focus on technology-driven self-directed trading rather than advisory services. Examples: Robinhood, Zerodha (India), and Interactive Brokers.
c. ECN/STP Brokers
Electronic Communication Network (ECN) or Straight-Through Processing (STP) brokers connect traders directly with liquidity providers, ensuring transparent and fast execution with tighter spreads. Popular ECN brokers include IC Markets, Pepperstone, and FXTM.
d. Proprietary Trading Platforms
Some brokers develop their own proprietary systems offering unique interfaces and tools—for example, TD Ameritrade’s Thinkorswim, SaxoTraderGO, and IG’s platform. These platforms often provide integrated research, charting, and order management tools.
4. Leading Global Broker Platforms
The world’s top broker platforms are known for their innovation, reliability, and regulatory compliance. Below are some prominent examples:
Interactive Brokers (IBKR) – Offers global access to 150+ markets, low fees, and advanced research tools; ideal for professionals.
Saxo Bank – Denmark-based multi-asset broker with a strong European presence and excellent user interface.
TD Ameritrade – Known for Thinkorswim platform and strong U.S. market research.
eToro – Leader in social and copy trading, allowing users to replicate trades of top investors.
IG Group – Pioneer in CFD and forex trading with strong regulation and mobile apps.
CMC Markets – Highly regulated UK broker with excellent execution and analytical tools.
Plus500 – User-friendly CFD platform targeting retail traders.
Each platform differs in trading philosophy—some focus on active day traders, while others cater to long-term investors seeking global diversification.
5. The Impact of Technology on Broker Platform Selection
Technological innovation has reshaped brokerage operations across the world. The rise of AI-driven analytics, automated trading bots, mobile apps, and cloud-based execution systems have made trading faster and more efficient.
Artificial Intelligence (AI): Platforms use AI to offer predictive market insights, personalized recommendations, and sentiment analysis.
Robo-Advisors: Automated portfolio managers like Wealthfront and Betterment are revolutionizing passive investing.
Blockchain Integration: Decentralized trading platforms (DEXs) like Uniswap and dYdX enable direct asset ownership without intermediaries.
APIs for Algo-Trading: Institutional-grade brokers allow users to build algorithms that execute trades based on custom strategies in milliseconds.
Cloud Computing: Enables scalable and high-speed trading environments with reduced latency.
Traders increasingly prefer brokers that stay technologically updated and compatible with global financial innovations.
6. Global Regulatory Environments and Compliance
Every region follows unique regulatory frameworks to maintain investor safety and financial stability.
United States: The SEC and FINRA impose strict reporting and capital adequacy requirements. Brokers like Charles Schwab and TD Ameritrade are benchmarked for compliance.
United Kingdom: The FCA mandates transparency and negative balance protection.
European Union: MiFID II ensures uniform investor protection and reporting standards.
Asia-Pacific: ASIC, MAS, and SEBI (India) regulate brokers with growing global recognition.
A broker operating in multiple regions must comply with cross-border laws, money laundering (AML) protocols, and data protection acts (like GDPR).
7. Risk Management and Investor Protection
Reliable broker platforms provide risk management tools like stop-loss orders, margin calculators, volatility alerts, and negative balance protection to safeguard traders from extreme market movements. Additionally, segregated client funds ensure that user deposits remain separate from the broker’s operational funds, providing a safety net in case of financial distress.
Investor compensation schemes, such as SIPC (U.S.) and FSCS (UK), further protect client capital if the broker defaults.
8. The Future of Global Brokerage Platforms
The future of brokerage platforms will be defined by digital transformation, AI, and sustainability-driven finance. Key trends include:
Fractional Ownership: Allows small investors to buy portions of expensive assets like Amazon or Tesla shares.
Social Trading Networks: Copy trading and community-driven analysis continue to grow globally.
Decentralized Finance (DeFi): Blockchain-based platforms will challenge traditional broker models.
AI and Big Data: Predictive analytics will make decision-making more intelligent.
Sustainability Investing (ESG): Brokers are adding environmental, social, and governance filters to support responsible investing.
As boundaries between technology and finance blur, broker platforms are evolving into holistic financial ecosystems integrating trading, analytics, learning, and social collaboration.
Conclusion
Selecting the right broker platform in the world market is one of the most important decisions for any trader or investor. A well-chosen platform ensures not only access to global markets but also enhances profitability through transparency, speed, and security. The ideal broker must combine regulatory compliance, advanced technology, diversified market access, low costs, and responsive customer service.
In today’s interconnected financial ecosystem, the competition among global brokers is fierce. With technological disruptions like AI, blockchain, and decentralized finance reshaping the industry, the broker platforms of the future will not merely execute trades—they will empower users with data-driven intelligence, global connectivity, and complete control over their investment journey.
Ultimately, successful trading begins not just with knowledge or capital, but with the right broker platform—a partner that bridges global opportunities with local expertise, ensuring that investors can navigate the dynamic world markets with confidence and precision.
