What Is Really Happening With Metals?What Is Really Happening With Metals?
A question the market has already answered before you realized it.
The Real Context
We live in a fragile world.
Institutions that promised stability have lost credibility. Monetary policies that worked a decade ago now create more problems than they solve. Financial markets are speculative machines disconnected from any physical anchors.
In this environment, something occurs that conventional economic theory ignores: capital seeks tangible reality with modern access.
When everything abstract fails, the real prevails.
---
The Paradox No One Admits
Bitcoin haters benefit from the technology that crypto developed.
That's the irony.
Central banks criminalize Bitcoin while building their own blockchain versions. Regulators reject cryptocurrencies while creating frameworks for RWAs (Real World Assets).
This is not contradiction. It's institutional plagiarism.
If Bitcoin critics were right, the digital euro wouldn't exist.
But it does. And that says everything.
---
From Useless Altcoins to Tangible Assets
For years, crypto promised to revolutionize the world.
Altcoins with no utility. Speculative narratives. Technology searching for problems.
Most were dreams created to hypnotize retail investors. "Hold your alts, they'll go to the moon" they screamed. It never happened. It wasn't meant to.
But there were other possibilities. And now they're emerging.
We're entering something different. More mature. More real.
Blockchain anchored in tangible assets.
This is not crypto's defeat. It's crypto's real victory.
---
The Problem Crypto Solved Without Knowing
A decade ago, if you wanted gold you had bad options:
Physical gold: Expensive to store. Difficult to transfer. Immobilized. Requires vaults.
Bank certificates: Total counterparty dependence. Lack of transparency. Systemic risk.
Gold mining companies: Not real gold. Operational risk.
You couldn't travel with gold without risk. Investing in gold was prehistoric.
---
What Crypto Enabled: Gold Tokenization
Today, thanks to blockchain:
Own fractions of tokenized gold
Verify backing in real time without intermediaries
Transfer in seconds globally
Exchange without unnecessary intermediaries
Convert to physical whenever you want
Or keep it digital (equally real)
You no longer need to carry gold bars around.
You have digital access to verifiable, secure gold.
Who made this possible? Crypto. The same technology ridiculed five years ago.
---
Digital Gold Is Not Speculation. It Is Gold.
When you tokenize gold on blockchain, you're not creating something imaginary. You're improving something real.
An RWA gold asset is:
Verifiable: Blockchain proves backing in real time
Fractionable: Buy from $10/day without intermediaries
Liquid: Sell in minutes, not days
Portable: You don't need it physically to own it
Transparent: You know exactly where it is, how much exists, who custodies it
This is more secure than traditional gold. It has both layers: verifiable physical backing plus immediate digital access.
Critics are simply wrong. And they prove their error every day using digital money that central banks create with blockchain.
---
The Institutional Confession
The European Central Bank develops digital euros.
The Federal Reserve builds blockchain-based settlement systems.
Governments create digital money.
What's the technological base? Blockchain. Exactly: the infrastructure that Ethereum proposed 10+ years ago.
Central banks criminalize Bitcoin while reproducing its technology.
This is not regulation. It's admitted plagiarism.
If Bitcoin critics were right, there would be no digital euro.
But it exists. QED.
---
The Convergence of Markets
We're at an inflection point few understand.
Old Phase (2010-2024):
Altcoins with no utility. Pure speculative narratives. Blockchain desperately searching for a problem.
New Phase (2025+):
Tokenization of real assets: gold, silver, copper, oil on blockchain. Commodities connected to the digital world. RWAs as a bridge between traditional finance and blockchain.
In this phase: gold and Bitcoin don't compete. They're allies.
Gold becomes more accessible, more liquid, more verifiable through blockchain.
Bitcoin is no longer just speculative. It's part of an ecosystem of digitalized hard assets that even governments want to reproduce (without admitting it).
---
Why This Matters Now
We live in a context where:
Real geopolitical tensions exist (not theoretical)
Institutions are questioned
The world's most powerful nation faces internal and external problems
Security is priority
The future is uncertain
The solution is not less technology. It's more technology applied to proven assets.
You need gold that:
Is backed by verifiable real metal
Is verifiable on blockchain
Can be converted to physical whenever you want
Doesn't depend entirely on central banks
Is yours in reality
This is RWA. And in times of geopolitical fear, RWAs make complete sense.
They are the bridge between what you know (gold, security, tangibility) and what the future requires (accessibility, verification, decentralization).
---
The Historical Pattern: Gold vs. Stocks
We look back and see a pattern repeated almost mathematically.
The 1970s:
Abandonment of the gold standard
Runaway inflation
Energy crisis
Institutions losing control
Result: Gold multiplied. Stock markets offered negative real returns. Not accident. Inevitable mechanics.
Late 1990s to Early 2000s:
Tech bubble bursts
Speculative narratives collapse
Markets need years to digest the excess
Result: Gold leading a prolonged bull cycle. Stock indices struggling to survive.
Today:
The gold-to-stock ratio is not at historical highs.
That matters more than it seems. It doesn't mean gold has hit its ceiling. It means there's still room under the right macroeconomic conditions.
Current conditions equal geopolitical fragmentation, structural weakness in financial assets, institutional distrust.
Exactly the conditions that historically favor significant expansion of that ratio.
Markets aren't overvaluing gold. They're undervaluing what's happening everywhere else.
---
Silver: The Amplifier
Silver is gold's beta. More volatile. More industrial. More sensitive.
When gold rises, silver doesn't just follow: it amplifies.
More aggressive bull phases. Also more fragile. More prone to sharp corrections when extreme momentum exhausts.
In the current cycle, silver accelerated its movement more abruptly than gold.
Really crazy parabola.
In cycle terms: part of the move is already ahead. Silver is more speculative. Gold still has runway.
And now, through tokenization, small investors participate in fractional silver.
Without expensive vaults. Without traditional banking intermediaries.
That is democratization of access.
---
Copper: Geopolitical Reality Window
Copper is different. It's not primarily a safe-haven metal. It's a strategic metal.
Structural Electrification
Electrical grids, renewables, electric vehicles, data centers: everything requires copper. A lot of it.
This demand is not cyclical. It's structural. Inevitable.
The Military Dimension
Modern warfare is electrical.
Copper is essential in:
Sophisticated munitions
Military communications
Radar and guided systems
Missiles and drones
Military infrastructure
In phases of global rearmament, demand intensifies sustainably.
When war is near, copper shines.
Mining Companies: Pure Operational Leverage
Mining companies amplify metal movements.
A 20% increase in copper price equals 40-50% increase in profits.
Copper is not a safe-haven metal. It's a strategic opportunity metal.
Through tokenization, retail investors participate without needing million-dollar positions in traditional miners.
---
Palladium and Platinum: The Sensors
Palladium occupies uncomfortable territory: small market, concentrated supply (Russia, South Africa), specific industrial demand.
In normal phases: standard industrial asset.
In geopolitical tension or supply disruptions: indicator of extreme volatility.
Abrupt movements. Difficult to sustain. Often preceding major cycle changes.
Platinum can act as a partial substitute in some applications, but doesn't eliminate the structural market fragility.
These are metals to watch as cycle sensors and geopolitical indicators.
---
The Rotation: How Markets Move According to Context
Capital moves in predictable sequences. Timing remains uncertain.
Phase I: Early Risk-Off
Context: Geopolitical tensions emerge. Fear is latent, unconfirmed.
What leads: Gold, palladium initial moves, energy
Signal: Crypto begins to bleed. Financial markets don't yet understand.
Phase II: Structural Risk-Off (We are here now)
Context: Conflicts prolong. Rearmament formalizes. Strategic electrification accelerates.
What leads: Gold (stable, rising), copper and miners (important role), uranium begins repricing
Signal: Total dominance of hard assets. Crypto remains fragile. But RWAs begin emerging as alternative to pure crypto.
Phase III: De-escalation and Fear Normalization
Context: Conflict stops escalating. Expectations improve. Uncertainty slows.
What happens: Uranium peaks. Copper loses momentum. Gold consolidates. RWAs consolidate as full narrative.
Signal: First sign of change. But still not real risk-on.
Phase IV: Confirmed Risk-On
Context: Real tensions diminish. Capital seeks greater returns.
What leads: Bitcoin, Ethereum, progressively other assets
Signal: Rotation from hard assets to speculation. But RWA access to hard assets allows maintaining exposure with efficiency.
Critical note: Understanding this sequence means understanding the complete cycle.
Not just Bitcoin dominance and alt seasons. Perhaps those crypto cycles won't happen again like they did before.
---
The Synthesis: What Markets Are Doing
Markets converge toward something that is:
Real and tangible: gold, copper, real assets
Digitalized: via blockchain (accessible, transferable, verifiable)
Free from institutional dependence: but with regulation
Accessible to the majority: fractionalization of real assets
It's not "blockchain vs. gold" and who wins.
It's a new synthesis: trustworthy traditional markets plus blockchain efficiency.
Bitcoin haters finance exactly this through central banks creating digital money.
They oppose Bitcoin but approve digital euros.
The technology they rejected is the one they use.
The public who believed them will understand this too late.
---
What Reality Says
Metals are not on a speculative rally. They respond to fundamental changes.
Reality over abstraction:
When everything financial fails, the physical prevails.
Strategy over consumption:
Copper demand grows due to rearmament and state electrification, not ordinary cycles.
Historical memory:
Gold always rises when institutions lose trust.
And institutional trust today equals where it was in the 1970s.
Modern infrastructure:
Blockchain enables access that was previously impossible without sacrificing security.
Anticipating signals:
Pure crypto weakness, gold strength, copper miner momentum, RWA emergence are not isolated facts.
---
The Uncomfortable Conclusion
If metals rise while speculative crypto falls, while growth stocks struggle, while bonds are questioned:
The market is being realistic.
Geopolitical tensions are real. Debt is unsustainable. Central banks can't rescue everything. Institutions are questioned.
And it seeks protection in the only thing that always works: what cannot be printed, replicated, or destroyed by political decisions.
But now, improved with digital access that crypto made possible.
Metals will remain protagonists while these conditions persist.
Not because it's fashion. Because they reflect truth that financial markets try to deny.
And RWAs will gain market share not because they defeat gold, but because they make it accessible to everyone.
Those who understand this rotation, who see metals as cycle sensors, who accept that blockchain improved access to hard assets will be better positioned.
Technical analysis is largely out of the game for now.
It's not about trading. It's about the real need to preserve wealth in a fearful environment.
"If I don't have to, I won't sell my gold which will always be gold" becomes a common phrase now.
The market knows. Crypto made it possible. Most people haven't yet processed that both things are true.
---
Operational Perspective for 2025
Physical gold plus tokenized gold (RWA):
Long-term defensive position. Rising smoothly and profitably. Psychological resistance above 2,200.
Silver:
A more playful asset for traders who are now out of crypto. Waiting for rotation to Bitcoin at the right time.
Copper and miners:
Strategic opportunity asset in tension contexts. Mining ETFs amplify moves. New tokenizations open retail access.
Palladium:
Good sensor. Short-term play. Also tokenized.
Crypto:
Surviving this moment. Preparing to surge again. Meanwhile, hard assets on blockchain lead.
---
Final Synthesis
We don't choose between gold versus technology.
We choose gold improved by technology.
We don't choose between gold versus Bitcoin.
We choose both in a new ecosystem.
The era of RWAs (Real World Assets) is not the future. It's the present.
And we're just beginning.
---
By Teo Mariscal
Special thanks to the CGP crew for all the teachings.
---
References
Baur, D. G., & Lucey, B. M. (2010). Is gold a hedge or a safe haven? Financial Review, 45(2), 217-229.
European Commission. (2022). Regulation on Markets in Crypto-assets. Official Journal of the European Union.
Gold Council. (2023). Gold as a financial asset: Market structure and properties. World Gold Council Research.
Humphreys, D. (2019). The future of copper: Will mining keep pace with demand? Resources Policy, 60, 226-234.
Rogoff, K. (2019). The decline of cash. The American Interest, 14(3), 18-24.
Palladium

Generational Wealth | Precious Metals Super Cycle | Palladium Strategy: Impulse Correction
Direction: Bullish
Moving Average: Blue above Red
Fib Retracement: 38.2 reached
MACD > 0
Support : Finding additional confluence, as the weekly bounces off a massive support structure.
Alongside this, we can see that a reverse pattern is becoming clear with additional support illustrated by the support level in the form of the rectangular red box.
1st Target = 1678
2nd Target = 1836
3rd Target = 2039
Lots: 0.1 (Plan to pyramid into this one)
INSIGHTS: Precious metals continue to show strength with a weakening dollar. Pay attention to the DBC commodity Index which is indicating strength across the commodity complex. Alongside this, the DXY is sitting at an interesting level. Lets see whether will bounce at this level off a multiyear trend or whether the dollar will give way to lower lows in the coming months.

XAUUSD: short-term opportunities🛠 Technical Analysis: On the H4 chart, Gold (XAUUSD) remains in a broader uptrend, but the latest swing shows a rejection from the rising resistance line, followed by a sharp pullback and consolidation. Price is now rotating back toward the key horizontal support zone around 4,350–4,365, where another test could trigger a bearish continuation move. The SMA50 and SMA100 are acting as dynamic “decision” levels, while the SMA200 aligns closely with the first downside objective. A confirmed breakdown below the 4,350 area opens the path toward 4,246.67, with the marked medium-term support area near 3,900 as an extended target.
———————————————
❗️ Trade Parameters (SELL)
———————————————
➡️ Entry Point: Sell on a confirmed breakdown 4,350–4,365 support zone (approx. 4,365.78)
🎯 Take Profit: 4,246.67 (the first target), medium-term extension toward the support area near 3,900
🔴 Stop Loss: 4,484.90
⚠️ Disclaimer: This is a potential trade idea based on current analysis; market conditions and price direction are subject to change based on news factors and volatility.

Commodity Supercycles Don’t Start Where Most People LookOne thing I have learned over the years:
🥇Gold is usually first. (already done)
Not because the economy is booming, but because something feels off. Wars... Inflation... you name it. Gold reacts before the story is clear.
🥈Then silver starts waking up. (happening)
That’s usually when attention shifts from protection to opportunity. Silver doesn’t just follow gold, it magnifies it. It is cheaper and more convenient especially for those who missed gold's move!
🥉After that, the industrial metals come into play.
Copper, palladium, platinum. This is where the cycle starts to feel real. Demand is no longer theoretical. Growth shows up on the charts. (this feels just like altcoin season in crypto lol)
🛢Oil and gas tend to move later.
Not last by accident. By then, expansion is obvious and inflation pressures are already building.
🔄Most traders get this backwards.
They chase what’s already moving instead of asking why it’s moving.
The edge isn’t guessing the top or bottom.
It’s understanding what stage the market is in and positioning accordingly.
Honest question...⁉️
Are you reacting to what already moved… or paying attention to what’s just starting?
⚠️ Disclaimer: This is not financial advice. Always do your own research and manage risk properly.
📚 Stick to your trading plan regarding entries, risk, and management.
Good luck! 🍀
All Strategies Are Good; If Managed Properly!
~Richard Nasr

XPD/USD | Institutional Support Defines Bullish Bias🔥 XPD/USD — Palladium vs U.S. Dollar 💎
⚡ Metals Market Opportunity Blueprint | Day / Swing Trade 🚀
📊 MARKET SNAPSHOT (Jan 2, 2026)
💵 Live Price: 1,613.40 USD/oz
📈 52-Week Range: 885.83 → 2,014.01
🏆 YTD Performance: +86.56% (strongest rally in ~15 years)
📊 Technical Bias: Neutral → Bullish Potential
🎯 TRADE BIAS
📌 Primary Plan: BULLISH PULLBACK
Double pullback confirmed on 200 SMA retest
Higher-timeframe structure remains bullish
Consolidation completed → momentum re-ignition
Buyers defending structure after corrective phases
🧠 Market Context:
Structural supply deficit expected into 2027
Slower EV adoption = extended ICE demand
Russian supply constraints maintain scarcity premium
💰 ENTRY STRATEGY — THIEF LAYERING METHOD
Accumulation on pullbacks | No single-price exposure
🕵️♂️ BUY LIMIT LAYERS
🟢 Layer 1: 1,500 → ~33% position
Psychological + structural support
🟢 Layer 2: 1,550 → ~33% position
Mid-range pullback & cost-average zone
🟢 Layer 3: 1,600 → ~34% position
Resistance flipped to support
💡 Why Layering Works:
Reduces average entry price
Protects against fake breakouts
Builds exposure where institutions accumulate
📌 Adjust spacing based on volatility & risk profile
🛑 STOP LOSS FRAMEWORK
❌ Invalidation Level: 1,450
📉 Breakdown below this level:
Breaks macro support
Invalidates bullish structure
Signals higher-timeframe momentum shift
⚠️ This SL is structural reference — adjust to your own risk rules
🎁 PROFIT OBJECTIVES — LIQUIDITY ZONES
🎯 TP1: 1,800 — Liquidity Cluster
Historical volume concentration
Expect reaction / pause
📌 Action: Book 40–50% profit
Move SL toward breakeven / above Layer 2
⚡ TP2: 2,000 — Overbought Zone
Higher-TF exhaustion area
Strong deviation from averages
📌 Action: Full exit recommended
🧠 Optional: If momentum expands strongly, trail final 20% only
📈 FUNDAMENTAL BACKDROP (2026):
✅ BULLISH DRIVERS
📉 Structural supply deficit through 2027
🚗 Automotive demand dominance (~85% usage)
📊 EV adoption slower than projected
🛑 Russian export constraints
🏛️ US critical mineral designation
⏱️ EU emission standards delay (Euro-7 → 2031)
⚠️ RISKS TO MONITOR:
♻️ Recycling supply acceleration
💍 Platinum substitution risk
📉 Global recession impact on auto production
🌍 Trade policy & tariff escalation
🇨🇳 China economic slowdown
🔗 CORRELATED MARKETS TO WATCH:
📊 DXY (US Dollar Index) — Strong inverse correlation
💵 USD/JPY — Dollar weakness = XPD strength
🇪🇺 EUR/USD — Euro strength supports metals
💍 Platinum (XPT/USD) — PGM confirmation / substitution risk
🏆 Gold (XAU/USD) — Macro sentiment confirmation
🗓️ KEY MACRO CATALYSTS (Q1 2026):
📊 US Jobs & CPI reports
🏛️ Fed leadership transition
🇨🇳 China Manufacturing PMI
🚗 Global auto sales data
🛢️ Oil price trends
🌍 Russia-related geopolitical headlines
📊 KEY LEVELS SUMMARY:
🛑 1,450 — Structural support / SL
💰 1,500 — Layer 1 support
💰 1,550 — Layer 2 support
💰 1,600 — Layer 3 (flip zone)
📍 1,745 — Projection resistance
🔥 1,800 — TP1 liquidity cluster
⚡ 2,000 — TP2 / overbought zone
✅ EXECUTION CHECKLIST
✔ Buy pullbacks — no chasing
✔ Deploy layers progressively
✔ Scale partials at TP1
✔ Trail stops after profits
✔ Monitor DXY for confirmation
✔ Track Russia & supply headlines
✔ Re-validate fundamentals weekly
🎓 TECHNICAL NOTES
⏱️ Best TFs: 4H & Daily
🌍 Best liquidity: London–US overlap
⚠️ Expect spread widening during macro/news events
📉 Avoid oversized positions in thin liquidity
⚠️ RISK DISCLAIMER
🔴 Educational analysis only — NOT financial advice
Markets are unpredictable. Losses can exceed expectations.
You control risk, sizing, execution, and exits.
Trade only capital you can afford to lose.
🚀 FINAL TAKEAWAY
Palladium presents a high-quality bullish pullback setup backed by:
Structural supply deficit
Extended ICE demand lifecycle
Dollar weakness tailwind
Clear technical invalidation
📌 Strategy: Layered accumulation → scale profits → disciplined exits
📌 Edge: Structure + fundamentals + risk control
👍 Like & Follow for more Metals Market Blueprints
⏰ Set alerts | 🧠 Manage risk | 🎯 Execute with discipline
👑💎⚡

Precious metals lead the way: silver, platinum, and palladium!On December 2, FreshForex analysts had already highlighted the high potential of the metals market — and the market quickly confirmed this scenario with a sharp rise in prices: silver (XAGUSD) +12.89%, platinum (XPTUSD) +9.03%, and palladium (XPDUSD) +8.75% . Our metals forecasts not only played out — this segment confidently outperformed many other asset classes. Investors are moving away from the dollar and government bonds into real assets amid expectations of U.S. rate cuts. Prices are also being fueled by news of supply deficits and rising industrial demand for these metals. Against this backdrop, interest in precious metals is growing among both retail and large institutional investors.
Growth Drivers:
Silver (XAGUSD) is rising due to a supply shortage : demand from the solar energy sector and electronics is increasing, while inventories are declining. For investors, silver is also a more affordable alternative to gold .
Palladium (XPDUSD) is supported by limited supply and geopolitical risks : the market depends heavily on Russia and South Africa, while demand for palladium in automotive catalysts and electronics remains strong. As a result, even rumors of sanctions or export restrictions can sharply push prices higher.
Platinum (XPTUSD) is gaining value amid mining disruptions in South Africa , which remains a key global supplier. At the same time, demand from industry and hydrogen-related projects keeps the market tight, meaning any news from the mining sector is quickly reflected in prices.
If a dovish Fed policy and a weak dollar persist, interest in precious metals as a “hedge against currency devaluation” is likely to remain high. Silver receives an additional boost from the “green” agenda — the development of solar energy and electric vehicles, where it is used in virtually every component.
Platinum and palladium continue to depend on a limited number of supplier countries, making any disruptions in mining or logistics powerful price triggers. In this environment, even minor news about production cuts or new restrictions can spark another wave of growth. As long as the market sees a supply deficit and no quick way to significantly increase output, the bullish scenario retains strong potential.
FreshForex analysts note that in the coming months, the performance of silver, platinum, and palladium will largely depend on the Fed’s rate-cut trajectory, the pace of the global “green” transition, and mining-related news from key regions — primarily South Africa and Russia. Investors are advised to maintain strict risk management and closely monitor the macroeconomic calendar.

XPD/USD: Mapping A Bullish Swing Trade On Palladium🎯 Title: XPD/USD Palladium Play: The Kijun Thief's Bullish Heist! 💎🚀
Buckle up, Thief OG's! 👑 Pd (Palladium) is flashing a classic bullish pullback play, and we're looking to sneak in with a layered entry strategy. This isn't a race; it's a calculated ambush! 🥷✨
📈 The Setup: Bullish & Bouncy
Asset: XPD/USD (Palladium vs. U.S. Dollar) 💰
Bias: STRONGLY BULLISH ✅ 🐂
Confirmation: A clean pullback to the Kijun-sen (Kijun Moving Average) from the Ichimoku Cloud. Price respecting this level is our green light! 🟢
🎯 The Thief's Entry Plan (Layered Limit Orders)
The breakout above 99.200 confirms the vibe! Our "Thief Strategy" uses multiple limit orders to scale in, averaging our entry like a pro.
Entry Zone: We're setting buy limit orders in layers:
Layer 1: 🎯 1360
Layer 2: 🎯 1380
Layer 3: 🎯 1400
Layer 4: 🎯 1420
💡 Pro Tip: You can add more layers or adjust levels based on your risk appetite!
⚠️ Risk Management (The Escape Plan) 🚨
Stop Loss (The Getaway Car): 🚗💨 A Thief's SL is 1300. This is our line in the sand. If price breaches this, the heist is off!
📢 Note, Dear Ladies & Gentleman (Thief OG's): I do not recommend using only my SL. It's your choice; you can make money then take money at your own risk.
💰 Profit-Taking (Cashing the Loot) 🏦💵
Target: 1620 🎯
Why Here? This area converges with a strong Moving Average resistance, potential overbought conditions, and could be a trap for late buyers. We escape with profits before the chaos! 😎
📢 Note, Dear Ladies & Gentleman (Thief OG's): I do not recommend using only my TP. It's your choice; you can make money then take money at your own risk.
🔍 Related Pairs & Market Context 🌍
Keep an eye on the whole precious metals family for confirmation! 👀
XAU/USD ( TVC:GOLD ): 👑 The king of metals. A strong Gold often lifts the whole complex.
XPT/USD ( CAPITALCOM:PLATINUM ): 💍 Palladium's sister metal. They often move in correlation.
TVC:DXY (U.S. Dollar Index): 📉 A weaker TVC:DXY typically boosts dollar-denominated commodities like Palladium.
✨ Footer & Community Love ❤️
✨ “If you find value in my analysis, a 👍 and 🚀 boost is much appreciated — it helps me share more setups with the community!”
🏷️ Hashtags
#Palladium #XPDUSD #Trading #Metals #SwingTrading #TechnicalAnalysis #Ichimoku #Kijun #ThiefStrategy #TradingSetup #ToTheMoon #Profit

XPDUSD - Rare Metal Rally Seeing gold and silver run I thought why not palladium aswell, the commonality between the three being all rare metals
Palladium right now is at an extremely fair price and has bounced nicely of this strong trend line on this Weekly timeframe.
Bullish

Palladium Daily Squeeze Currently watching a daily squeeze looking to breakout on NYMEX:PA1! (I am trading this via AMEX:PALL ).
Should have a nice move up if this breaks bullishly, with an initial target of $1700.

Palladium Outlook – Double Pullback Sets Up Next Leg Higher💎 XPD/USD – “PALLADIUM vs U.S. DOLLAR”
⚡ Metals Market Opportunity Blueprint | Swing Trade Setup 🚀
🧭 Plan: Bullish Confirmation Detected!
✅ Structure: Double pullback confirmed on Kijun Line + 200 SMA retest — trend momentum reignited.
💹 Strategy: Thief’s signature Layering Style Entries 🕵️♂️
💰 Layered Buy Limits: 1,400.000 → 1,440.000 → 1,480.000
(You can increase limit layers based on your own comfort and capital allocation.)
🛑 Stop Loss (SL): Thief SL @ 1,380.000
👑 Dear Ladies & Gentlemen (Thief OG’s) — Adjust your SL based on your own strategy and risk level.
🎯 Take Profit (TP): Resistance acting as a “Police Barricade” 🧱 + Overbought Trap ⚠️ spotted ahead.
🏁 Target zone → 1,660.000
💬 Note: This is not financial advice — trade at your own risk and reward preference!
💠 Correlated Markets & Pairs to Watch:
OANDA:XAUUSD (Gold): Often leads Palladium’s momentum during USD weakness.
⚙️ OANDA:XAGUSD (Silver): Tracks overall metals sentiment; supportive when inflation expectations rise.
💵 TVC:DXY (U.S. Dollar Index): Inverse correlation — weaker dollar often boosts Palladium strength.
💴 FX:USDJPY : Watch for USD weakness; it can signal risk appetite shift favoring metals.
🧠 Key Market Insights:
🔹 The 200 SMA has consistently acted as dynamic support in recent sessions.
🔹 Kijun pullback = Momentum reset before next bullish continuation.
🔹 Layering entries reduce timing risk and improve cost-average efficiency.
🔹 The target aligns with previous supply and psychological resistance around 1,660.
⚔️ Execution Blueprint:
1️⃣ Wait for price retrace into your preferred layer levels (1,400 / 1,440 / 1,480).
2️⃣ Confirm entries via candle reaction or Ichimoku signal.
3️⃣ Keep SL below invalidation zone (~1,380).
4️⃣ Take partials near 1,600 and secure final profits around 1,660.
5️⃣ Stay alert — if USD strengthens, metals might pause or pull back.
💬 “Drop your thoughts below — How are you layering your XPD/USD setup?”
❤️ Hit LIKE & FOLLOW if you enjoy clean swing setups & advanced layering strategy breakdowns!
⚡ Let’s keep the momentum rolling, Thief OG’s 👑

PALLADIUM Channel Up starting a new 2-month Bullish Leg.Palladium (XPDUSD) has been trading within a Channel Up since almost the start of the year. Its latest October 16 Higher High started a pull-back (Bearish Leg) that found support recently on its 1D MA50 (blue trend-line).
As with the Bearish Leg before, it also almost reached the 0.5 Fibonacci retracement level, so there is valid ground for an upward reversal into the new Bullish Leg technically. With the two previous Bullish Legs rising by +50%, we expect a similar development, targeting $2000, which is also the 1.5 Fibonacci extension (as with the last Bullish Leg).
Notice also that the 1D MACD just formed a Bullish Cross, similar to September 02, which started the previous Bullish Leg.
---
** Please LIKE 👍, FOLLOW ✅, SHARE 🙌 and COMMENT ✍ if you enjoy this idea! Also share your ideas and charts in the comments section below! This is best way to keep it relevant, support us, keep the content here free and allow the idea to reach as many people as possible. **
---
💸💸💸💸💸💸
👇 👇 👇 👇 👇 👇

Cup & handle, bull flag - look for a breakoutCommodities are bullish right now if you didn't know.
Silver, Gold, Natural Gas, Palladium and more. They are all interesting right now. Commodities is the sector you should be looking at right now.
We had tech, weedstocks, cryptos, ai
now look for commodities for near term plays.
Speaking of Palladium, I love this chart. Beautiful.
We have a nice formation of a 2 year cup with a resistance at 1600$
Short term, we have near break out of bull flag at 1500$
The blue zone extending to may should be a zone where you have to keep close attention to this chart.
I'm expecting a breakout with target of 1870 ish on palladium. I'm early on this one, there is no breakout at the moment. I just follow the good sector and bet on the nice chart.
SPX/PA - SPX/Palladium ratio flashing a buy$SP:SPX/NYMEX:PA1!
Palladium is looking very good relative to equities currently, currently sitting at a ratio of over 4.50 : 1
I would be expecting to see this normalize around the 2.50-1.5 level, this would imply a significant period of outperformance of palladium relative to the SP500.
This coupled with the continued breakout of Silver and the strong performance of gold, comes together to form a very bullish outlook for palladium.

GOLD/ SILVER RATIO - Quarterly FlagBeautiful looking quarterly flag present on the gold silver ratio, should this break down, which would be likely to play out over the next 12-18 months (at most) then expect much higher silver prices.
I would expect to see the ratio hit between 50-30 should this flag pattern materialize.

“Palladium Double Bottom Thief Plan – Will $XPDUSD Steal 1350?”📝 TradingView Description (Thief Style, Polished, Stylish, Funny-Pro Vibe)
Asset: XPD/USD “Palladium vs U.S Dollar”
Market Map: Forex Metals – Swing/Day Trade Strategy
📊 Plan – Thief Strategy in Action
The bullish plan is confirmed with:
✅ Double bottom pullback & retest
✅ Triangular moving average support
✅ Heikin Ashi reversal doji candle formed
✅ Re-accumulation at the neutral zone
This looks like Palladium is warming up for a climb!
🎯 Entry – Thief Layer Style
Instead of a single entry, I use layered buy limits (multiple limit orders):
💎 1240
💎 1250
💎 1260
💎 1270
(Traders can adjust/increase layers based on their own style.)
🛡 Stop Loss (SL) – Thief’s Guard Line
My SL idea → 1200
👉 But remember: It’s your account, your rules. Choose your own risk shield.
🎯 Target – Thief’s Escape Point
Main target: 1350
Strong resistance barricade around 1400 → could act as a police trap zone (overbought + liquidity zone).
📌 Best play: Escape with profits before the barricade!
🔑 Key Notes to the OG’s
Dear Ladies & Gentleman (Thief OG’s), this isn’t about following my SL or TP blindly.
Trading is risk. Manage it your way → take money, then make money.
🔄 Related Correlation Watchlist
Keep an eye on metals & correlated assets for cross-check confirmation:
OANDA:XAUUSD (Gold) – often leads sentiment in precious metals
OANDA:XAGUSD (Silver) – momentum clues for XPD
OANDA:XPTUSD (Platinum) – strong structural correlation with Palladium
TVC:DXY (U.S Dollar Index) – dollar strength/weakness directly impacts Palladium
✨ “If you find value in my analysis, a 👍 and 🚀 boost is much appreciated — it helps me share more setups with the community!”
⚠️ Disclaimer: This is a Thief Style trading strategy just for fun & educational purposes. Not financial advice. Trade at your own risk.
#XPDUSD #Palladium #Forex #Metals #TradingStrategy #SwingTrade #DayTrade #Gold #Silver #Platinum #DollarIndex #ThiefStrategy

ADA JESSE LIVERMORE SPECULATIVE ACCUMULATION CYLINDERADA is currently experiencing a Jesse Livermore Accumulation Cylinder described in 1925
Typically this pattern resolves with powerful moves to the upside when presenting in a basing pattern
Other assets that underwent this pattern before explosive moves up are
Palladium
Platinum
Silver
Uranium
MOS
IPI
LEU
LTBR

Palladium - The Calm Before the Next Surge!🏹Palladium has been on a strong bullish run , riding within a clean rising channel. After a sharp impulse, price is now cooling off — and this pullback might just be the calm before the next surge.
⚔️The metal is approaching a major intersection zone where the rising trendline meets a strong demand and structure area, a confluence that has previously sparked powerful rallies. As long as this intersection holds, I’ll be watching for bullish confirmations to join the trend.
A healthy correction into this zone could set the stage for the next impulsive wave, with potential upside targets around $1,550 and even $1,700 if momentum kicks in.
In short, Palladium remains overall bullish, and this upcoming retest could be the perfect reload zone before the next big move north.
📊All Strategies Are Good; If Managed Properly!
~Richard Nasr

Palladium Long#Invest #Palladium #PALL #PA #XPDUSD
A weaker dollar after soft US inflation data has increased expectations for a Fed rate cut
US President Trump's announcement of tariffs of up to 100% on India and China to pressure Russia is increasing demand for safe haven assets, including palladium
Palladium prices have lagged behind other precious metals
Palladium production is gradually declining due to the depletion of deposits in South Africa, the US and Canada.
Recycling from old cars only partially compensates for the deficit
Despite the growth of electric vehicles, hybrid vehicles with internal combustion engines retain market share, and this supports demand for palladium for catalysts
New areas of demand:
China and India invest in hydrogen infrastructure. Palladium is used to purify hydrogen
Innovative technologies for using palladium to synthesize ammonia without CO₂ emissions
Supply reduction:
Producers Anglo American, Wesizwe Platinum and others are cutting investments due to low prices
Production in Russia is stable, but growth is only possible with the launch of the Chernogorsk deposit in 2026
Palladium is attractive as an alternative to gold due to its growth potential
From a technical point of view
-formation of a double bottom.
-There was already an exit, a false exit upward.
-Now a cup with a handle is being drawn.
How to participate in the growth?
-Buying a futures contract (US NYMEX ticker PA)
-buying through an ETF (for the US, ticker PALL).
*The ticker may be different on the stock exchange in your country
You can also look at companies with exposure to palladium
Norilsk Nickel, Sibanye-Stillwater and Anglo American

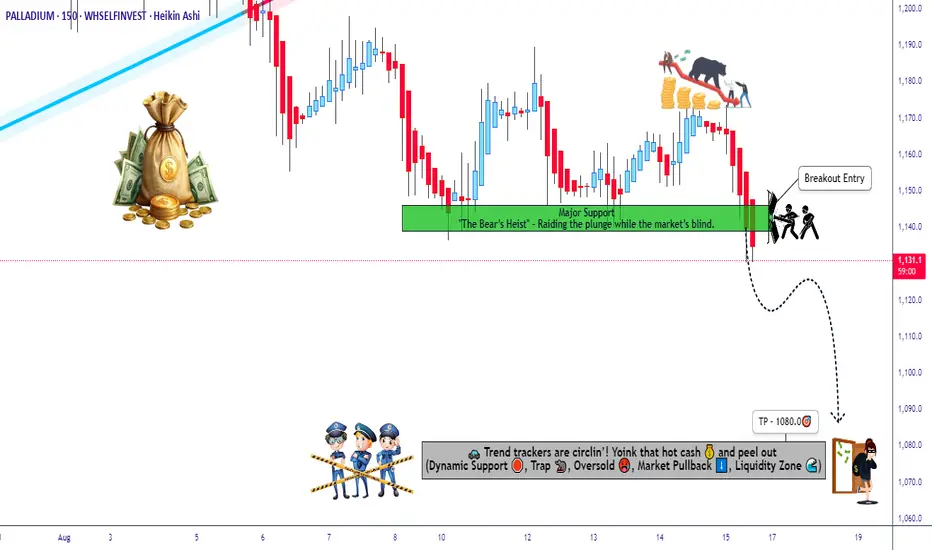
XPD/USD Market Strike – Bullish Pending Heist with Layer Entry⚡💎 XPD/USD "Palladium" Metal Market Heist Plan 💎⚡
🕵️♂️ Dear Thief OG’s, Robbers & Money Raiders…
The vault is open — Palladium is shining, and we’re about to strike.
📊 Asset: XPD/USD "Palladium" (Swing/Scalping Trade)
💡 Plan: Bullish (Pending Order Heist)
🎯 Entry (The Break-in Point)
💥 Primary Breakout Level: 1150.000 ⚡
Thieves don’t walk in one door — we layer the entries.
Multiple buy limit orders stacked like weapons:
1150.000 (confirmed breakout entry 🚀)
1140.000
1130.000
1120.000
👉 You can add more layers based on your vault-robbing capacity.
📌 Set your TradingView alarm at 1150.000 — so you don’t miss the breakout spark that opens the gates.
🛑 Stop Loss (The Escape Route)
This is Thief SL @ 1090.000 (after breakout confirm).
Adjust your SL depending on your own robbery style & risk.
Dear Ladies & Gentlemen of the Thief Gang — protect your loot wisely.
🏆 Target (The Stolen Gold)
⚡ High Voltage shock zone @ 1230.000 — don’t get fried!
🎯 Secure your loot & escape before the guards catch you at 1220.000.
📌 Thief Notes
This robbery isn’t one shot — it’s layering strategy style: stacking orders at different levels for maximum haul.
Scalpers can ride the quick waves 🌊, Swing traders hold for the vault explosion 💣.
Trail your SL to protect the stolen bags 💼💰.
💖 Support the gang! Smash the Boost Button and let’s keep robbing markets together.
Thieves never sleep… Stay sharp, alarms ON, and hands ready to snatch profits! 🕵️♂️💎🚀
PALLADIUM Sell pressure below its 1W MA200.Palladium (XPDUSD) has been trading within a long-term Channel Up that priced its last Higher High on the week of July 14. Despite this week's very aggressive spike, the trend remains bearish as long as the 1W MA200 (orange trend-line) holds, and this is one more sell opportunity offered.
We expect a similar decline with the previous Bearish Leg that fell all the way to the 0.786 Fibonacci extension. This is translated to a 980.00 Target.
-------------------------------------------------------------------------------
** Please LIKE 👍, FOLLOW ✅, SHARE 🙌 and COMMENT ✍ if you enjoy this idea! Also share your ideas and charts in the comments section below! This is best way to keep it relevant, support us, keep the content here free and allow the idea to reach as many people as possible. **
-------------------------------------------------------------------------------
💸💸💸💸💸💸
👇 👇 👇 👇 👇 👇

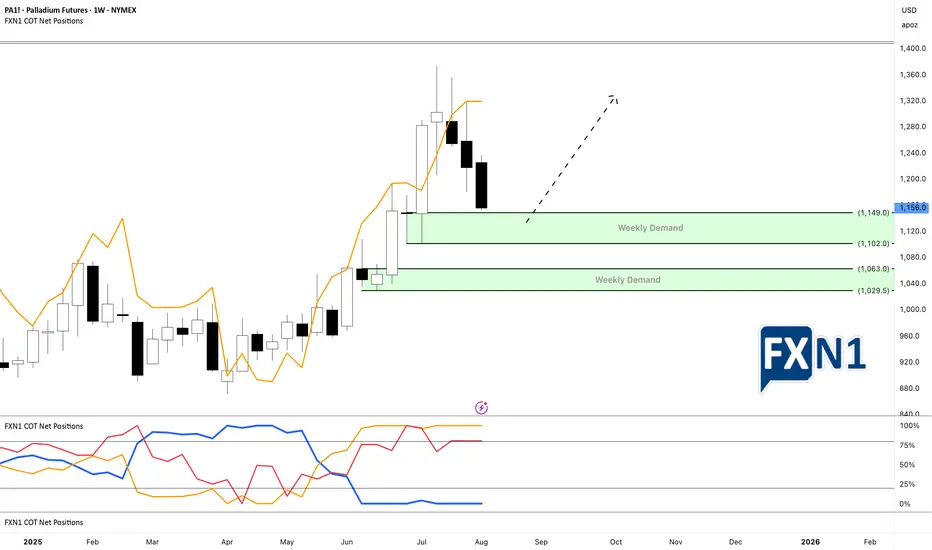
Palladium’s Bullish Outlook Amidst a Market FakeoutPalladium has emerged as the second strongest precious metal this year, demonstrating notable resilience. Over the past three weeks, however, its price has experienced a retracement, revealing two potential weekly demand zones on the chart. An analysis of the Commitment of Traders (COT) report indicates that this pullback is not driven by non-commercial traders, who are actually increasing their positions. This discrepancy suggests that the recent decline may be a false move by the market. Consequently, I am considering placing limit orders within the two identified demand areas to capitalize on a potential rebound.
✅ Please share your thoughts about PA1! in the comments section below and HIT LIKE if you appreciate my analysis. Don't forget to FOLLOW ME; you will help us a lot with this small contribution.
Ivanhoe Mines - a 50% discount opportunity !The share price of this mining monster has suffered a 50% price decline in the last 6 months.
One of the main reasons for the share price decline is the suspension of underground operations at the Kakula mine due to seismic activity. This suspension has led to a withdrawal of production and cost guidance for 2025, causing investor uncertainty and a subsequent drop in share price 1,2,3 Additionally, the company has faced challenges with its smelter, including a fire that damaged onsite generators and caused a three-month delay in commissioning. These issues, combined with power constraints and grid instability in the Democratic Republic of Congo (DRC), have contributed to a more conservative production outlook.
However there are lots of positive catalysts for Ivanhoe Mines: the upcoming rise in precious metal prices, especially the wake up of the severely undervalued PLATINUM prices.
Platreef PGM project in South Africa contains 7 million ounces of gold (0.25 gpt) and 50 million ounces of AuEq. About 90% of annual production (1 million ounces) will consist of PGMs (platinum group metals), making it the largest PGM mine in the world ! Platreef is expected to have low all-in production costs, though more precise figures will become available after the ramp-up phase, scheduled for the second half of 2025.
Platreef PGM, Kakula-Kamoa (massive copper mine, the largest high grade mine globally) and Kipushi (a high-grade zinc operation); With all three of their mines expected to be in production, 2025 could be a pivotal year for them.
Chart wise, the price is still rising in a long term rising wedge. Price just found support on the lower resistance and is bouncing strongly. OBV on balance volume is still on a steady rise. I own Ivanhoe Mines since I got in at sub 1$ (thanks to Rick Rule's reccomandation - God may bless him). and I am not willing to let go before we reach 50$, which is my long term target.

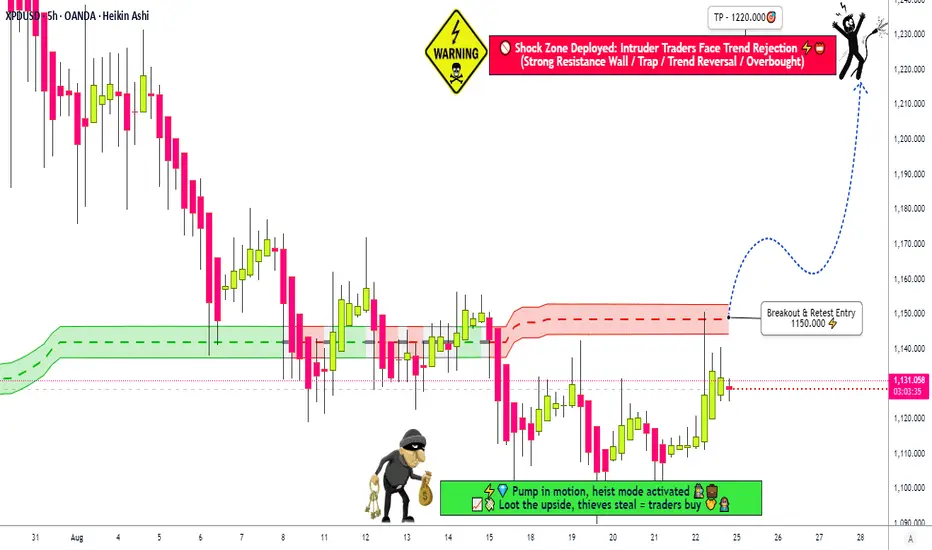
"BEARISH PALLADIUM HEIST: TIME TO STEAL PROFITS?"🚨 XPD/USD "PALLADIUM HEIST" (BEARISH RAID EDITION) 🚓💰
⚠️ ATTENTION ALL BLACK-MARKET TRADERS, PROFESSIONAL THIEVES & RISK TAKERS! ⚠️
(Hola! Bonjour! Hallo! Marhaba!)
🔥 THE GREAT PALLADIUM DUMP IS ON! 🔥
Based on our 🦹♂️ Thief Trading Intel, we’re executing a BEARISH LAYERED HEIST on XPD/USD (Palladium). This is a high-risk, high-speed robbery—perfect for scalpers, swing bandits, and market fugitives!
🎯 HEIST STRATEGY (SHORT ENTRY PLAN)
🚨 ANY PRICE ENTRY – THIEF LAYERED LIMIT ORDERS! 🚨
Entry Zones (Flexible – Adjust Your Heist Layers!):
1st Layer: 1135.00 (Sneaky early entry)
2nd Layer: 1140.00 (Confidence booster)
3rd Layer: 1150.00 (Aggressive ambush)
(Add more layers if you’re a risk-loving outlaw!)
Pro Thief Move: Use multiple limit orders to scale in like a silent assassin—don’t rush, let the market come to YOU!
🛑 STOP LOSS (DON’T GET BUSTED!)
This is Thief SL @ 1180.00 (OGs know to adjust based on their own risk appetite!)
⚠️ WARNING: If price breaches 1180.00, ABORT MISSION! (Cops are waiting there!)
🎯 PROFIT TARGETS (LOOT & VANISH!)
1st Escape: 1080.00 (Quick cash grab before police arrive!)
Full Heist Target: 1060.00 (Major police barricade—escape before this!)
Scalpers: Take partial profits early & trail the rest like a true fugitive!
📉 FUNDAMENTAL BACKUP (WHY THIS DUMP WILL WORK)
📉 Weak industrial demand (Auto sector slowdown!)
💸 Strong USD pressure (Metals getting crushed!)
🛑 Supply gluts incoming! (More palladium = lower prices!)
🔗 Check COT reports, macro trends & news before raiding!
⚠️ WARNING: VOLATILITY TRAPS & POLICE BARRICADES!
Avoid high-impact news (CPI, FOMC, NFP)—cops set traps during these times!
Use trailing stops to protect stolen profits from sudden reversals!
💥 BOOST THIS HEIST! 💥
👍 Like & 🔄 Share to strengthen our criminal trading syndicate! More heists = More profits! 🚀💰
🚨 NEXT HEIST COMING SOON… STAY ON THE RUN! 🚨
📌 DISCLAIMER: This is NOT financial advice—trade at your own risk! Only steal what you can afford to lose! 😈🔥
#Palladium #XPDUSD #Commodities #TradingView #Bearish #ThiefTrading #RiskReward #MarketHeist