Palladium has established an up trend on the hourly
After 7 red days in a row & 3 red weeks, Fri saw an inside/doji HOD @ $660.35 that broke to the upside on the open last night.
In addition consolidated with a higher low on the Daily $652.15 and had previous support at that level in Sept
I am trying a swing for several days/possibly weeks, targeting 20DMA for starters @ $719.74 and will re-assess PA at that time.
Would feel better if Platinum came along, so far kind of stuck in the mud in comparison but green on the day as well.
Gold would certainly help both along as well one eye open on that progress during this trade but noting that Palladium has been known to have zero correlation w/gold at times this year like the Nov 4 - Nov 30th bull run. Seems more correlated w/copper as an industrial on that run... if precious metals happen to run same time look out ABOVE
Palladium


Gold - Platinum Spread IndicatorHere is an indicator developed specifically for the gold - platinum spreaders out there.
Platinum is much rarer than both gold and silver — so rare, in fact, that all of the platinum ever mined could fit into your living room.
Still filling mine.
Peace.
Tarzan

Russell 2000 SHORT Positions stay frostyIf you are SHORT the Russell 2000 from 1333.65, Technical Trailing Stop is 1323.44.
There is divergence showing (TrendCycle), possible pullback pending/pause of SHORT trend.

Palladium SHORT Swing TradePalladium XPDUSD SHORT Trade in progress, 4 hour chart technicals.
Trailing Stop Loss is at 761.91.

XPDUSD: Monitoring the declinePalladium has an interesting chart, and bullish potential. Right now there's an active 'Time at mode' signal which points to a 7 bar decline which is already active. The time and price target implies that we will see 600.556 hit by November 3rd or sooner. If that doesn't happen, we get a bullish signal.
There's already a bearish failure, since bears didn't manage to replicate the range of the decline that happened 3 days ago, so it's likely to see a reversal here.
Keep an eye on it. I'll update it once it's safe to go long.
Good luck,
Ivan Labrie.

Palladium portfolio reloach after or 150$ a contract return, i propose a small reenter on palladium but target now 880 ;)

XPDUSD: Palladium, long dips with stops under 691.16Palladium is offering great potential here, with odds of getting you into a long term uptrend if you go long next weeek.
Risk is a drop under 616.16, so buy dips and add on a breakout of last week's high with the same stop loss.
The long term chart shows potential for a quarterly/6-month timeframe uptrend signal, so this makes Palladium particularly interesting.
Good luck,
Ivan Labrie.


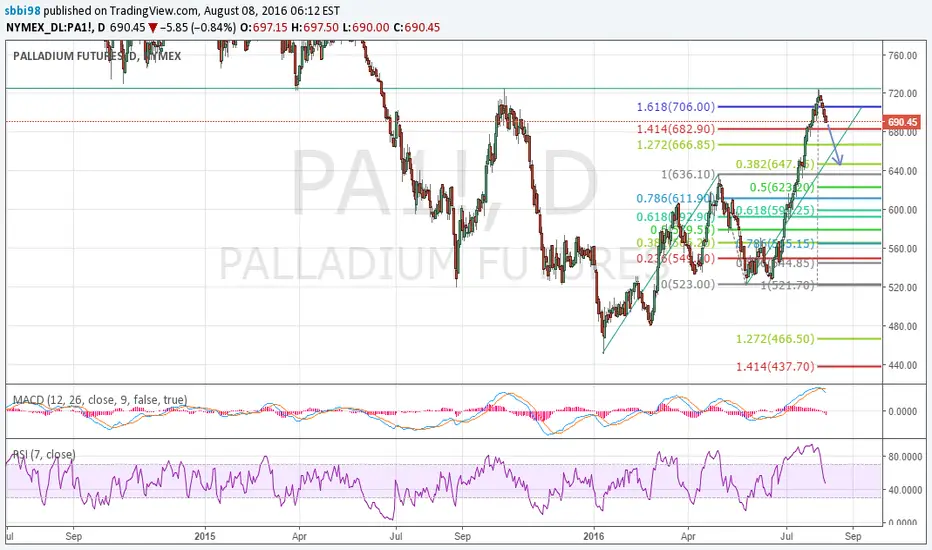
Bullish on PalladiumPalladium has broken out of a monthly downtrend and is in a strong up trend. However, this move can end anytime. Potential targets could be the 1.272 and 1.618 FE. Following a consolidation, it should give another move up.


Palladium vs GoldLong palladium. Explanations on the chart.
Another evidence for going long is in COT reports finviz.com
Pay attention to commercial hedgers and how previous top/bottoms of palladium coincide with hedgers' bottom/top respectively.
The good thing about palladium - it is not on radar.
Your suggestions would be appreciated.

Palladium looking to correct lower - Overhead resistance from the weekly DTL
- Invalidate if price broke above 650 and trade above the DTL
- Looking for an ABC wave lower and for price action to stay within this bearish down channel
- Weekly RSI is overbought - perhaps dead cat bounce is over now
- Retest of previous low is possible
- Caveat is palladium prices can be very volatile

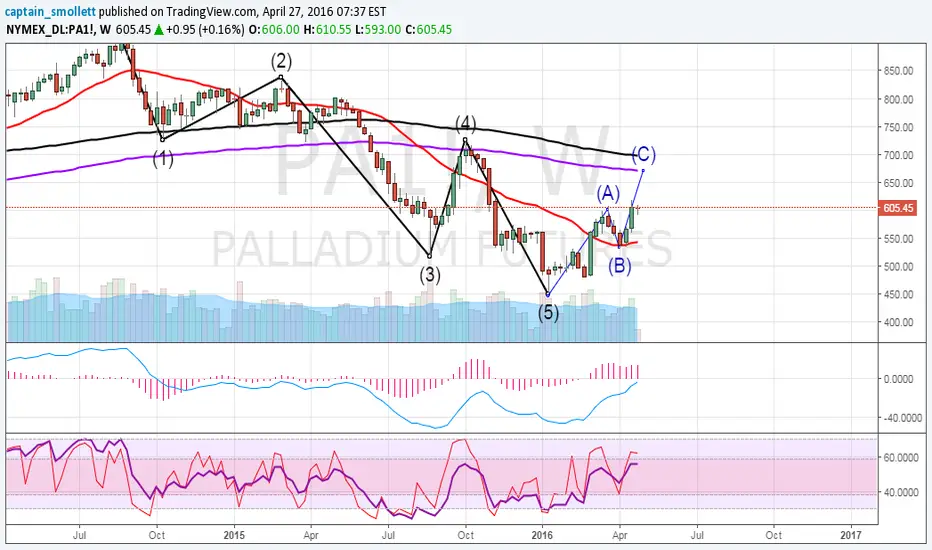
PA1. Palladium looks like a solid Buy optionPalladium futures are in a corrective Wave C according to my Wave counter. Broke Daily 200 MA and 200 WMA and looks like now have a clear path forward. Daily RSI may be slightly overloaded so there may be a short correction after the immediate ascending but the ending target of 680 figures looks very reachable.
On fundamentals, Palladium hasn´t forwarded the Gold rally therefore has a similar or bigger room to run. Also, looks like there may be a temporal shortage of a supply for this metal: www.metal.com
Buy: at current levels
SL: 580
TP1: 620
TP2: 650
TP3: 680
It's metal timeAll precious metals started a bull market a couple of months ago and they're consolidating. The difference with palladium which makes him more interesting than the others (silver, gold and platinum) is that he's the only one that hasn't made the golden cross: 50 over 200MA. I made a rough linear approximation and this should come somewhere in the middle of may. Please observe the behavior of the other metals when this situation occurred.
The Ichimoku proved to be useful as a support level in gold on the last drop, and it is the case here too. However I believe it is climbing too fast, so there will be some correction in the short term, but staying inside the pitchfork.
Good luck with your trades, and please share your comments.


Descending Channel on Palladium @ H4The descending channel pattern on H4 chart of XPD/USD provides a setup for a bullish breakout. The pattern's borders are shown with the yellow lines. The potential entry level - with the cyan line. The potential take-profit level - with the green line. Stop-loss is to be set to the low of the breakout bar (not shown on the chart).
More information, and an MT4 chart template can be found on www.earnforex.com

Palladium - Wedge for next movementChart shows everything but I'm on the short side of this commodity. Waiting a confirmation before entering a new position. But we could see a possible consolidation between 520 - 480


Palladium: Staging a rally from oversoldPalladium has a very interesting setup, I'm looking to enter longs in this instrument very soon.
If you can't trade palladium futures, you can trade PALL, the etf. Try to keep risk at 1% per trade.
The entry would be a buy stop confirming the rally, for specifics about entry, stop and trade management contact me privately.
You can trade with your own strategy, if your analysis matches mine as well.
Good luck!
Cheers,
Ivan Labrie.
