$70K Max Pain Expires Tomorrow - Sellers Don't CareBTC $66,100 | $70K Max Pain Expires Tomorrow. Sellers Don't Care.
February 19, 2026
Fear & Greed at 9. Seven days straight, no recovery. But today something shifted: taker buy ratio collapsed to 34.85%, sellers dominant for the first time this week. Price at $66,100, sitting 5.86% below tomorrow's Max Pain at $70,000. That gap is enormous for a same-day expiry. CALM regime, 80% confidence, vol still compressed. DVOL just jumped from 51 to 54 intraday. Something has to give tonight.
---
WHAT THE MARKET IS DOING
---
The tone shifted today:
1. Taker buy ratio at 34.85% -- sellers dominant. Two days ago: 60.8% (aggressive buyers). Yesterday: 51.99% (balanced). Today: 34.85%. Meaningful deterioration in intraday flow. Volume z-score is still -1.0, so this is quiet selling, not panic. But the direction changed.
2. ETF outflows of $133M. Bitcoin, Ether, and XRP ETFs are bleeding. Only Solana is bucking the trend. Four consecutive weeks of institutional outflows. The smart money isn't loading here, it's leaving.
3. The bear crowd is getting louder but losing credibility. Mike McGlone just walked back his $10,000 BTC target to $28,000 after public backlash. That's not conviction, that's noise. Meanwhile CoinTelegraph ran a "bottom signal that preceded a 1,900% rally" piece. When both extreme bears and extreme bulls are screaming at once, you're usually near a sentiment floor.
4. RSI approaching historic oversold territory. CoinDesk flagged BTC's 14-day RSI below 30 as "only the third time ever." Our 4H reading sits at 39.03 and falling. The signal is still developing, but the analog is there.
---
OPTIONS & DERIVATIVES
---
Tomorrow's expiry is running the show:
● DVOL at 54.0, rising +2.83 intraday from 51.17 open -- implied vol expanding fast
● Put/Call ratio at 0.751 -- still neutral, no panic hedging despite the drop
● Max Pain at $70,000 -- price at $66,100, gap is 5.86%. Expiry TOMORROW (20 FEB).
● 25-delta skew at +18.17 -- puts expensive (fear_puts_expensive)
● Put IV 89.71% vs Call IV 71.54% -- 18% premium for downside protection
Yesterday Max Pain was $68,000 (1.24% above price). Today it's $70,000 and we're 5.86% below it. For options market makers, they want price near $70K into expiry. That's a $3,900 move in 24 hours. Possible, yes. Likely without a catalyst, no. But the gamma dynamics create real upward pressure if anything flips sentiment tonight.
Rising DVOL (51 to 54) says the options market is starting to price in a move. Size and direction still unknown.
---
REGIME & TREND
---
Regime detector says: CALM, 80% confidence .
● Volatility regime: LOW (ratio 0.72x, z-score -1.37)
● Historical vol: 34.9% annualized, compressed
● Trend direction: DOWN, strength 0.36 (weak)
● ADX at 21.1 -- below 25, no confirmed trend
● SMA20 at $66,614, SMA50 at $67,098 -- price below both
Mean reversion, tight stops. Not a trending market. Three straight days of CALM at these vol levels -- the compression is becoming extreme. Low vol doesn't stay low. With DVOL rising and expiry tomorrow, the window for a sharp move is open.
---
TECHNICALS
---
BINANCE:BTCUSDT at ~$66,100 on Binance Futures.
● RSI(14) at 39.03 -- dropping toward oversold (was 41.98 yesterday), approaching the 40 floor
● MACD histogram at -35.37 -- contracting from -37.9 yesterday, second day of improvement
● Bollinger %B at 0.1419 -- bottom 14% of bands
● Price below VWAP ($71,099) -- 7.5% below institutional average cost
● ATR at 0.75% -- coil is tight
● Hurst at 0.2687 -- mean-reverting
One bullish signal: MACD histogram is contracting for the second day straight (-37.9 to -35.37). Histogram moving toward zero while price is lower is textbook early divergence, the same move that precedes bullish crossovers. It's not there yet. But RSI at 39 is falling fast, VWAP is 7.5% above, and sellers are in control. That divergence needs to hold and accelerate to mean anything.
---
MACRO ENVIRONMENT
---
Macro bias: RISK-OFF
● VIX at 20.04, +2.14% today but -3.75% on the week -- intraday uptick, weekly cooling trend intact
● SPX at 6,863.57, -0.26% today -- mild pressure, no crash
● DXY at 97.88, +1.03% weekly -- dollar trending up, headwind for crypto
● US 10Y yield at 4.09%, +0.32% today -- yields ticking up again
● Gold at $5,028, +0.84% today -- safe haven bid
● USDJPY at 154.98, +1.19% today -- yen weakening, carry trade back on
● SKEW index at 139.17, falling (-0.79% today, -2.34% weekly) -- tail risk hedging easing off
Macro is marginally better than last week. VIX off its spike, SKEW declining. But DXY keeps grinding higher, that dollar headwind isn't going away. USDJPY up 1.19% today suggests carry trades are back on, which usually means risk appetite. Gold bid at the same time says safe haven demand is also there. Contradictory signals, but the net macro read is still risk-off until DXY rolls over.
---
KEY LEVELS
---
Support:
● $65,931 -- Bollinger lower band
● $65,500 -- swing low area
● $65,000 -- psychological, major demand zone
Resistance:
● $66,614 -- SMA20 / Bollinger middle (immediate, just above)
● $67,098 -- SMA50 (needs reclaim for any bullish structure)
● $68,000 -- prior congestion
● $70,000 -- Max Pain, expiry magnet tomorrow
● $71,099 -- VWAP (major institutional level)
---
THE SETUP
---
Bias: CAUTIOUS. Watch the taker buy ratio.
If taker buy recovers above 50% into tonight's session, the Max Pain squeeze thesis becomes real. $70K is the target, but the first stop is SMA50 at $67,098.
Entry zone (long): $65,900-66,200 (lower Bollinger support)
Targets:
● T1: $67,098 (SMA50, +1.5%, R:R ~1.5:1)
● T2: $68,500 (+3.6%, R:R ~3.5:1)
● T3: $70,000 (Max Pain, +5.9%, R:R ~6:1)
Stop: $65,400 (below lower Bollinger and support, -1.1%)
If taker buy stays below 40% through today's session, lower Bollinger at $65,931 gets tested, then $65,000. Don't chase longs above $67,000 until the taker buy ratio confirms. The 34.85% reading is the most important number to watch right now.
---
RISKS
---
● Taker buy at 34.85% -- first time sellers dominant this week
● Max Pain gap at 5.86% is too large to expect full convergence without a catalyst
● ETF outflows $133M -- four straight weeks of institutional selling
● DVOL rising (51 to 54) -- vol expansion cuts both ways
● DXY grinding higher (+1.03% weekly) -- dollar headwind stays
● RSI at 39 and falling -- oversold not reached yet, more room to drop
● Max Pain at $70K only matters until tomorrow. After expiry, the gravity disappears entirely.
---
BOTTOM LINE
---
$70,000 Max Pain with expiry tomorrow is the strongest structural case for a squeeze. But the market is selling, not buying. Taker buy at 34.85%, ETF money walking out the door, and a 5.86% gap that doesn't close on its own. This isn't capitulation -- CALM regime, no volume spike, MACD histogram slowly turning positive. Just quiet, persistent selling.
The MACD divergence is the one thing to watch: histogram contracting two days running while price makes new lows. If that holds and accelerates, it's the setup for a bullish crossover and the squeeze into expiry. If sellers press and taker buy stays below 40%, $65,900 is next.
Two numbers today: taker buy back above 50% means the squeeze is on. MACD histogram continuing to contract toward zero means the reversal is building. Wait for both before sizing in.
Manage your risk. NFA.
---
Data collected February 19, 2026, 16:00-16:10 UTC.
Panic

Extreme Fear Week Seven — Calm Market Coiling Before The MoveBTC $67,165 | Extreme Fear Week Seven — Calm Market Coiling Before The Move
February 18, 2026
Fear & Greed at 8. Seven straight days of extreme fear. But here's what the market won't tell you: volatility is collapsing (z-score -1.57), regime is CALM with 80% confidence, and Hurst exponent at 0.27 screams mean-reversion. The options market is loaded with expensive puts (skew +20.56), Max Pain sits at $68K pulling price up, and VIX just dropped 7.84% today signaling macro stabilization. This isn't capitulation. This is compression.
---
WHAT THE MARKET IS DOING
---
It's textbook fear, but the action says otherwise:
1. Fear & Greed at 8 for seven days straight. Range over the past week: 5-12. This is the kind of extreme reading that historically marks bottoms. Feb 12 hit 5 — the absolute floor. Since then, we've been hovering in extreme fear territory while price holds structure.
2. BTC is sitting in the lower third of Bollinger Bands. Price at $67,165, Bollinger %B at 0.191 (lower third). The bands are 1.98% wide — low volatility compression. ATR at 0.82% says this market is asleep, not panicking.
3. Hurst exponent at 0.2731. This is a mean-reversion regime. H < 0.5 means trends reverse, they don't persist. The current weakness is fighting against the regime — statistically, it's temporary.
But the technicals are mixed. MACD is bearish (-160.88 below signal -122.98), histogram at -37.9 and expanding. RSI at 41.98 — neutral with slight oversold lean. This isn't capitulation; it's a slow grind with buyers and sellers balanced (taker buy ratio 51.99%).
---
OPTIONS & DERIVATIVES
---
The options market is telling you something important:
● DVOL at 51.68, stable — implied vol in normal range, no panic
● Put/Call ratio at 0.7389 — neutral, no hedging stampede
● Max pain at $68,000 — we're 1.24% below, gravity pulls up into expiry (19 FEB)
● 25-delta skew at +20.56 — puts are expensive relative to calls (fear_puts_expensive)
● Put IV 86.66% vs Call IV 66.10% — market paying 20% premium for downside protection
Translation: options traders are nervous (skew shows fear), but they're not positioned for a crash (PCR is neutral). The skew is a contrarian indicator — when everyone buys puts, the move often goes the other way. Max Pain at $68K creates a magnet effect into tomorrow's expiry.
Taker buy ratio at 51.99% — perfectly balanced market orders. At Fear 8, you'd expect capitulation selling (<45%). Instead, it's neutral. Nobody is panic selling.
Funding rate data: no extreme readings (normal range).
---
REGIME & TREND
---
Regime detector says: CALM, 80% confidence .
● Volatility regime: LOW (ratio 0.66x, z-score -1.57)
● Historical vol: 35.1% annualized — below normal
● Trend direction: DOWN, but strength only 0.24 (very weak)
● ADX at 20.6 — no real trend, market is sideways
● SMA20 at $67,531, SMA50 at $67,858 — price slightly below both
The regime recommendation: mean reversion with tight stops. This is not a trending market — it's compressed and range-bound. Breakout trades get chopped. Dip-buys at lower Bollinger ($66,863) have better odds.
The critical insight: CALM regime + low vol (-1.57σ) = compression before expansion. Low volatility doesn't last forever. When it breaks, it moves fast.
---
TECHNICALS
---
BINANCE:BTCUSDT at ~$67,165 on Binance Futures.
● RSI(14) at 41.98 — neutral, slight oversold territory
● MACD histogram at -37.9 — bearish and expanding
● Bollinger %B at 0.191 — lower third of bands (near support)
● Price below VWAP ($71,852) — 6.5% below institutional average cost
● ATR at 0.82% — extremely low daily range, vol compression
● Hurst at 0.2731 — mean-reverting regime, anti-trend
The conflict: MACD is bearish, price below VWAP (sellers in control), but RSI neutral and Hurst screaming mean-reversion. This looks like a dip in a range, not the start of a trend. Price in lower third of Bollinger with low ATR = coil before bounce.
Watch for MACD histogram to start contracting (move toward zero). That's the early divergence signal before bullish crossover.
---
MACRO ENVIRONMENT
---
Macro bias: RISK-OFF, but stabilizing
● VIX at 18.70 today, down 7.84% intraday — fear spike reversing
● VIX still up 5.95% on the week — elevated but cooling
● SPX at 6,898, down 0.62% weekly — mild correction, not crash
● DXY at 97.52, up 0.61% weekly — mild dollar strength, not aggressive
● US 10Y yield at 4.07%, down 0.8% weekly — flight to safety unwinding
● Gold at $5,020, up 1.96% weekly — safe haven still bid
● USDJPY at 154.49, up 0.79% weekly — carry trade stable
● SKEW index at 140.28 — elevated tail risk hedging (>130)
Asia markets weak: HSI -1.76%, Nikkei -0.86% weekly. Risk-off still present.
The macro setup was bearish earlier this week (VIX spiking, SKEW >140), but today VIX dropped 7.84% — first sign of stabilization. Dollar not aggressively strengthening (+0.61%). Yields falling but not crashing. This is risk-off lite, not full panic.
Key point: when macro is this bad and Fear & Greed is at 8, the contrarian trade often works. Just needs a catalyst.
---
KEY LEVELS
---
Support:
● $67,165 — current price
● $66,863 — Bollinger lower band (mean-reversion entry zone)
● $67,531 — SMA20 (dynamic support)
● $66,000 — psychological level, major demand zone
Resistance:
● $67,858 — SMA50 (reclaim needed for bullish structure)
● $68,000 — Max Pain (magnet into 19 FEB expiry)
● $68,199 — Bollinger upper band
● $71,852 — VWAP (institutional level, major resistance)
---
THE SETUP
---
Bias: NEUTRAL-BULLISH (mean-reversion play)
This is not a trend reversal. This is a mean-reversion bounce in a ranging, CALM market with extreme fear.
The confluence:
● Fear & Greed 8 for seven days (contrarian buy signal)
● CALM regime + mean-reversion (Hurst 0.27)
● Price in lower third of Bollinger (%B 0.19)
● Max Pain at $68K (+1.24%) pulling price up into expiry
● Low vol compression (ATR 0.82%, z-score -1.57) = coil before move
● VIX down 7.84% today (macro stabilizing)
● Taker buy ratio balanced (51.99%) — no panic selling
Entry zone (long): $66,800 - $67,200 (current area + lower Bollinger support)
Targets:
● T1: $68,000 (Max Pain, +1.2%, R:R ~2:1)
● T2: $68,500 (upper Bollinger area, +2.0%, R:R ~3.5:1)
● T3: $69,500 (psychological, +3.5%, R:R ~6:1)
Stop: $66,500 (below lower Bollinger and support, -1.0%)
Size: 1-2% risk (tight stop in CALM regime allows normal sizing despite risk-off macro)
Important: This is a mean-reversion trade in a ranging market, not a bull trend initiation. Take profit aggressively at T1-T2. Don't hold longs above $69K without confirmation of VWAP breakout.
---
MEDIUM-TERM VIEW
---
If Fear & Greed stays below 15 for another 3-5 days while price holds above SMA50 ($67,858), this sets up a powerful bullish divergence — sentiment at the floor while price holds structure.
Signals for medium-term long:
1. F&G <15 for 7+ consecutive days (currently day 7)
2. Price holds above SMA50 ($67,858)
3. MACD bullish crossover (watch histogram contraction first)
4. VWAP reclaim ($71,852) with volume
Until then — short-term mean-reversion trades.
---
RISKS
---
● Macro risk-off still active — VIX cooling but SKEW >140, HSI/Nikkei weak
● Options expiry 19 FEB — Max Pain gravity ends after expiry, new dynamics
● Low volume environment — volume z-score -0.39, no aggressive buyers
● VWAP resistance at $71,852 — strong institutional selling wall
● Volatility breakout risk — CALM regime can break violently in either direction
---
BOTTOM LINE
---
Fear & Greed at 8 for seven days. CALM regime with collapsing volatility. Mean-reversion Hurst at 0.27. Price in lower third of Bollinger with tight ATR. Max Pain pulling up. VIX cooling. This is not capitulation — this is compression.
The setup: mean-reversion long from current levels targeting $68-69K. Not a trend reversal, just a bounce in a range. Take profit aggressively. Size conservatively (risk-off macro). Don't hero-long above $69K without VWAP reclaim.
If fear holds another week with price structure intact, the contrarian rally will be violent.
Manage your risk. NFA.
---
Data collected February 18, 2026, 17:00-18:00 UTC.

OVER-valued and UNDER-valued levels on the Bitcoin Daily chartBitcoin is fundamentally strong.
A healthy correction took place before the next BULL RUN (1y)
Due to dollar printing and QE programs, FIAT currencies are losing value worldwide. Now is the time to accumulate, on the spot market (not through ETFs).
Based on MemPool data, the Bitcoin network load is low, consistently below 10 sat/vB.
Source: mempool.space

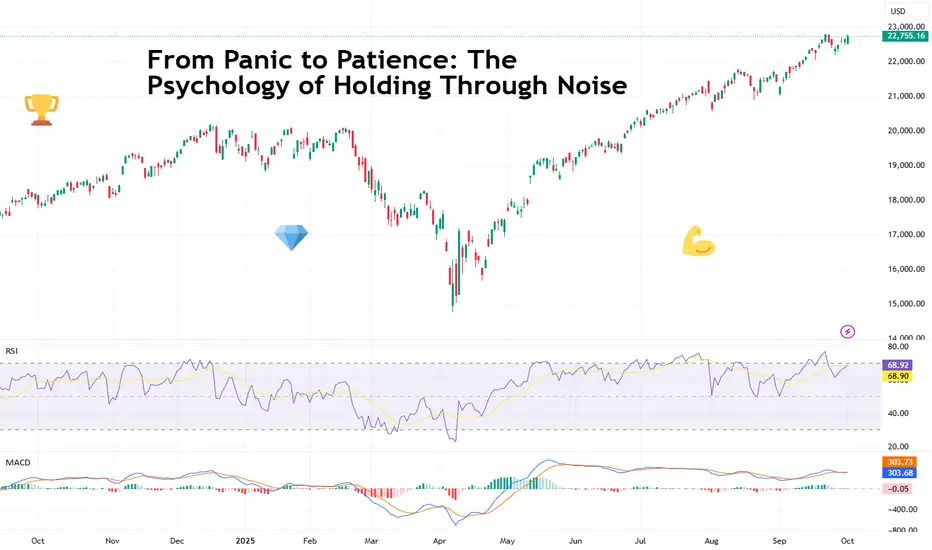
From Panic to Patience: The Psychology of Holding Through NoiseMarkets can be a noisy place. Screens flash, feeds scroll, and your cousin won’t stop texting you with urgent stock tips.
Yet if you zoom out, the difference between traders who burn out and traders who build wealth often comes down to one underrated skill: the ability to hold.
Not forever, of course, and not in ignorance. But to hold through the chatter, the dips, and the occasional headline apocalypse without throwing your strategy in the bin.
Let’s talk about how patience beats panic, and how you can keep your head when all about you are losing theirs .
📉 Why Panic Is Easy
When a chart turns red, our lizard brains scream louder than Jim Cramer on Nvidia NASDAQ:NVDA day. Humans are wired to avoid loss more than to seek gain — a concept called loss aversion. Especially during events from the Economic calendar or the Earnings calendar — nasty surprises can tilt you off kilter.
In trading terms, losing $1 hurts twice as much as making $1 feels good. That’s why you’ll often see people bailing at the first sign of trouble, only to watch prices reverse and rally without them.
But most “market crises” are just noise. If you zoom out, markets wobble, shake, and zig-zag before resuming their long-term trend. But panic-selling is a reflex, and unless you train yourself out of it, it’ll cost you over and over.
⏳ The Patience Premium
Patience in trading isn’t granted — it’s a superpower. Think of it as the compounding effect of discipline. When you resist the urge to sell into weakness or chase into strength, you give your trades time to play out according to your thesis instead of your emotions.
This doesn’t mean becoming a bagholder or marrying a bad stock. It means knowing the difference between short-term volatility and a true trend reversal . Spoiler: they’re not the same thing.
Warren Buffett (obligatory Buffett quote) once said the stock market is a device for transferring money from the impatient to the patient. In other words: the longer you can wait without flinching, the better your odds.
📰 The Problem with Market Noise
Every week brings a new villain: tariffs, inflation, “this time it’s different” chatter. But most of the time, these events don’t destroy trends — they just shake weak hands out of positions.
Think back to April’s tariff shock . Bitcoin BITSTAMP:BTCUSD dipped, stocks slid, headlines screamed.
Not even a week later, the Nasdaq Composite NASDAQ:IXIC vaulted higher by 12% for its best day in 24 years.
A few months later, markets not only recovered but ripped to new highs . The traders who panicked out at the bottom? They locked in losses. The ones who sat tight with a plan? They got paid.
🧘 Training the Trader’s Mind
You can’t mute the market, but you can build a mindset that handles it better. Start by reframing volatility. Instead of “Oh no, my position is doomed,” think “Let’s see if my thesis remains valid, or I’ll consider bailing.”
Other tips:
• Position sizing . If you’re too heavy in one trade, every tick feels like life or death. Keep sizes reasonable, and the noise gets quieter.
• Set rules in advance. Decide your stop-loss and target before you hit buy. That way, you’re not making panicked choices mid-storm.
• Practice detachment. It’s not your stock. It’s a trade. Don’t let ego glue you to every uptick.
These aren’t hacks; they’re habits. Build them, and noise turns from overwhelming to manageable.
🎢 The Cyclical Nature of Stress
Holding through noise isn’t just about one bad week — it’s about recognizing that markets move in cycles. Bull runs, corrections, consolidations… rinse, repeat.
When you’re in a correction, it feels endless. When you’re in a rally, it feels invincible. Neither is true. Both will pass. Your job isn’t to predict every twist, but to ride the broader wave without getting tossed by every splash.
This is why seasoned traders talk less about “calling tops” and more about sticking to process. Trends matter more than headlines.
💡 Patience ≠ Blind Holding
Let’s clear something up: patience doesn’t mean diamond-handing garbage stocks to zero. It means sticking to positions where your thesis still holds. If the fundamentals or technicals break, you cut it. If the only thing that’s breaking is X’s collective sanity, you hold.
The art is knowing the difference — and that’s what separates a patient trader from a stubborn one.
🔑 From Panic to Patience in Practice
So how do you go from reactive panic to steady patience? Try this framework:
• Zoom out — Look at the weekly or monthly chart before you sell on a 15-minute candle.
• Check the plan — Does your original thesis still make sense? If yes, why exit?
• Limit your exposure — Never risk so much that a drawdown keeps you awake.
• Reframe the noise — Headlines pass. Trends endure.
That’s the difference between panic selling and strategic holding.
🎯 Bottom Line
Holding through noise is as much psychology as strategy. It’s about resisting the knee-jerk sell, trusting your process, and understanding that volatility is part of the game. The traders who master patience don’t just survive noise — they profit from those who can’t handle it.
So next time the S&P 500 heatmap lights up red, ask yourself if this is the end of it, or just another chapter in the endless saga of market drama? More often than not, it’s the latter.
Off to you : What's your strategy when you need to filter the noise out? Share your thoughts in the comment section!
So here’s what I’m doing: Not Panicking.This analysis is provided by Eden Bradfeld at BlackBull Research.
Listen, the US has survived the depression of WWI, the Great Depression, the depression of WWII, oil shocks, the dot com bubble, the GFC, the COVID-sell off. It’ll likely survive this.
In the scope of history, that $1 survived very well indeed. Panicking and running for the hills does not do so well. Winston Churchill was a great and flawed man but a terrible investor; he bought and sold shares prior to the 1929 crash in such speculative investments as mining companies, railways, and so on — most of them lost money (hence why Churchill continued to write at such a pace — to fund his Champagne-and-spec stock lifestyle). Hetty Green, on the other hand, (known as the “Queen of Wall Street”, managed to do very well her time — her quote?
I buy when things are low and no one wants them. I keep them until they go up, and people are crazy to get them.
Now, that’s something I can get behind.
Nobody wanted Meta a few years ago. I wrote an internal memo, close to its plummet in ‘22 (it got to $99 or so a share!). I wrote this:
ii) Yet what if we were to tell about about a company with this set of heuristics? Let’s call it “Company A”
Company A has a 31% return on equity and a 20% return on capital.
It has a net income margin of 37% and a FCF margin of 21%
Its income has a compounded annual growth rate over the last 5 years of 41%
If we add in numbers, now, let’s say the net income for 2020 was $29 billion, and $10 billion of that was used to repurchase stock from shareholders?
Let’s say the unlevered FCF is around $6 billion per quarter, and let’s say the debt to equity ratio is about 9x.
In other words, Company A is grows at a quick clip, and has done sustainably for the majority of its life. Its return on capital and return on equity would make any investor happy. Its FCF is an absolute machine.
Would you buy Company A?
Company A was Meta . You would’ve roughly made 4x or 5x’d your money if you’d bought around then. The point is, the fundamentals of a business matter, and right now there a quite a few exceptional businesses with good fundamentals trading at a good price. Alphabet (Google) trades at ~16x earnings. LVMH trades at ~18x earnings. And so on. Brown-Forman trades at ~15x earnings. These are all “inevitables” — Google will continue to be a dominant advertising platform, LVMH will continue to sell luxury, and Brown-Forman will continue to sell Jack Daniel’s and so on.
I talked to my ma in the weekend. She is not really a share person. Her portfolio is a bunch of “inevitables”. It’s done very well. She said “aren’t you worried about this stock market?”, and I said “You love supermarket shopping, Mum. If you see something at a 25% discount you buy it. You come home, and you’re delighted that you found some mince on special²”
She was like, “oh, that makes sense”.
The problem is you have a lot of people looking at charts and catching worry that the world will end. The world, I am delighted to say, has a magnificent disposition to carry on.

Financial Apocalypse? Markets Crash as Billions Flow into Cash –A New Wave of Market Turbulence: How Trade Wars and Uncertainty Affect Investors
The US stock market is currently undergoing a massive sell-off, which analysts compare to previous financial crises. Both institutional and retail investors are actively exiting equities and high-risk instruments, including cryptocurrencies. The accumulated anxiety is driven not only by the global economic cycle but also by specific political decisions: trade wars and protectionist measures are putting significant pressure on corporate earnings and market expectations.
Early Signs: Tariffs and Escalation
When Donald Trump announced increased tariffs on imports from China a few years ago, the stock market reacted sharply but briefly. Many analysts hoped the tensions would turn out to be short-lived negotiating tactics. Ultimately, however, the trade confrontation evolved into a prolonged phase, affecting not only the US and China but also European partners.
Today we see a continuation of this policy, where new restrictions and tariff threats have been added to the previously introduced measures. This has prompted capital outflows and increased uncertainty, as global supply chains have come under question, and the prospects for global trade recovery are murky.
Parallels with the 2008 Crisis
Comparisons to 2008 are inevitable due to the scope and speed of the drop in stock prices. However, while the primary trigger in 2008 was the collapse of the subprime mortgage market and the banking sector, the current negative factors lie in the realm of trade and geopolitical tensions.
Leading companies' financial results are declining because of rising costs for raw materials and logistics due to mutual tariffs. Global demand is weakening, and heightened instability is causing management teams to cut back on investment programs. All this is reflected in stock market indices, which continue to lose several percentage points in a single trading session.
Buffett’s Role and the Cash Accumulation Strategy
Warren Buffett, one of the largest and most conservative investors, prepared for such a scenario by amassing an unprecedented amount of cash. Buffett’s approach does not involve “catching a falling knife” at the peak of panic, but as soon as the situation stabilizes or compelling long-term opportunities arise, he will likely begin buying undervalued assets.
This strategy is typical for major players who focus on fundamental indicators. They are not looking at short-term fluctuations but rather the potential gains when the market recovers and prices return to fair value.
Cryptocurrencies: Expectations vs. Reality
Many assumed that cryptocurrencies would serve as a haven during crises. However, experience shows that in periods of global uncertainty, risk-averse investors exit digital assets alongside everything else. Bitcoin and Ethereum have lost 20–30% since the latest “flare-ups” began, and even statements about a “national bitcoin strategy” have so far failed to influence their prices.
Meanwhile, fundamental factors—limited supply, the development of blockchain technology, and IT-sector interest—have not disappeared. These arguments gain traction when investors’ risk appetite returns. But when the market is dominated by fear of further declines, they tend to avoid risky trades and prefer liquid, proven instruments.
Where the Money Goes
Unlike previous downturns, capital has not rushed into gold. While gold prices reached their peak a few weeks ago, their growth has since slowed, as some investors opt to keep their funds in cash, considered the safest choice.
Such behavior may suggest that the sell-off is nearing its climax: when capital remains “on the sidelines,” it eventually starts seeking new opportunities—whether in bargain-priced shares of large industrial giants, the tech sector, or even the cryptocurrency market with its depressed valuations. The volume of outflows from the US stock market is colossal; over the last couple of weeks, the total market cap of leading indexes has fallen by several trillion dollars. It is expected that a substantial portion of this money will re-enter the market, though likely redistributed among different asset classes.
Medium- and Long-Term Outlook
Investors with a six-month or longer horizon often see the current levels as potential entry points. Historically, global conflicts and economic crises end sooner or later, opening opportunities for those who can tolerate temporary volatility.
However, short-term trading remains extremely risky: as uncertainty persists, we may see more waves of sell-offs that knock out speculators with weak nerves or insufficient liquidity. During such moments, those who remain disciplined and steadfast can find profitable opportunities.
Conclusion
Today’s financial market conditions stem from a convergence of factors: aggressive trade policies, geopolitical risks, and the natural winding down of certain economic cycles. The mass sell-off of stocks and cryptocurrencies indicates that investors are unwilling to take on new risks until tariff disputes calm down, a clearer picture emerges for corporate profits, and major economic centers reach some form of agreement.
Nevertheless, the market retains its cyclical nature: historical parallels show that after the steepest drops, recovery periods often follow. The only question is when the turnaround will occur and who will be the first to capitalize on it.

That's the Way the Bitcoin TumblesWhy I Think the Sell-Off Isn’t Over Yet
Bitcoin is already in the middle of a sharp sell-off, but at least half the market seems convinced the worst is over and that a recovery is underway. I don’t see it that way. Bitcoin has been grinding sideways into the Bollinger Bands on the weekly chart, and now that it’s finally colliding with the basis lines, I think it’s about to plunge straight through them. This doesn’t look like a market that’s ready to bounce—it looks like one that’s about to take another leg down. Maybe I’m wrong, maybe I’m early, but in my experience, when people start celebrating too soon, things tend to get a whole lot worse.
CRYPTO:BTCUSD
CRYPTOCAP:BTC
CME:MBT1!
CME:BTC1!
CRYPTO:MOBILEUSD
COINBASE:RNDRUSD
CRYPTO:SHPINGUSD
CRYPTO:FXUSD
CRYPTO:ALEOUSD
CRYPTO:HONEYUSD
COINBASE:ACSUSD
CRYPTO:ASMUSD
CRYPTO:BATUSD
CRYPTO:FILUSD
CRYPTO:VTHOUSD
CRYPTO:B3USD
As always, this is not investment advice, any trade you make is on you, because good golly Miss Molly, I got my own things to worry about.

ETH – What Happened? A Detailed Breakdown and What to do next!Crypto Panic or Manipulation? Breaking Down Ethereum’s Crash and the Entire Market
🔥 Hello everyone, this is Ronin!
The last two trading days have seen one of the biggest crashes in the history of the cryptocurrency market. 📉 We witnessed a massive wave of liquidations that burned through the capital of many traders.
Looking at the numbers:
Most assets lost 10–30% of their value.
Some altcoins dropped by 50%.
The total crypto market capitalization shrank by more than 10% in just a few days.
But the biggest victim of this crash was not Bitcoin, nor low-cap altcoins—it was Ethereum (ETH) itself.
What Happened to Ethereum? Why Did It Drop from $3600 to $2000?
If we talk about the strangest asset in this cycle, Ethereum stands out.
While other coins were breaking all-time highs, ETH didn’t even come close to its peak valuation. This is despite:
The launch of Bitcoin ETFs, bringing in a wave of institutional capital.
News that Donald Trump was reportedly buying ETH for his projects.
Growing interest in L2 scaling solutions and Ethereum network upgrades.
None of these bullish catalysts helped ETH break even $4000.
And then, within just four days, Ethereum plunged from $3600 to $2000. On Binance’s futures market, the price briefly hit $2080.
❓ Has Ethereum ever seen such a sharp drop before?
Personally, I don’t remember such a massive drop happening in such a short time without catastrophic fundamental events.
This wasn’t a network hack, a mining ban, or a major DeFi collapse—nothing fundamentally bad happened.
So who crashed the market, and why?
Who Benefited from This Crash?
Let’s analyze the key question: who had the most to gain from this crash?
The obvious answer is that the biggest winners were major crypto exchanges and market makers.
Why Didn’t Bitcoin Drop as Much?
At the time of the crash:
📌 Bitcoin’s liquidation zones were nearly empty. Many traders had both buy and sell orders in place, so there was no strong incentive to push BTC down.
What About Ethereum?
📉 ETH futures open interest exceeded tens of billions of dollars.
📉 Leverage was heavily skewed towards long positions, meaning liquidations brought massive profits to exchanges.
📉 ETH’s open interest was even higher than BTC’s, making it a prime target for manipulation.
How Crypto Exchanges Made $2 Billion in One Night
The cryptocurrency market is unique because the major players not only provide liquidity but also profit from liquidations.
💰 Crypto exchanges are not just trading platforms—they are global market makers who actively move prices.
📌 On Sunday night, the following happened:
Big players spotted an overloaded leverage in ETH long positions.
They triggered a wave of sell-offs, forcing liquidations.
On Binance alone, exchanges raked in $2 billion in a single day from liquidations.
⚠ Ask yourself this: if you had the power to make $2 billion in a single day, wouldn’t you do it?
Of course, they want to and they do.
How the Smart Money Strategy Works
If you’ve heard of Smart Money trading strategies, you know that big players always think ahead.
📌 The classic scheme:
1️⃣ Pump the market up—give traders confidence that the rally will continue.
2️⃣ Open short positions in zones overloaded with leverage.
3️⃣ Dump the market sharply, triggering stop losses and liquidations.
4️⃣ Buy back at the bottom, raking in billions.
📉 This is exactly what happened with Ethereum—exchanges used a false news narrative about trade sanctions to tank the price.
How I Survived This Crash
🔥 I was long on Ethereum with leverage and held a total position of over 200 ETH.
Honestly, that night was brutal.
📌 When the price dropped to $2080, I had two options:
❌ Panic and close the position, taking a six-figure loss.
✅ Hold and wait for a recovery, because I knew this was a fake move.
I chose the latter. Not only that—I added to my position at the lower levels.
This doesn’t mean the market can’t drop further, but…
📌 Trading rule: Buy when everyone is selling—Sell when everyone is buying.
📌 Right now, the market is in panic mode—which means some smart players are accumulating ETH at these prices.
Conclusion: What Comes Next?
📌 This was an artificial correction—big players intentionally crashed the market.
📌 The coming days should see a recovery, especially if trading volumes start picking up again.
📌 Market psychology is the key factor. When everyone is afraid, that’s when big players accumulate assets.
If you’re interested in how I will navigate my $200,000 ETH drawdown, follow me on TradingView—I’ll be posting regular updates.
🚀 In upcoming articles, we’ll break down the analysis of other altcoins and provide a microeconomic perspective on the most promising assets.
💬 Boost this post if you found it insightful—your engagement helps, and a little positive activity never hurts!
This was Ronin—stay tuned for more updates! Big things are coming. 🎯

Understanding Gold Panic Selling Reactions BetterThis video is designed to help you better understand how Gold works as a hedge instrument and how to attempt to measure Panic Selling phases in Precious Metals.
Metals offer an incredible opportunity when Panic Selling hits. But it can also present some very real risks because of price volatility.
Panic selling in the markets is usually an event-driven sell-off in almost all markets (including metals).
This type of selling is usually related to traders pulling assets (CASH) away from all market sectors because of some crisis or geopolitical event. It is a way for traders to react to the fear of the event while sometimes ignoring how metals will react to the future revaluation event.
Yet, who wants to hold Gold when it may fall 8.5% to 15% throughout this panic selling process?
If you learn how to spot the base/bottom efficiently (using my Excess Phase Peak patterns), you'll be able to pinpoint some incredible opportunities in metals.
I hope this video helps you to understand exactly how these Panic Selling events unfold - and lear to spot/trade them more efficiently.
The reality of the current market environment is that the Trump win is the event (call it a crisis or not - I don't care). This event is causing markets to revalue current asset classes (notice the strength of the US Dollar since Election Day).
I believe this revaluation event is nearly over and prices will begin to adjust into what I'm calling my "Anomaly Event" - where price levels settle back into a reversion (normal) type of contraction event before moving into a late-stage Santa Rally.
If I'm right, we'll see a base/bottom in metals happen after November 15-19, 2024.
Get some.
#trading #research #investing #tradingalgos #tradingsignals #cycles #fibonacci #elliotwave #modelingsystems #stocks #bitcoin #btcusd #cryptos #spy #es #nq #gold

BTC - Make or Break Zone!Hello TradingView Family / Fellow Traders. This is Richard, also known as theSignalyst.
📈 After rejecting the $70,000 round number, BTC has been overall bearish trading within the falling channel marked in red.
Currently, BTC is hovering around the lower bound of the channel which is lining up perfectly with the $50,000 round number.
🏹 The highlighted blue circle is a strong rejecting area to expect the bulls to kick in from.
📉 However, if the $50,000 fails to hold, a bearish continuation towards the $40,000 demand zone would be expected.
Which scenario do you think is more likely to happen and why?
📚 Always follow your trading plan regarding entry, risk management, and trade management.
Good luck!
All Strategies Are Good; If Managed Properly!
~Rich

Psychology: Trade Smart - Focus on Facts, Not wishes!See the Truth: Trading Without Bias
Discover the critical importance of objective analysis in trading.
Learn how to avoid emotional biases, stay neutral, and focus on what the market truly shows you. This guide will help you improve your trading strategies and achieve more consistent results.

Lessons of Trading by News - MMTC - "Let it" or "Delist it" ???Time and again the stock market gets some knee jerk reaction from Investors based on some Hot News. But most news are shortlived and forgotten in forthcoming days.
One such interesting counter is MMTC - A PSU Mineral Trading Company with 89% stake with Govt of India.
Technical Analysis:
Monthly - Inverted Head and Shoulder pattern indicating a Multi-bagger return
Our initial position was at 61.55 levels and booked profit around 87-88 in just 1 month
The primary reason to book profits was due to a Hot News in October from Govt that they are going to De-list the company. The counter eroded all gains within same month and fell below our entry point. For next 2 months - there is no News about de-listing - no progress - and all the Hype settled down and now when I look at the charts - its back to its beauty. You won't even remember that something happened in Oct looking at the chart now.
The Original Tech pattern (Inv H&S) is still perfectly intact
MMTC is once again on the verge of Breaking Out the Inv H&S pattern.
It has to settle above 68 WCB for neckline BO confirmation
Further it also has to close above 72 WCB for resistance BO and further upside
CAUTION: New Entrants / Safe Players - please AVOID this counter. There is still no clarity on delisting process from Govt. Existing players hold for further gains and make most out of this until you see a significant reversal
Disclaimer:
Stocks-n-Trends is NOT a SEBI registered company. We do not provide Buy / Sell recommendations - rather we provide detailed analysis of how to review a chart, explain multi--timeframe views purely for Educational Purposes. We strongly suggest our followers to "Learn to Ride the Tide" and consult your Financial Advisors before taking any positions.
If you like our detailed analysis, please do rate us with your Likes, Boost and share your comments
-Team Stocks-n-Trends

Metals Setup Apex "V" (PANIC) Bottom - Rally Will ContinueGold and Silver are setting up a nearly perfect deep "V" bottom after a bout of PANIC selling over the past few weeks. This sets up a move for Gold to rally above $2250 and Silver to rally above $28.50.
Ultimately, I believe Gold will exit the Setup Phase and peak in the next phase, the Breakaway Phase, above $2450. Silver will follow with a rally to levels above $31 as it moves away from the Setup Phase and peaks in the Breakaway Phase.
These are big moves for Gold and Silver - 15% to 25% or more.
This also sends a clear message to the general/global markets that traders are hedging the uncertainties of the conflicts and the central bank/global economy credit issues. I see the next 14 months, before the US POTUS elections (Nov 2024) and possibly a few months beyond, as very concerning for the US/Global markets.
Where will the economic growth come from to drive expansion? China is contracting. Asia is contracting. Europe is contracting. The US is still operating reasonably well, considering much higher interest rates. Canada is still holding up okay, considering an extremely over-inflated asset bubble.
How long before something breaks if the US Fed decides enough is enough and moves to PAUSE rate hikes?
I guess we won't see a pause in the US Fed until possibly May/June 2024. And that will drive a fear/hedging/panic cycle where USD assets and precious metals become an effective hedge against risks.
Pay attention. This next move in metals should be very explosive.

Please slip carefully $20K Bitcoin soonRight shoulder forming, H&S target $20k by End of October.
"There is nothing to fear but fear itself" - Franklin D. Roosevelt

BTC Panic Phase27,8k was rejected and 27,5k was a strong resistance.
Looks like we going down to 24k... 20k.
An idea about incoming panic phase.
Wouldn't be surprised if we hit 10-12k to be honest.
Don't underestimate the drop power of this market.
Good luck.

Silver To skyrocketHey Guys,
Banks are realizing bonds arent the safety they thought and need to diversify has shown in a big way with the yields decline, metals bulling and DXY rising. I expect silver to possibly have another leg down with any major panic we might have but once we are past the panic gold and silver will bull just like 2009-2012 and the 80s. Above is the larger picture of silver targets to keep in mind.

can you feel it? can you smell the change in the air?Can you smell what the market is cooking?
mmmm
Reward based behavior is term I learned this year for a concept Ive been studying for many years.
Behavioral finance.
The markets are wild because people are wild.
we get too greedy, then reality shifts. then we panic. then it shifts. and that panic was a fire sale. rinse and repeat.
because math is hard and those who dont know how to explain it to those who need to know.
its hard.
its another language.
Im not saying I know, but I am trying to let the knowledge seep in my dense monkey brain.
any who, panic is on the weather forecast.
have a good day.
kthanxbye.

Bitcoin Shorts With Targets based on riskThis is the case for shorters. Targets based on actual risk at the time.
Bitcoin has gone up to almost liquidate 3x positions that have sold the current bottom. There was not been a 5% drop until price has topped out. Shorters are in panic and praying for price to reach 17.5k to 18k again so they can exit their short.

QQQ weekly bullish hammer at the end of wave 5 wave 5 downtrendOrder BUY QQQ NASDAQ.NMS Stop 274.21 LMT 274.21 will be automatically canceled at 20230401 01:00:00 EST
QQQ weekly bullish hammer at the end of wave 5 wave 5 downtrend. Either ABC correction to MA 100 or beginning of uptrend. My only concern we didn't panic and capitulate yet, so probably ABC correction.

DIS weekly bullish hammer at a monthly buying zoneOrder BUY DIS NYSE Stop 99.30 LMT 99.30 will be automatically canceled at 20230401 01:00:00 EST
DIS bullish hammer at a monthly support buying zone maybe that's it for the downtrend except for we didn't have exhaustion volume / capitulation / panic event.
Quick countertrend 1.2R

OXY AND HURRICANESIt is time to put Oil on your radar for two reasons. One thing that is really striking is how the stores are already selling completely out of water this weekend, after visiting 8 stores and coming up empty handed. BUT, how will the country be faced with gasoline shortages as mass panic begins to strike into the human mindsets, fear, and much more. Especially with not knowing the exact placement of the hurricane and the strength of destruction as the country is facing record high inflation and the government is depleting the strategic reserves of our Oil. THEY will need to start buying the Oil off the market at a rapid pace before the price of oil begins to aggressively increase - thus fueling the demand for buying; causing a momentum spike in price action.
I am linking my home repair and oil charts below for simplicity purposes.
My support/resistance lines are represented with the horizontal lines. You can use those as targets and/or entries for positions based on bounces of those areas or rejections.

Time fractals 3 major spirals due 8/16/25 major turn The chart posted is that of the spirals in time see march 18/20 2020 event we are now going to see an event worldwide to start this should be very clear into OCT 4TH TO OCT 20th THIS SHOULD BE WORLD WIDE EVENT

What is the lowest possible price for bitcoin?Ask yourself what is the lowest possible price for bitcoin?
20000? 15000? Theoretically, the price will be - 0.
I'm not saying that there will be such a price, but if there is a panic in the market, keep this in mind.
By the way, how much is Terra Luna now?
Keep in mind that bitcoin was worth exactly zero at first.
And the correction will probably drag closer to that number as well.
You may start to panic.
In May 2010, 10 thousand bitcoins were equal to $40-$50 (an American bought two pizzas for 10 thousand bitcoins).
That is, a person sold 10 thousand bitcoins and he actually just gave them away. It is clear that not all of his bitcoins.
Perhaps he had 100 thousand bitcoins and he did not feel sorry for selling them. That is, there are people who have a bunch of these bitcoins.
Many years have passed, but in fact nothing has changed globally, everything except the value of bitcoin.
I can't take and buy anything with bitcoin, there are just a bunch of people who want to sell it for more.
I took 2009 as a starting point and drew trend lines from zero.
At first, we don't have prices until we sold two pizzas for 10,000 bitcoins. Then the price started to rise sharply.
As you can see, each subsequent wave of the trend has less strength.
In fact, if you look at the real from afar, bitcoin has not yet hit the real bear market, where the next wave will cover the bottom of the previous one.
But as the trend fades, it can happen and the next wave could rewrite the 3000 low.
Perhaps this will not happen and bitcoin will hold the 3000 level or be higher than it, but look at the trend.
Looks like waves 1, 2, 3 are fixing now.
Now look at the volume in 2015 and 2020-2022. Someone is now quietly fixing and distributing bitcoins,
At the same time, there are no serous purchases and panic sales. Everything is still ahead!
