ETH Trapped Between Supply & Demand On the H1 timeframe, Ethereum is clearly transitioning from impulsive strength into a balanced range environment. After a sharp bullish breakout, price stalled inside a well-defined resistance zone around 3,380–3,420, where repeated attempts to push higher have been rejected. This behavior confirms that sell-side liquidity is actively defending the highs, preventing continuation for now.
Structurally, ETH is printing overlapping swings with equal highs and shallow pullbacks, a textbook sign of consolidation rather than trend continuation. On the downside, the support zone around 3,260–3,280 continues to attract buyers, aligning closely with the rising EMA structure. As long as this zone holds, downside pressure remains corrective, not impulsive.
However, momentum has noticeably weakened. Each push into resistance lacks follow-through, while bounces from support are becoming less aggressive. This suggests buyers are absorbing supply, but not yet strong enough to force a breakout. The market is effectively coiling, compressing volatility between supply and demand.
From a trading perspective, ETH is currently in a high-risk middle-range zone. The higher-probability opportunities will come from reactions at the extremes:
A clean rejection from resistance keeps the bias short-term bearish, opening room for a deeper pullback toward 3,200–3,150.
A strong breakout and acceptance above 3,420 would invalidate the range and signal trend continuation toward higher expansion targets.
➡️ Market state: Range / consolidation
➡️ Key resistance: 3,380–3,420
➡️ Key support: 3,260–3,280
➡️ Bias: Neutral-to-bearish below resistance, bullish only on confirmed breakout
Until the range resolves, ETH is best treated as a reaction-based market, not a directional one.
Pattern

EURUSD Compresses at Demand — Breakdown Trap or Reversal Setup?EURUSD on the H1 timeframe remains in a clear short-term downtrend, defined by a descending trendline and a sequence of lower highs. Each bullish attempt into the trendline has been firmly rejected, confirming sellers remain in control of structure.
Price is now pressing into a well-defined demand zone around 1.1590–1.1600, where selling momentum has slowed and candles are beginning to compress. This behavior suggests selling pressure is being absorbed, rather than accelerating lower, which is typical ahead of a reaction or short-term reversal.
The key level to monitor is the trendline break.
– A clean break and close above the descending trendline, followed by acceptance above 1.1624, would confirm a bullish shift, opening room toward 1.1655–1.1690.
– Failure to hold the demand zone would invalidate the rebound scenario and expose liquidity below 1.1590 before any meaningful recovery.
➡️ Market state: Downtrend testing demand
➡️ Bias: Neutral → Bullish only on trendline break
➡️ Bullish trigger: Break & close above 1.1624
➡️ Bearish invalidation: Sustained break below 1.1590
At this point, EURUSD is at a decision zone either forming a base for reversal or preparing for one final liquidity sweep before turning higher.

BTC Stalls at Premium After Vertical Rally — Liquidity Below Hi Guys!! On the H1 chart, Bitcoin has just completed a strong impulsive bullish leg, breaking cleanly above the EMA 89 and accelerating straight into a clearly defined resistance zone around 95,700. This type of vertical expansion typically reflects aggressive buy-side execution, but it also leaves the market structurally imbalanced. As price reaches the resistance area, momentum noticeably slows and candles begin to compress, signaling that buyers are no longer willing to chase at premium levels while early longs start to take profit.
The current price action should be read as a post-impulse distribution and pause, not immediate trend continuation. With price holding just beneath resistance and failing to produce strong bullish follow-through, the probability increases that the market will rotate lower to rebalance. Below current price lies a series of stacked liquidity pools and inefficiencies, first around 94,080, then 93,146, and deeper toward 91,800–90,900, which also aligns closely with the rising EMA structure. These levels represent logical downside magnets where sell-side liquidity rests after the sharp rally.
From a market structure perspective, a pullback into these zones would be technically healthy, allowing Bitcoin to mitigate the imbalance created by the impulsive move and test whether demand is genuinely strong or merely momentum-driven. If price reacts positively and shows acceptance within the lower liquidity zones, that would provide a stronger base for a renewed bullish continuation later on. However, only a clean and sustained acceptance above the 95,700 resistance would invalidate the corrective scenario. Until then, Bitcoin remains in a premium consolidation phase, with downside liquidity acting as the dominant draw before the next major directional decision.

hopes for a inverse head and shoulder pattern a good contestant looking for inverse head and shoulder pattern in ZOMATO(ETERNAL)

EURUSD Trapped in a Descending ChannelOn the H4 timeframe, EURUSD continues to respect a well-defined descending price channel, confirming that the broader structure remains bearish. Since topping near the 1.1800 region, price has consistently printed lower highs and lower lows, with each recovery leg being capped by the upper boundary of the channel.
From a price action standpoint, every bullish push is corrective in nature. We can clearly see sharp impulsive sell-offs followed by weaker, overlapping pullbacks — a textbook sign that sellers remain dominant, while buyers are only reacting, not leading. The most recent rebound attempt was once again rejected near the channel resistance, reinforcing this zone as a strong area of supply.
The EMA (yellow) is sloping downward and sitting above price, acting as dynamic resistance. As long as EURUSD trades below this moving average and remains inside the channel, bullish scenarios are considered counter-trend and higher risk. Momentum remains aligned with the downside, and there is no structural evidence of accumulation at this stage.
Currently, price is drifting toward the lower boundary of the channel, with a key horizontal level near 1.1500 acting as the next major downside magnet. This level aligns with prior liquidity and structural support, making it a logical target if bearish pressure persists. A minor bounce from the channel base is possible, but unless price breaks and holds above the channel resistance, any upside should be viewed as a selling opportunity rather than a trend reversal.
Bearish continuation scenario:
– Rejection from channel resistance → continuation lower
– Targets: 1.1550 → 1.1500
Invalidation / shift in bias:
– A strong H4 close above the descending channel and EMA, followed by acceptance, would be the first signal that bearish control is weakening.
➡️ Trend: Bearish
➡️ Structure: Descending channel
➡️ Key resistance: Channel top + EMA
➡️ Key support: 1.1500 zone
At this stage, EURUSD is not bottoming it is grinding lower within a controlled bearish structure.

EURUSD Is Still Trapped in a Bearish Channel On the H4 timeframe, EURUSD is clearly trading inside a well-respected descending price channel, confirming that the broader market structure remains bearish by trend and by behavior. Every bullish attempt over the past sessions has failed to break the channel resistance, reinforcing the idea that buyers are reacting defensively rather than taking control.
Structurally, the market continues to print lower highs and lower lows, which is the defining characteristic of a downtrend. Price is currently oscillating around the midline of the channel and the EMA, a zone that often acts as dynamic resistance in bearish conditions. The repeated rejections from this area show that bullish momentum is weak and short-lived, typical of corrective pullbacks rather than genuine reversals.
The recent push higher toward the upper boundary of the channel was met with immediate selling pressure. This reaction is important: in strong downtrends, price rarely breaks resistance on the first attempt. Instead, it forms a series of bearish swings, stair stepping lower as liquidity is gradually taken on the downside.
As long as EURUSD remains below the channel resistance and fails to reclaim the 1.1675–1.1700 zone, the bearish scenario remains dominant. The projected path suggests a continuation lower, with price likely rotating back toward the lower boundary of the channel. If bearish momentum accelerates, the 1.1550–1.1500 region becomes a natural downside magnet, where larger demand may attempt to slow the move.
From a cycle perspective, EURUSD is still in a distribution-to-markdown phase. The market is not building a base; it is actively unwinding prior bullish positioning. Any short-term bullish candles should be viewed as liquidity for sellers rather than signals to fade the trend.
In summary, this is not a reversal environment it is a trend continuation environment. Until the channel is broken decisively and structure flips, EURUSD rallies remain selling opportunities, and patience aligned with the dominant bearish flow continues to offer the highest-probability edge.

Bitcoin Is Printing a Perfect Teacup – The Handle On the H4 timeframe, Bitcoin is forming a textbook Teacup (Cup & Handle) pattern, a classic bullish continuation structure that often appears before strong expansion phases. What makes this setup high quality is not just the shape, but the context and behavior of price inside the pattern.
The cup was formed through a prolonged corrective phase, where price transitioned from aggressive selling into a rounded base. This rounding is critical: instead of a sharp V-shaped reversal, Bitcoin spent time absorbing supply, flattening volatility, and allowing weak hands to exit. Volume gradually decreased toward the bottom of the cup and expanded again on the right side, which is a healthy characteristic of accumulation.
The impulsive rally on the right side of the cup confirms demand returning with strength. Price reclaimed the key moving average and broke out of the accumulation range decisively, signaling that buyers have regained control. This move completed the cup portion and shifted the market into the next phase of the pattern.
Currently, Bitcoin is forming the handle, visible as a shallow, downward-sloping consolidation channel. This handle is corrective, not bearish. Price is holding well above the midpoint of the cup, structure remains intact, and pullbacks are controlled. This is exactly where late sellers get trapped and early buyers reload positions.
As long as price holds above the lower boundary of the handle and does not collapse back into the cup, the bullish thesis remains valid. A breakout above the handle resistance would act as the confirmation trigger, opening the path toward the measured move target near 98,900, which aligns with the projected target on the chart.
From a cycle perspective, this pattern reflects accumulation → expansion → re-accumulation → expansion. The market has already done the hard work at the bottom; what we are seeing now is preparation, not distribution.
In summary, Bitcoin is not topping it is building pressure. The teacup pattern is structurally clean, volume behavior is supportive, and the handle is forming exactly where it should. If price breaks out of the handle with momentum, the next bullish leg could unfold rapidly, catching late participants off guard.

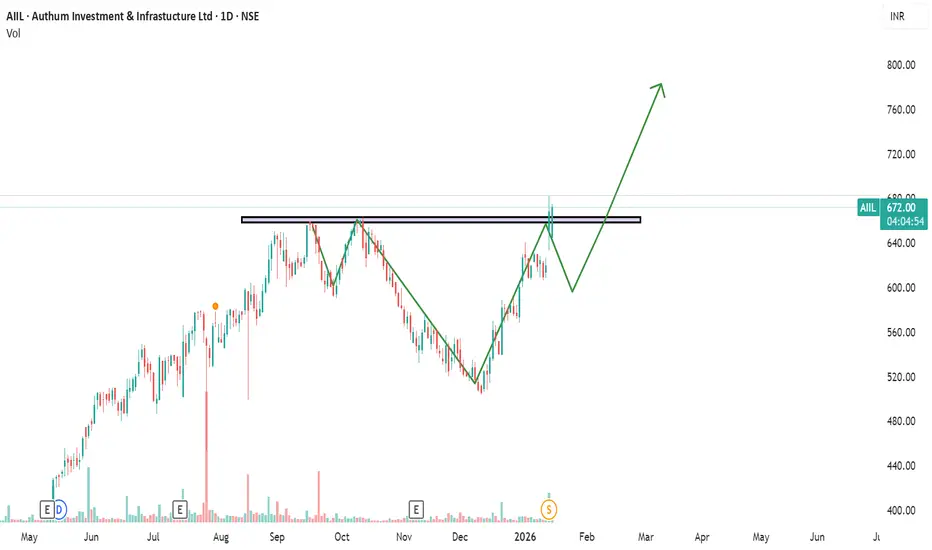
Chart Patternor i think inverse head and shoulder pattern in AIIL take the chance good move in metal sector
Invrse head and shoulder patternLooks Like a inverse head and shoulder pattern forming in Emmvee Photovoltic on NSE

trading: pattern of the "leaders" (most important graphs)Mark Minervini said You should trade stocks, when the market leaders coincide with the indexes.
It gives you thesis to look for the patterns in the leaders.
I would go step further and say, markets sometimes "coil" into patterns? where all market just agrees on something and key dates? like when VIX goes into longterm pattern, that points to key economic data, key earnings, etc.
You can almost explain or predict whole market using single "most important graph".
You don't have to do XYZ, when you can focus only these few important spots? because market can only have one direction.
This is an interesting concept and I wanted to explore more examples.
//Also maybe another reason why AIs couldnt replace traders yet, because there is no rule about it. You just figure it out and know.
//Fundamental explanation would be that during the patterns there's a shift in S/D?

Bearish HTF Bias with Short-Term Bullish Flag CorrectionGold is still trading under a bearish higher-timeframe structure, and the dominant trend remains to the downside. However, after the recent impulsive move, price appears to be forming a bullish flag / corrective structure, suggesting the possibility of one more short-term upward pulse before continuation.
This setup is counter-trend relative to the higher timeframe, therefore confirmation is mandatory. The bullish move is considered only as a corrective rally, not a trend reversal.
Key observations:
Higher Timeframe (HTF) structure remains bearish
Current price action shows a flag-type correction
Potential for a final bullish push into nearby resistance zones
Strong resistance areas are marked above, where selling pressure is expected to reappear
Main demand zone lies around 4400 – 4410, acting as a key invalidation area
Trading approach:
Prefer confirmation-based long entries only within the corrective structure
Be cautious with aggressive buys due to bearish HTF context
Primary focus remains on short opportunities at higher resistance levels after the correction completes
This idea is context-driven, not a blind signal. Directional alignment with higher timeframes remains critical.
Key Levels
Demand / Support: 4400 – 4410
Resistance 1: 4484 – 4495
Resistance 2: 4525 – 4550
Major HTF Resistance: 4605+
Invalidation
A strong breakdown and acceptance below the demand zone (4400) invalidates the bullish correction scenario and favors direct continuation to the downside.

Graphite: Major Pattern Formation | Breakout or Still BuildingGraphite India – Daily Timeframe Technical View
This is the daily timeframe chart of Graphite India.
The stock has formed a Right-Angled Ascending Broadening Formation, with a strong support zone near 500–520. The broadening structure appears to have completed a five-wave formation, while the key resistance zone is placed near 690–700.
A decisive breakout above the resistance zone, preferably with volume confirmation, could trigger a strong upside move. Based on Fibonacci projections, the final pattern target is placed near 940.
As long as the stock continues to hold above its key support zones, the ongoing rally is likely to continue, keeping the broader trend positive.
Thank you.

Bitcoin Has Been Here Before. What Happens Next ??Bitcoin is starting to resemble a structure we’ve seen before.
During the 2021 cycle, price pushed higher inside a rising range, stalled near the upper boundary, and eventually rolled over. That sequence is well-documented and easy to spot in hindsight.
What’s interesting is not the outcome back then, but the shape of the move.
Right now, Bitcoin is once again trading inside a similar broad structure.
This is not a prediction.
This is not a call for a top.
Markets don’t repeat on schedule.
But they do rhyme when positioning, liquidity, and expectations start to look alike.
If price continues higher, this becomes just another consolidation.
If price fails here, history gives us a reference for what can happen.
The chart isn’t telling us what will happen next.
It’s simply reminding us where risk tends to change character.
That’s the part worth paying attention to.

KRAB - A joke that became a good investmentIm pushing the joke and found something that looks like a rly good investment.
Perfect text book example of accumulation after a downward move (down move not shown on the chart) and a reaccumulation at 0.5 at 11
additional evidences are the pick volume on early 2024 and re accumulation at 11 shown by blue arrows
we are targeting 17 for the next wave up, on 2026 and maybe further up to 21 then
cheers not financial advice

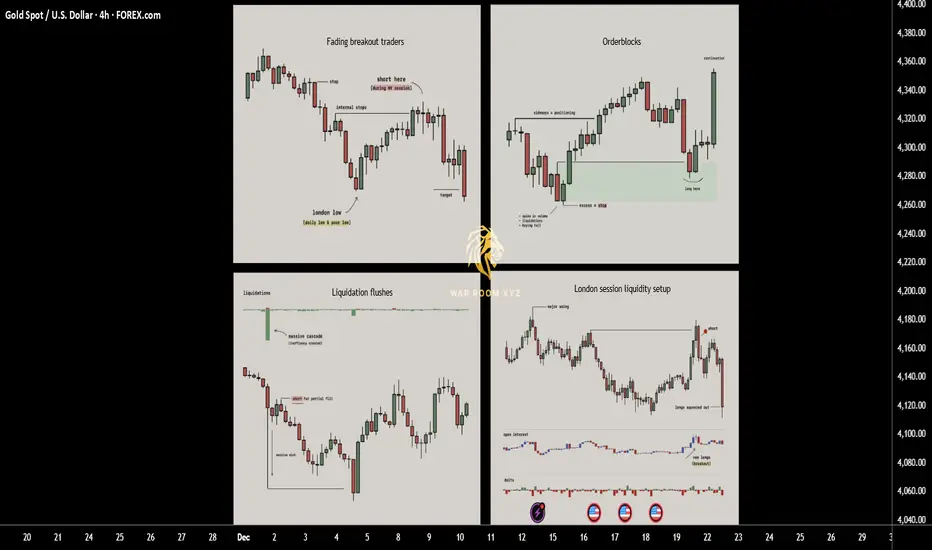
How Price Really Moves: 4 Entry Triggers Driven by LiquidityThis breakdown explains four recurring entry triggers that appear consistently across real market structure.
These are not indicators and not prediction tools. They are observable behaviors driven by liquidity, positioning, and trader psychology.
Each trigger is rooted in why price moves, not what price might do next.
1. Fading breakout traders (Failed Momentum / Trap Model)
When price breaks a key level and open interest jumps, breakout traders rush in expecting continuation. If price quickly snaps back, those new traders become trapped and their exits fuel a move in the opposite direction. This creates one of the cleanest reversal triggers since you are trading directly against failed momentum.
► What usually happens
Markets frequently approach obvious highs, lows, or range boundaries where:
•Retail breakout traders anticipate continuation
•Algorithms and short-term momentum systems enter aggressively
•Open interest or volume often expands rapidly
At this moment, new positions are created late , directly into resistance or support.
► The key failure
If price:
•Breaks a key level
•Fails to hold acceptance beyond it
•Quickly closes back inside the prior range
Then the breakout has failed structurally.
This means:
•Buyers who entered above resistance are now trapped
•Sellers who entered below support are trapped
•Their exits (stops + panic closes) become fuel for the opposite move
► Why this works
Markets move efficiently when traders are positioned correctly.
They move violently when traders are positioned incorrectly.
A failed breakout converts hope-based positions into forced exits.
► Educational takeaway
You are not trading the level,
you are trading the failure of belief at the level.
This is why failed breakouts often produce:
•Fast reversals
•Clean directional candles
•Strong continuation after rejection
2. Liquidation flushes (Forced Exit & Rebalance Model)
Sharp liquidation events create long wicks and temporary price inefficiencies. Markets tend to rebalance after these shocks as liquidity returns, which is why these wicks often get filled quickly. This setup works well in volatile phases and near exhaustion points where forced selling or buying pushes price too far.
► What a liquidation flush is
A liquidation flush occurs when:
•Price moves aggressively in one direction
•Overleveraged positions are forcibly closed
•Stops and liquidations cascade simultaneously
This often creates:
•Long wicks
•One-sided impulsive candles
•Temporary price inefficiencies
Importantly, this move is not driven by new conviction, but by forced exits.
► What happens after
Once forced liquidations are complete:
•Selling or buying pressure rapidly decreases
•Liquidity returns to the market
•Price frequently retraces part or all of the wick
This retracement is not random
it is the market rebalancing after stress.
► Where flushes matter most
Liquidation flushes are most meaningful when they occur:
•Near prior highs/lows
•At range extremes
•After extended directional moves
•During high-volatility sessions
► Educational takeaway
A liquidation wick does not mean “strong trend”.
It often means the move is temporarily exhausted.
You are not trading momentum,
you are trading the absence of remaining pressure.
3. Orderblocks
Orderblocks are zones where previous heavy participation occurred, usually during sideways movements before a strong move away. When price revisits these levels, the same participants often defend the area, creating reliable reaction points. Clean pivots with no messy wicks are the strongest since they signal clear institutional activity.
► What an orderblock represents
Orderblocks are areas where:
•Large participants accumulated or distributed positions
•Price moved sideways briefly
•A strong directional move followed immediately after
This sideways phase exists because large players cannot enter all at once without moving price against themselves.
► Why orderblocks matter
•When price returns to these zones:
•Previous participants may still be active
•Unfilled orders may remain
•Defensive reactions are more likely than random continuation
Clean orderblocks typically show:
•Tight consolidation
•Minimal wicks
•Strong departure afterward
Messy structures often indicate mixed participation and weaker reactions.
► How orderblocks are used
Orderblocks are reaction zones , not signals.
They provide:
•Logical areas to expect interest
•Defined risk zones
•Context for entry triggers like wicks or failed breaks
► Educational takeaway
Orderblocks work because institutions remember their prices , even if retail traders forget them.
You are trading where participation previously mattered, not arbitrary support or resistance.
4. London session liquidity setup
London frequently sets the daily low or high early in the session. Later in the day price often returns to sweep internal liquidity around that level before continuing the trend. This repeatable behavior offers structured entries based on predictable liquidity grabs tied to session mechanics.
► Why London matters
The London session is:
•One of the highest liquidity windows globally
•Often responsible for setting the initial daily structure
•Heavily watched by institutions and algorithms
In many markets, London establishes:
•The daily high
•The daily low
Or a key internal liquidity level early in the session
► The repeatable behavior
Later in the day (often London continuation or New York):
•Price returns to that London high or low
•Sweeps internal liquidity around it
•Rejects after stops are collected
•Continues in the higher-timeframe direction
This is not coincidence,
it is session-based liquidity engineering.
► Why it works
Institutions prefer:
•Liquidity-rich entries
•Known pools of resting stops
•Session transitions for execution
London levels provide exactly that.
► Educational takeaway
Sessions are not just time zones,
they are liquidity cycles.
Understanding when liquidity is created is just as important as where.
How These Triggers Fit Together
These models are not standalone strategies.
They are contextual tools.
Very often:
•A London sweep causes a liquidation wick
•A failed breakout forms at an orderblock
•A liquidation flush completes a failed momentum move
The strongest setups occur when multiple triggers overlap , but each can stand alone as a learning framework.
Why These Triggers Work Long-Term
They work because they are based on:
• Trader positioning
• Forced behavior (stops, liquidations)
• Institutional execution constraints
• Repeating session mechanics
They do not rely on:
•Indicator crossovers
•Lagging calculations
•Pattern prediction
Price moves because someone is forced to act.
These triggers show where and why that happens.
These 4 triggers work because they exploit trapped traders, forced liquidations and consistent liquidity patterns rather than relying on indicators. Keep them simple, wait for clean context and let the setups come to you.
Note
These concepts are:
•Descriptive, not predictive
•Contextual, not mechanical
•Dependent on execution skill and risk management
The goal is not to trade more,
it is to wait for situations where the market gives you an advantage.
I have made a script which might help identify all 4 triggers.
Disclaimer
The script is provided for educational and informational purposes only.
It does not constitute financial advice, investment advice, or a recommendation to buy or sell any instrument.
The script does not execute trades, manage risk, or replace the need for trader discretion. Market behavior can change quickly, and past behavior detected by the script does not ensure similar future outcomes.
Users should test the script on demo or simulation environments before applying it to live markets and must maintain full responsibility for their own risk management, position sizing, and trade execution.
Trading involves risk, and losses can exceed deposits. By using the script, you acknowledge that you understand and accept all associated risks.
Gold – Bearish Retracement Toward Structural SupportGold is currently moving inside a broad rising wedge, and today’s structure adds more clarity to the short-term direction.
A smaller pennant formation developed inside the wedge and has now been broken to the downside — a signal that momentum is shifting and the market may be preparing for a corrective drop toward the wedge’s lower boundary.
The key downside target aligns with 4113 – 4127 , which overlaps:
The lower trendline of the main rising wedge
A previous demand zone
A natural symmetry completion of the pennant breakdown
As long as price stays below the 4208 invalidation level , the expectation remains for price to revisit the bottom of the wedge before any significant bullish continuation can be confirmed.
Watching the reaction at the lower wedge boundary will be crucial, as this area can determine whether gold resumes its larger bullish trend or fails structurally.

Will the Sky clear for higher Goldprice? Week 8-12 DecContext: After a quiet week with little impact from economic data, Gold FX_IDC:XAUUSD has been moving sideways within a triangle structure. The US economy looks resilient—better than many expected—shifting all eyes to the FED rate cut decision this Wednesday. 🇺🇸👀
📅 Market Recap:
Mon Dec 1 (Asia Session): Price pumped +$60 up to $4264, only to dump -$101 back down to $4163, sweeping liquidity in the beginning of the US Session. 🧹
Consolidation: Since then, Gold has consolidated in a narrow range between $4190 and $4226. ↔️
Friday: US Inflation data was less dramatic than feared, but Gold still dropped around -$64, closing the week near $4191.
🔥 The Week Ahead:
We have key dates coming up, but with the Rate Cut Decision pending on Wednesday, data needs to be dramatic to force a major move before then.
Quiet/Choppy markets until Wednesday. 💤
The Exception: Tuesday, when US Job Data is released. 📊
🎯 The Trade Setup:
If the US Job Market remains stable, there is room for further downside. I am watching for a dip to sweep liquidity before looking for entries.
📉 Downside Targets (Buy Zones):
Primary Target: $4150 🥇
Secondary Target: $4110 🥈
There is strong support between this zones, so it is very possible the drop stops right at $4150 without reaching the second target.
🐂 Strategy: I see the market chopping sideways until the announcement. My plan is to look for LONG positions 🚀 if price sweeps into my targets ($4150 / $4110).
My last idea about was not longer valid because the right shoulder did not went down, but a Quasimodo pattern could be a thing... Maybee FED does skip the cut? Let's see...
-------------------------------------------------------------------------
This is just my personal market idea and not financial advice! 📢 Trading gold and other financial instruments carries risks – only invest what you can afford to lose. Always do your own analysis, use solid risk management, and trade responsibly.
Good luck and safe trading! 🚀📊

Massive WALL STREET Short At All Time High Price is testing the all time high while a head and shoulders formation is visible on the Daily, indicating potential distribution at resistance
On H4, momentum is overbought and price has remained range bound for approximately four sessions, signaling reduced follow through on the upside
Sentiment appears fragile amid discussion of an AI driven excess, and risk appetite is moderating into strength
Harmonic confluence is present, with a deep crab on H1 and a crab on H4 aligning near current levels to define a potential reversal zone
Multi-timeframe momentum is stretched up to H4; bearish RSI divergence is present on H1 and H4, with H4 showing roughly a 15-point divergence while price holds flat
Repeated failures at the all-time high confirm supply; this level continues to cap advances and strengthens the resistance profile
The H1 trend has transitioned from flat to lower, shifting near-term bias to the downside within the broader range
Cross-market context is consistent, as major US indices are also near record highs and failing to extend, which adds intermarket confirmation
Risk parameters are defined with a stop above 48,250 or above the all-time high at 48,425, which would invalidate the reversal thesis
Initial downside objective is 47,300, corresponding to the next significant support and consistent with an H4 scale pullback
Position management should consider partial profit taking at interim supports and a reduction in risk if RSI resets higher without corresponding price weakness

When an Uptrend Breaks..Smart Money Doesn’t Hesitate📉 XAUUSD MARKET OUTLOOK (1H)
- Gold has officially transitioned from its previous rising channel into a clear downtrend structure, marked by lower highs, lower lows, and a decisive break below the rising support line. The bullish momentum has faded, and sellers are gradually taking control.
- Price is now moving inside a descending correction channel, and every rally is being absorbed by supply — a textbook shift from accumulation to distribution.
1️⃣ Uptrend Channel Has Been Broken
Gold traded for several days inside a rising channel, respecting both support and resistance.
But price has now:
- Broken below the rising trendline
- Retested it and failed
- Formed a new bearish structure
This confirms the end of the previous bullish phase.
2️⃣ Strong Resistance Zone Holding Firm
The resistance zone around 4,235 – 4,245 has rejected price multiple times.
Each rejection produced:
- Lower swing highs
- Increasing bearish pressure
- Momentum shift toward sellers
This zone is now the ceiling of the new downtrend.
3️⃣ Descending Channel Signals Bearish Continuation
- Price is currently moving cleanly inside a downward-sloping channel.
- Every bounce is shallow → every drop is sharp.
- This is the behavior of a market controlled by sellers.
If the current corrective bounce fails at the upper boundary of the channel, another hard leg down is highly likely.
4️⃣ Key Target: Strong Support Zone Below
The next major liquidity area lies at the 4,105 – 4,120 strong support zone.
This is where buyers previously stepped in aggressively.
If price reaches this zone again, expect:
- Either a strong bullish reaction
- Or a deeper breakdown if momentum remains heavy
➡️ Primary Scenario (High Probability)
Retest of the channel top → rejection → bearish continuation into 4,105 – 4,120 zone.
Sellers remain in control as long as price stays under the broken trendline.
⚠️ Risk Scenario
A clean breakout above the descending channel may trigger a temporary bullish correction, but the overall structure remains bearish unless price reclaims the old resistance zone.
What’s your take on gold’s trend shift?

Downfall of DXY?!? Bears Flag The Possibility!Here on TVC:DXY we can see that last week it ended in a Bearish Breakout of an Ascending Channel, the perfect Bear Flag scenario!
Now price closed the week on the ascent possibly being the Retest of the Breakout.
If the Channel holds price on a successful retest, TVC:DXY will drop!
Fundamentally, USD has impactful news all week this week. Even so, with limited data from back logged events not available until after next FOMC Meeting, this means the Federal Reserve will continue to make decisions in "the dark" and with a high probability of a Rate Cut coming in December!
If the Bear Flag is successful in being a continuation pattern set-up, we could see price drop down to the prior Low of November under 99!

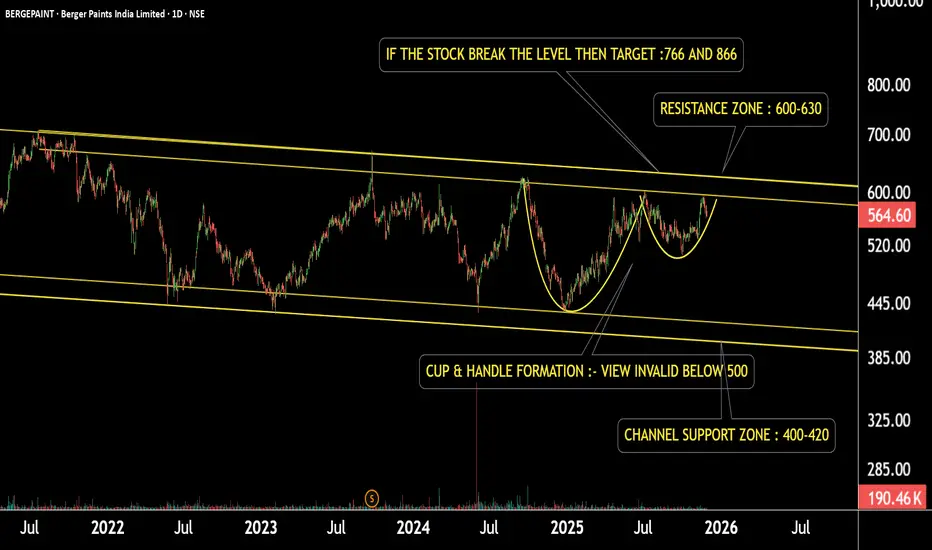
Berger Paints: Pattern Formation — Is This the BreakoutThis is the daily timeframe chart of Berger Paint.
The stock is moving within a well-defined channel and has formed a Cup & Handle pattern inside the structure.
If the pattern continues to hold and the price stays above ₹500, the pattern remains valid.
A breakout above the resistance may trigger potential upside targets of ₹766 and ₹866.
However, if the price fails and breaks below this zone, the stock may decline toward the channel support near ₹400.
Thank you.
Sun TV: Critical Levels Setting Up the Next MoveThis is the 1-hour timeframe chart of Sun TV.
The stock is forming a Descending Broadening Wedge pattern with a support zone near ₹515–525 and resistance around ₹565–575.
The trend is currently negative, but if the price breaks above the resistance zone, the stock may move toward the
pattern target near ₹620.
Thank you.

LULU Analysis | Crucial Support & Resistance Before EarningsIn this video, I break down a complete Lululemon (LULU) stock analysis ahead of its upcoming earnings.
You’ll learn the key support & resistance levels, expected volatility zones, and the technical signals that matter most.
🔍 What’s Inside the Video:
Lululemon’s current trend & momentum
Technical breakdown (chart pattern + volume + indicators)
Key support & resistance levels to watch
Earnings expectations & potential price reactions
Upside and downside targets
Risk zones and invalidation levels
Short-term and swing-trade ideas
📈 Why This Matters
LULU earnings often create huge price swings.
This video gives you a clear, actionable view of how the stock might react and what levels traders should focus on.
