Big Breakout Alert | IDBI BankIDBI Bank has formed a long-term Cup & Handle pattern since 2024 and has now confirmed a breakout with strong volume, indicating renewed bullish momentum.
Pattern: Cup & Handle (Long-term)
Breakout: Confirmed with heavy volume
Trend: Bullish structure intact
Key Support Zones:
Primary structure support near 90
Secondary support / breakout zone near 100
The breakout level may see a healthy retest if price shows short-term pullback.
Upside potential as per chart structure:
130
140–145 range
170 (extended target)
Weekly RSI has also given a breakout.
RSI is currently around 68, reflecting strong bullish strength and trend confirmation.
Patternanalysis

Coforge Showing Bullish Setup Near Strong Support Zone Coforge – Daily Timeframe Technical View
The stock is trading within a well-defined parallel channel on the daily timeframe.
Within this channel, an Ascending Triangle pattern is forming, indicating accumulation and potential upside momentum.
Immediate Support Zone: ₹1,530–₹1,550
Long-Term Channel Support: ₹1,200–₹1,300
If the stock respects the pattern support, a breakout is possible, which could open the door for an upside move toward ₹2,850–₹2,900.
Alternatively, if the stock holds the channel support, it is likely to continue moving within the channel, maintaining the prevailing trend.
Thank You!!

NIFTY: Key Levels to Watch for the Next Move.This is the daily timeframe chart of NIFTY.
NIFTY is trading within a well-defined structure, with higher-low (HL) support levels placed at 25,800 and 25,550.
On the lower timeframe, the index is showing a trendline breakout near 25,950, indicating short-term strength.
Based on Fibonacci retracement, the key reversal and decision zone lies between 25,900–25,950. If this support zone breaks, the next important support is positioned near 25,800.
If these support levels hold, NIFTY may continue its upward move. According to Fibonacci extension, the potential upside targets are 26,380–26,450, while 26,600 remains a major resistance, aligned with channel resistance and extension levels.
Thank You ....

Oberoi Realty | Consolidation Within Symmetrical TriangleThis is the daily timeframe chart of Oberoi Realty.
The stock is trading near a strong support zone placed around ₹1550–1600, which has been acting as a key demand area.
The stock is currently trading within a symmetrical triangle formation.
The immediate resistance zone is placed near ₹1780–1800.
A decisive breakout above this level may open the path for the next resistance zone around ₹2000–2030.
if this support zone sustain then we may see higher prices in Oberoi Realty.
thank you ...

RELIANCE Unleashed | Bulls Roaring StrongThis is the daily timeframe chart of Reliance.
Reliance is moving in a strong momentum phase and is consistently respecting the Supertrend indicator.
Based on Supertrend, the key support level is at 1518.
Currently, the stock is trading above multi-timeframe pivot levels, indicating short-term momentum strength.
Buying opportunities may be considered near the 1530–1540 range.
The stock has a strong support zone around 1515–1520.
Potential upside target is near 1620.
If the support zone sustains, we may see higher prices in Reliance in the coming sessions.
Thank you.

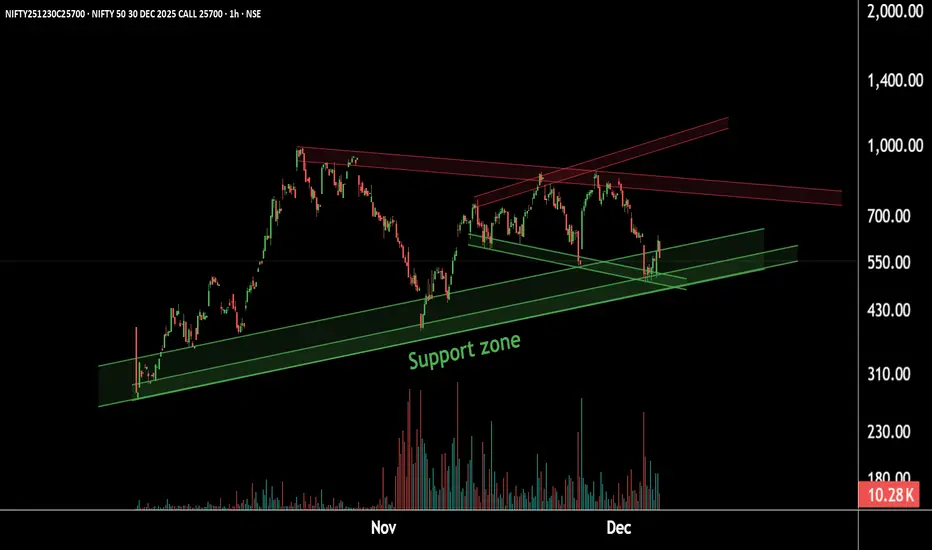
Nifty Option Chart Setting Up for a Big Bull WaveThis is the 1-hour timeframe chart of the NIFTY 25,700 CE.
The option is currently trending near a strong support zone at ₹450–₹500.
The chart indicates that the call is taking support at this level, and any dip into this zone may trigger a bullish reversal.
If this support holds, we may witness an upside move toward the potential resistance area of ₹800–₹850 , short term level 680 and 730 .
Thank you.
NLong
Granules: Important Key Levels on RadarThis is the daily timeframe chart of Granules.
The stock is currently sustaining above the LOP support zone at ₹530–540.
As long as the price holds above this level, the bullish momentum is expected to continue.
However, if the stock breaks below this support, a decline toward the lower boundary of the channel may follow.
Thank you.

Major Pattern Formation in Rain IndustriesThis is the weekly timeframe chart of Rain Industries.
The stock is forming a Bow & Tie pattern on the long-term timeframe and is currently trading near the key support zone around ₹100.
The major support level near ₹80, based on the EMA, remains crucial.
If this support holds, the stock has the potential to move toward new highs in the coming sessions.
Thank You !!

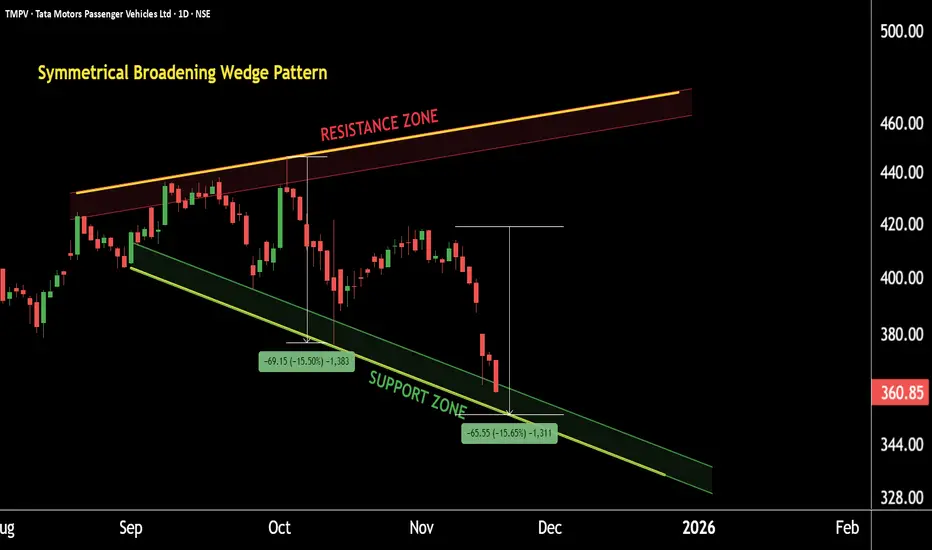
Tata Motors PV: A Big Pattern is Taking ShapeThis is the daily timeframe chart of TMPV.
TMPV is forming a Symmetrical Broadening Wedge Pattern with a key support zone near the 345–350 range.
The stock is also developing an AB=CD harmonic pattern within the broader structure, and the CD leg is completing near the same 350 support zone.
If the price continues to sustain above this support region, we may see higher levels like 400 and pattern price in TMPV in the coming sessions.
Thank you.
Kalyan Jewellers : Possible Head & Shoulders Pattern ?This is the daily timeframe chart of Kalyan Jewellers.
The stock is moving within a well-defined parallel channel, with a strong support zone near the 440–460 range, which has already been respected as the stock bounced back from this level.
Currently, the stock is providing price-action support near the 470–480 zone.
If this level sustains and a bullish move begins from here, it will confirm that the stock has formed a Head & Shoulders pattern.
The potential target for this pattern lies in the 640–650 range.
Thank You !!

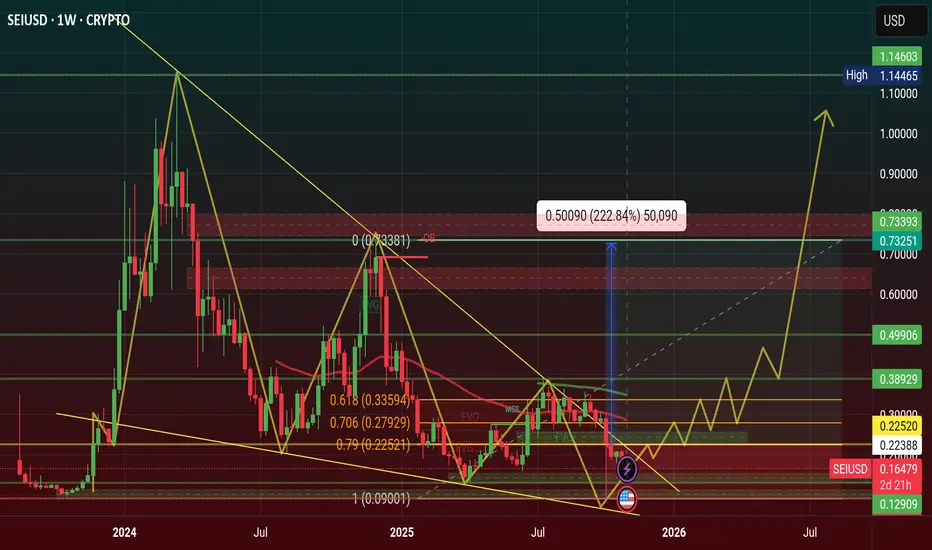
$SEI Price will hit $1.22 in 2026, Falling Wedge Pattern WeeklySEI price is showing a Bullish Pattern of Falling Wedge Pattern, when this pattern will create on chart after price will be upward direction.
Price Will hit $1.11 in 2026 and 2027 is $2.22, $3.33
Entry Point is $0.22, $0.27, $0.33 and Stoploss point $0.09
2026 Target point $0.49, $0.77, $1.11
2027 Target point $2.22, $3.33
#trending #Highlight #trendingideas #SEI #SUBROOFFICIAL
Disclaimer: This article is for informational purposes only and does not constitute financial advice. Always conduct your own research before making any investment decisions. Digital asset prices are subject to high market risk and price volatility. The value of your investment may go down or up, and you may not get back the amount invested. You are solely responsible for your investment decisions and Binance is not available for any losses you may incur. Past performance is not a reliable predictor of future performance. You should only invest in products you are familiar with and where you understand the risks. You should carefully consider your investment experience, financial situation, investment objectives and risk tolerance and consult an independent financial adviser prior to making any investment.
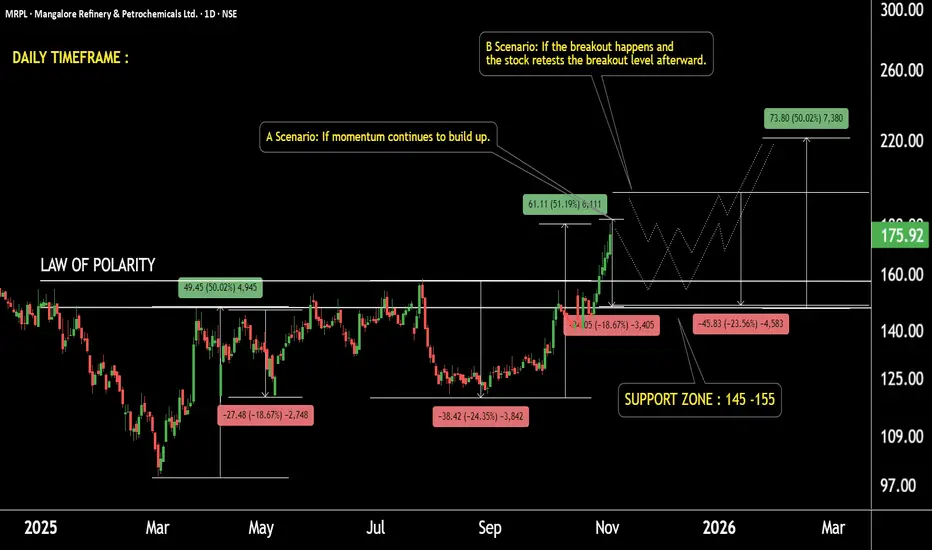
MRPL Showing Strength !! Momentum Building for Next Rally !!MRPL — Technical Overview
On the long-term timeframe, MRPL is moving within an ascending parallel channel, with a strong support zone between 120–135 and a resistance zone near 420–520.
According to the Supertrend indicator, the stock remains in a bullish phase, showing two key dynamic supports — the first around 145, and the second near 125.
On the daily timeframe, after a 50% upward move, the stock witnessed a healthy correction of around 20–24%, bringing it back toward its support area between 145–155.
This correction zone aligns with the law of polarity, where previous resistance has now turned into support.
Scenario A: If the momentum continues to build, the price may move toward higher levels directly.
Scenario B: If the breakout retests the previous breakout zone, the price may revisit 145–155 before resuming the next leg higher.
Based on this structure, the potential target for the next leg lies around 220 levels, supported by the channel resistance projection and measured move.
$XAU will hit $5,555 Incredible Price In 2026Gold Price Showing Bullish Accending Triangle Pattern in chart, this pattern move Upward Direction and price up ATH area. than price Consolidate this area than price Move Up $4,545, $4,747, $4,949 area and $5,252 area in 2026, Surprised Price Will Be $5,555 best of the year of Gold.
TVC:XAU Buy Position Setup
Three Buy Zone of Golden Fibonacci levels, areas is $3,933, $3,980, $4,029, it's a Key Support area. Stoploss area $3,815 and it's Strong Support areas.
Dynamic Resistance area Is new ATH area $4,398, and Three Target area, $4,103, $4,233, $4,375, of 11.11% Roi. if price up Retested than Breakout Key Support area.
#gold #smartmoneyconcept #highlight #XAU #SUBROOFFICIAL
Disclaimer: This article is for informational purposes only and does not constitute financial advice. Always conduct your own research before making any investment decisions. Digital asset prices are subject to high market risk and price volatility. The value of your investment may go down or up, and you may not get back the amount invested. You are solely responsible for your investment decisions and Binance is not available for any losses you may incur. Past performance is not a reliable predictor of future performance. You should only invest in products you are familiar with and where you understand the risks. You should carefully consider your investment experience, financial situation, investment objectives and risk tolerance and consult an independent financial adviser prior to making any investment.

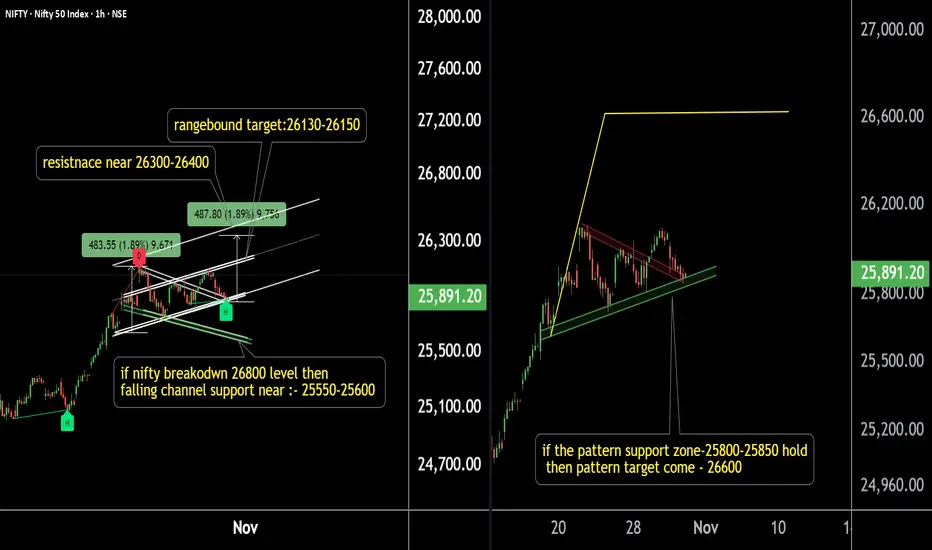
Nifty Key Levels on Radar — Crucial Zones to Watch This WeekNifty 50 – 1 Hour Timeframe Analysis
Nifty is currently showing strong support near the 25,800 zone.
If this level breaks, the next support can be seen around 25,550–25,600.
As per the current market structure, Nifty may first move in a range-bound phase, achieving initial targets around 26,150–26,180.
If the upward momentum continues, the next potential targets will be around 26,300–26,400 levels.
If the pattern support zone holds, then the pattern targets are likely to be achieved.
Thank you!
NIFTY | Twin Bullish Patterns Signaling Market ConfidenceNIFTY | Dual Bullish Pattern on 15-Minute Timeframe
This is the 15-minute timeframe chart of NIFTY.
NIFTY is currently forming two bullish patterns — a triangle pattern and a falling flag pattern.
If the triangle pattern support breaks, the next strong support lies near the ₹25,550–₹25,600 zone, aligned with the lower boundary of the falling flag.
As long as this support zone holds, NIFTY is likely to resume its upward momentum, potentially heading toward a new high in the ₹26,250–₹26,300 range.
Thank You !!

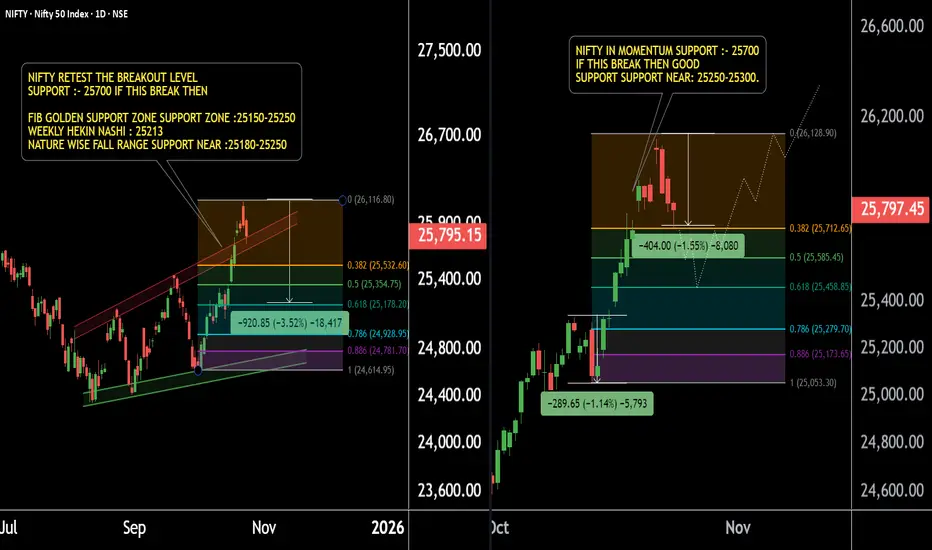
NIFTY SUPPORT LEVELS – Time to Focus for Potential ReversalNIFTY – Focus on Key Buying Levels (Daily & 4H Timeframe Analysis)
NIFTY is currently showing strong support zones for both momentum and safe buying opportunities.
Timeframe: Daily & 4H
Primary Momentum Buying Level: Around 25,700
Based on Fibonacci levels and short-term price action.
If NIFTY breaks below 25,700, we may see a further decline of 200–250 points.
Next Support Zone: 25,450–25,500 (Daily Timeframe)
Heikin Ashi Candle Support: 25,213, with a broader support range of 25,150–25,250 — confirmed by multiple price action setups.
Key Insight:
If NIFTY holds above these key supports, a reversal or bullish momentum is highly possible. Stay focused on the mentioned levels and trade with patience and discipline.
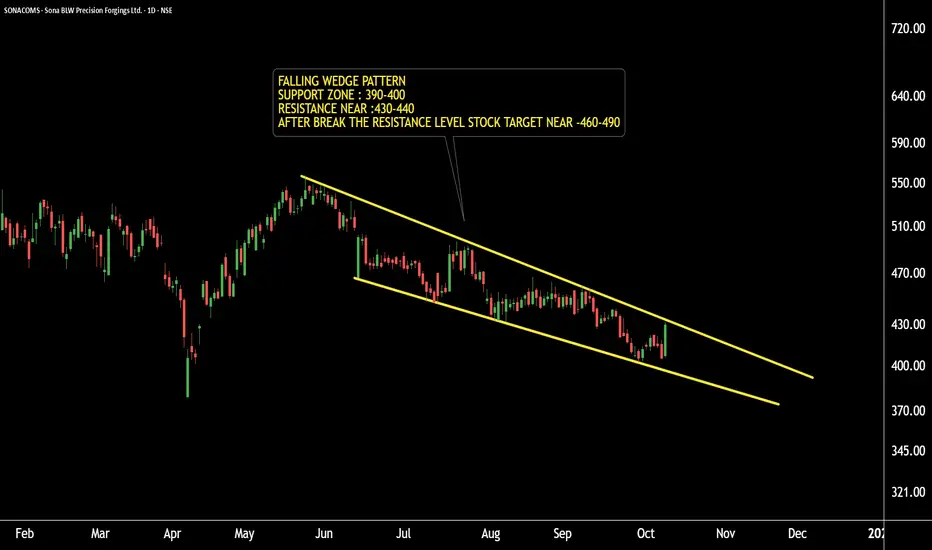
SONACOMS Technical Setup – Pattern Formation AlertSONACOMS – Falling Wedge Pattern Formation
Timeframe: Daily Chart
SONACOMS is forming a Falling Wedge pattern, which is a bullish reversal pattern in a bearish market phase.
The support zone is placed around ₹390–₹400 levels.
The resistance level is around ₹430.
A breakout above ₹430 may lead to pattern targets near ₹460 and ₹490.
If the support zone holds, we may witness higher prices in SONACOMS in the coming sessions.
Conclusion: Watch for a breakout confirmation for potential upside momentum.
Thank you !!
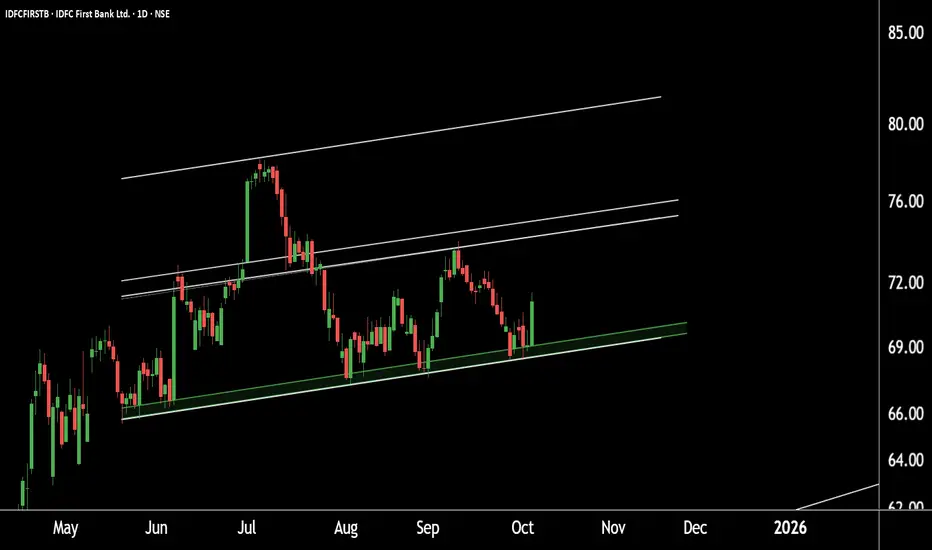
IDFC First Bank Holding Firm — Buyers Defending Key LevelsIDFC First Bank – Daily Chart Analysis
Timeframe: Daily chart observation.
Price Structure: The stock is trading within a well-defined parallel channel.
Support Zone: Strong support identified near the ₹67–₹69 range.
Upside Target: If the support zone holds, the next potential upside target lies around ₹81–₹82.
Outlook: Sustaining above the support levels may lead to higher prices in the upcoming sessions.
Thank you.
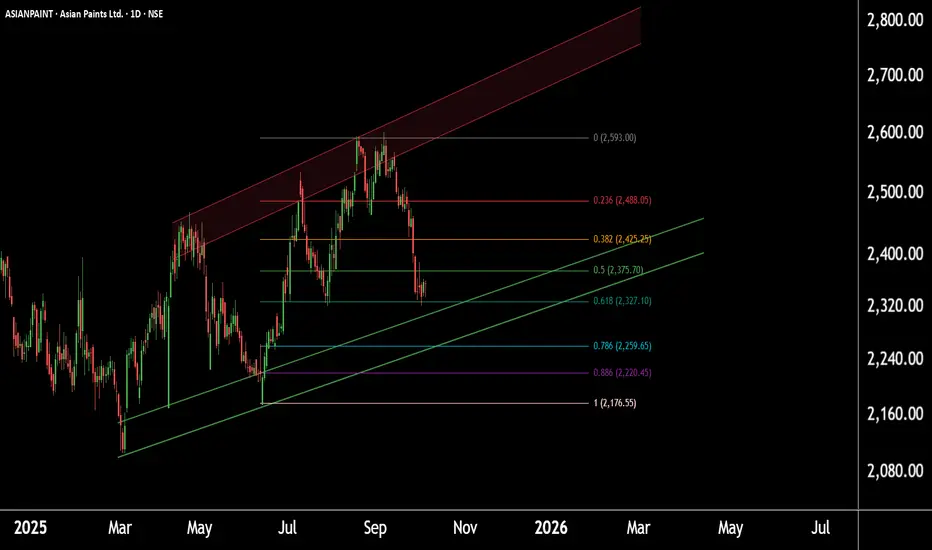
Asian Paints at Demand Zone —Eyes on a Potential Reversal Setup!Asian Paints – Daily Chart Analysis
Chart Timeframe: Daily chart observation.
Current Price Zone: Trading near the Fibonacci golden zone around 2320.
Support Zone: Strong support identified between 2240–2260, aligned with the channel base and Fibonacci retracement.
Technical Confluence: Both channel and Fibonacci levels confirm 2260 as a crucial support level.
Outlook: If these two zones hold, we may see higher prices in Asian Paints in the upcoming sessions.
Thank you.
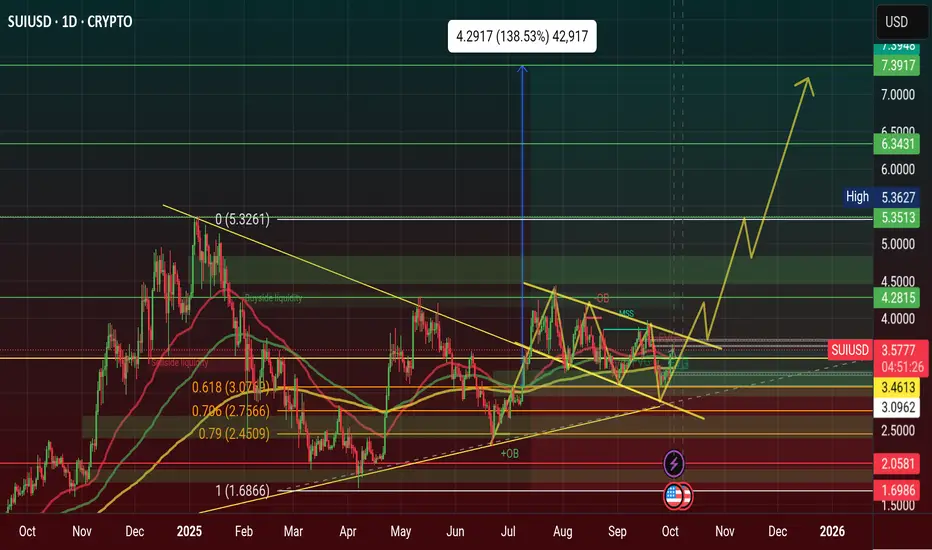
$SUI Showing a Bullish Flag Pattern Day Chart $7 Soon 2026CRYPTOCAP:SUI Showing a Bullish Flag Pattern Day Chart $7 Soon 2026
CRYPTOCAP:SUI was Showing a Reversal Pattern and now Reverse the Price. 3 Weekly showing a Bullish Flag Pattern in Day Chart. It's a Continuation Pattern. It's going to Upward Movement on Directly.
CRYPTOCAP:SUI Strong Support $2, Open position $3 and Strong Resistance $5, Never forget Target $7 and $11 in 2026
#Write2Earn #BinanceSquareFamily #Binance #SUI #SUBROOFFICIAL
Disclaimer: This article is for informational purposes only and does not constitute financial advice. Always conduct your own research before making any investment decisions. Digital asset prices are subject to high market risk and price volatility. The value of your investment may go down or up, and you may not get back the amount invested. You are solely responsible for your investment decisions and Binance is not available for any losses you may incur. Past performance is not a reliable predictor of future performance. You should only invest in products you are familiar with and where you understand the risks. You should carefully consider your investment experience, financial situation, investment objectives and risk tolerance and consult an independent financial adviser prior to making any investment.
$BTC SURPRISED $123K PROFIT DONE ($111K-$122K)CRYPTOCAP:BTC SURPRISED STEP BY STEP
$111K $115K $122K
2026 WILL MORE SURPRISED 2028 OF FUTURE
$122K $133K $144K $155K $166K $177K $188K $199K $211K
Bitcoin (BTC) to Hit Standard Chartered Predicts
At press time, it is trading within striking distance of a neW record high at $123,646.
The cryptocurrency's current record high of $124,517 was logged on Aug. 14 on Bitsamp. tandard Chartered believes that a prolonged shutdown will be bullish for Bitcoin. Kendrick has noted that Bitcoin has a positive correlation with U.S.
Treasury term premiums, which represent the extra yield that comes with holding longer-term bonds. They are currently on the rise due to significant uncertainty caused by the U.S. government shutdown.
Polymarket odds
According to Polymarket bettors, Bitcoin currently has a 7% chance of surpassing $200,000. At the same time, the odds of Bitcoin surpassing $135,000 as early as this October currently stand at 32%.
Meanwhile, there is also a 5% chance of Bitcoin dropping back below $100,000 this October.
#Write2Earn #BinanceSquareFamily #Binance #BTC☀ #SUBROOFFICIAL
Disclaimer: This article is for informational purposes only and does not constitute financial advice. Always conduct your own research before making any investment decisions. Digital asset prices are subject to high market risk and price volatility. The value of your investment may go down or up, and you may not get back the amount invested. You are solely responsible for your investment decisions and Binance is not available for any losses you may incur. Past performance is not a reliable predictor of future performance. You should only invest in products you are familiar with and where you understand the risks. You should carefully consider your investment experience, financial situation, investment objectives and risk tolerance and consult an independent financial adviser prior to making any investment.

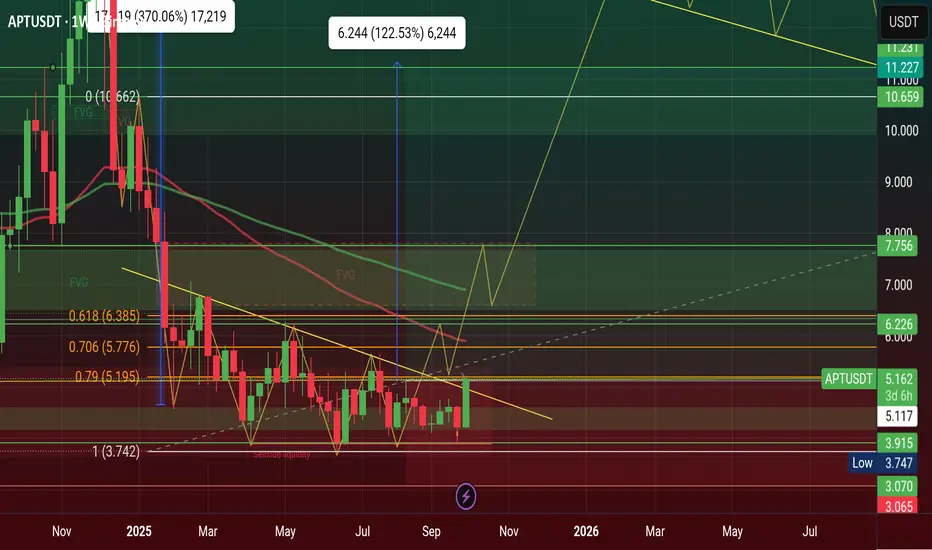
$APT Surprised $5.11 Today & Breakout Confirmed AMEX:APT Surprised $5.11 Today & Breakout Confirmed, price will Drive $11 on this 4th Quarter of 2025
Here’s Why Aptos (APT) Price Is Up Today
Aptos price is having a strong day, up more than 10% and now trading around $5.06, with trading volume climbing by 16%. The move comes after a series of bullish developments that have given traders plenty to get excited about.
One of the main reasons behind the surge is Aptos’ new partnership with World Liberty Financial (WLFI). Together, they’re bringing the USD1 stablecoin onto the Aptos blockchain, with the launch expected by October 6.
USD1 is already the fifth-largest stablecoin with a market cap of about $2.7 billion, and its arrival on Aptos is seen as a major liquidity boost. Stablecoins usually drive more DeFi activity, and APT’s price jump from $3.92 to $4.86 right after the news shows just how much optimism this created.
What the APT Chart Is Showing
Looking at the 4-hour chart, Aptos price has broken out of a downtrend that kept it under pressure for weeks. The price pushed up from the $4.20 support zone and is now testing resistance just above $5. The rally marks the strongest momentum since early July.
The RSI is approaching 70, showing strong buying strength but not yet at extreme overbought levels. The MACD is firmly green, and the widening histogram signals fresh momentum on the upside.
Open interest is holding near 8.97 million, while net shorts are dropping, a sign that sellers are closing out positions. Net longs remain steady, suggesting this move is being powered more by new inflows than leveraged bets.
If Aptos price can maintain its position above the $5 level, the next significant test will be around $5.40 to $5.60, which corresponds to the last local high. On the other hand, if the rally cools, $4.60 is the first support zone to watch.
APT Price Short-Term Outlook
Aptos looks strong going into October. The combination of fresh liquidity from the stablecoin launch and a new institutional product gives it both hype and substance.
If the bullish momentum continues, a push toward $5.60 seems realistic in the short term, with room for a run toward $6.20 later this month.
Of course, holding above $5 is key. As long as Aptos price defends that level, the trend favors the bulls. Right now, the market seems to agree that Aptos has found fresh energy at just the right time.
#Write2Earn #BinanceSquareFamily #Binance #BTC☀ #SUBROOFFICIAL
Disclaimer: This article is for informational purposes only and does not constitute financial advice. Always conduct your own research before making any investment decisions. Digital asset prices are subject to high market risk and price volatility. The value of your investment may go down or up, and you may not get back the amount invested. You are solely responsible for your investment decisions and Binance is not available for any losses you may incur. Past performance is not a reliable predictor of future performance. You should only invest in products you are familiar with and where you understand the risks. You should carefully consider your investment experience, financial situation, investment objectives and risk tolerance and consult an independent financial adviser prior to making any investment.
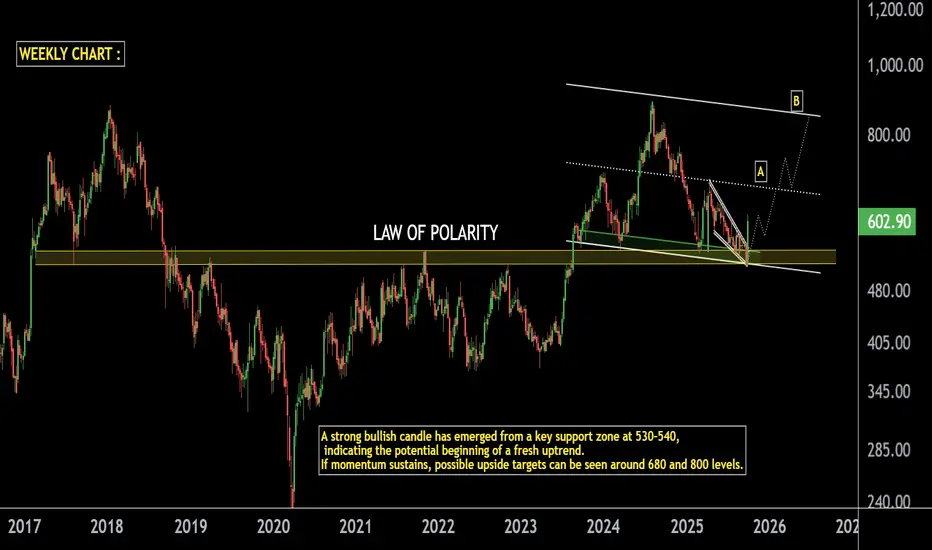
SUN TV on Fire: Explosive Move from Strong Support Zone.SUN TV Weekly Analysis
Support Zone: Stock is respecting the long-term LOP with strong support in the 520–530 range.
Bullish Candle: A powerful bullish candle has formed at this support zone, signaling strength.
Momentum Outlook: If momentum continues, a minor correction could act as a healthy pause before the next rally.
Resistance Levels:
First resistance / rally stop point near 680.
If 680 breaks, next resistance is positioned around 850.
Trend View: As long as the 520–530 support zone sustains, SUN TV may continue its rally in the coming sessions.
Thank You !!