EEM breaks out amidst weakening $ DollarEEM just broke out of a multi year resistance. Meanwhile the dollar is weakening. DXY slicing through ~100 support and testing ~95. Weak dollar means EM currencies strengthen. And when their currencies strengthen, their markets can follow.
Pennant

EUR/USD Steadies as Fed Stays Pat, ECB Concerns LingerEUR/USD eased back today after recent strength as sentiment shifted modestly toward the U.S. dollar. The Federal Reserve held rates unchanged as expected, with Chair Powell maintaining a tight-lipped stance that produced a muted market response — EUR/USD briefly dipped below 1.1900 before recovering to around 1.1950. The Fed's upbeat tone on economic conditions has cast some doubt on the timing of future rate cuts, offering modest support to the greenback.
The euro’s broader advance has also been tempered by fresh commentary from ECB policymakers warning that rapid euro appreciation could dampen inflation and complicate monetary policy, a reflection of underlying growth headwinds in the region. While consumer confidence and business sentiment showed pockets of resilience earlier this month, broader price pressures remain subdued and below target, keeping market focus on the ECB's reluctance to tighten further.
In the above chart, EUR/USD rates have quickly regained the bullish uptrend from the January, March, and November 2025 lows, surging to their highest level since June 2021. The consolidative action from last summer can now be interpreted as a bullish pennant. Despite today’s pullback, EUR/USD rates are holding the first key support level should the breakout continue, the September 2025 high at 1.1919. Failure below 1.1919 by the end of the month would likewise put into question the year-long uptrend again; until then, momentum appears to favor the upside.

Bullish PennantFFC Analysis
Closed at 650.82 (23-01-2026)
Bullish Pennant Target seems to be around 700+
However, breaking 580 may bring the price towards
550 - 565

Bullish PennantPAKOXY Analysis
Closed at 325.50 (23-01-2026)
Bullish Pennant Pattern appeared.
Crossing & Sustaining 345 - 348 with Good Volumes may
lead it towards 400 & then 450.
However, breaking 300 may bring more selling pressure towards
275 - 280

EURJPY higher bearish expected
OANDA:EURJPY price break zone, under zone we have BEARISH PENNANT (white doted) which looks breaked, from here higher bearish expectations having.
SUP zone: 183.400
RES zone: 181.500, 180.700

3 Wave uptrend?Was taking a look at FO TSX, looks like a 3 wave uptrend is taking place. I drew a fib grap from Dec 2024, then used the price drift to align the 0.236 level, and used additional data and aligned the 0.382 fib line. I then Identified pull backs, and drew a wavey line to 0.465 price. We will see what happens Cheers

Monthly triangle or Daily H&S (EUR/USD)Setup
Neutral - range market - possible top
Monthly triangle pattern (or bull pennant)
Daily chart looks like an incomplete H&S top
Shallow rising trendline is support
RSI support at 33
Commentary
This market could go either way from here - looking to trade inside the range until it breaks.
Strategy
Buy touch of rising trendline
Sell confirmed H&S top pattern

The EURUSD is in a probable distribution phaseThe EURUSD is in a probable distribution phase, and its hinting signs of the start of a markdown or downtrend. Not sure sure about the fundamentals of this pair at the moment but my technical side shows that selling off the pair at the break of the identified trendline on the 4hr timeframe would have higher chances of being a profitable trade. This trade would probably start showing real entries around Thursday 22nd of January or even later or earlier.

GBPJPY Bullish Setup: Combining a Classic & Advanced PatternToday we’re looking at GBPJPY, and what stands out is a high-quality bullish opportunity that blends both a classic pattern formation and an advanced pattern formation into one trade idea.
On the higher timeframes, price recently broke out of a bullish pennant pattern and has recently pulled back to retest the prior structure level that was violated during the breakout.
During the pullback, price action has begun forming a potential bullish Bat pattern.
Three Ways to Trade This Opportunity
1. Trade the Bat Pattern Only
The Bat pattern is a stand-alone trading opportunity. You can execute the trade purely based on the harmonic completion zone, managing risk and taking profits at traditional Bat pattern targets.
2. Use the Bat as Confirmation for the Bigger Breakout Trade
In this approach, the Bat pattern becomes your reason for entry into the larger bullish continuation move that originated from the pennant breakout. Here, the focus is less on harmonic targets and more on holding for trend continuation.
3. Combine Both Approaches (Hybrid Strategy)
This is often the most flexible option. You can:
Take partial profits at traditional Bat pattern levels, but keep a portion of the position open to participate in the larger breakout-driven move
This allows you to reduce risk, pay yourself early, and still maintain exposure to a potentially strong continuation.
Please let me know if you have any questions and feel free to share you views on this pair below.
Akil

Copper -- Bullish MomentumCopper Bullish Momentum.. Still Steam left for upside move...
Copper Futures Completed Following Steps:
1.Reached multi Year/ all time high of 5.94 placed at 24-July-25
2. Reached previous high on 26-Dec-25
3.Corrected around 6% after reaching previous high
4. Break out of last 2 high with momentum and Volume... Breakout with bullish candle.
and continuing
Next Steps:
1. Reaching target1 - 6.746
2. Reaching target2 - 7.12
Please note that these are completely my personal findings.. and conditions depend on market scenarios..

Nikkei UpsideNikkei -- Breakout after consolidation.......
Strong Bullish Breakout........
Targets mentioned.
FIrst Entry Now.
Second Entry -- after price crosses 52560
Stop Loss -- 50010.
Targets are Fibonacci Ratios as shown on Chart.....
All across the globe are wars. Market dynamics may change drastically at any time.
So please exercise caution and believe in Stop loss...

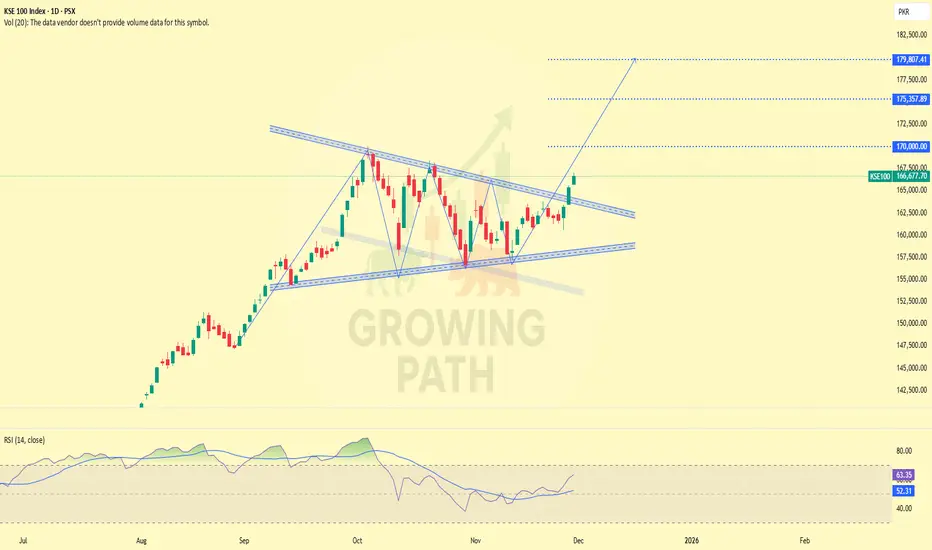
KSE100 — Daily | Breakout Confirmation + Upside TargetsThe index has confirmed a clean breakout from the falling channel and is now holding firmly above the trendline structure. Price has shifted into a stronger bullish posture compared to previous sessions.
The RSI has moved above 60, indicating momentum is entering bullish territory. Multiple higher-timeframe closes (weekly & monthly) also support continuation to the upside.
As long as price remains above the breakout zone, the upward targets remain active:
Targets:
• 170,000
• 175,350
• 179,800
Minor resistance lies near 168,200 and 170,000, but the broader structure favors continuation as long as the breakout holds.
Bias: Bullish
Invalidation: Breakdown below the channel support or failure to hold above the breakout level.
BCH BreakoutI'm seeing a beautiful triangle, almost an ascending triangle, on the BCH weekly chart. It's breaking out of two upper trend lines with two candles come tomorrow Sunday. I'm hoping for a weekly close above $650. I really like the way BCH has been trading since it's predictable and follows rules. There are two trades inside the triangle using the 200MA combined with MACD that executed perfectly so I think that future patterns and behaviors can be relied upon to act in a more predictable fashion than BTC.
Anyway I've written my price goals on the chart for you to look at though I don't plan to take profit on any except for the final goal but I will be adjusting my stop loss as time goes on. Please feel free to comment, I enjoy other perspectives and repartee!

Prebreakout Buildup at a 4-Year Resistance: IPCA LaboratoriesTL;DR: The High-Conviction "Pre-Breakout Buildup & Squeeze" Setup
IPCA Labs is currently edging towards the apex of a year-long pennant consolidation at a major 4-year resistance level. With both NIFTY and NIFTY Pharma indices looking bullishly poised, the odds favor bullish breakout in IPCA soon.
Step 1: The "Forest to the Trees" Filter (Tailwinds)
The Forest (Nifty 50): The broad market is structurally robust, coiling near record highs and positioned for a possible continuation breakout.
The Trees (Nifty Pharma Index): The NIFTY Pharma index also looks good, positioned for a possible bullish breakout.
Conclusion: Macro and sector tailwinds are firmly in place to support individual pharma breakouts.
Step 2: Big Picture (Stan Weinstein Stage Analysis)
The 4-Year Ceiling: The stock has been capped by a major horizontal resistance at ₹1380 since 2021.
The Buildup Phase: An initial breakout attempt in late 2024 failed to sustain, leading to a year-long pennant-shaped continuation pattern. This oscillation has allowed the stock to absorb the multi-year overhead supply.
The Stage: Having spent significant time basing and now coiling at range highs, IPCA is primed for a transition into a decisive Stage 2 Advance.
Step 3: Execution Structure (Prebreakout PA Analysis)
The Buildup: The last 12 months show a tightening "pennant" structure right at the key ₹1380 level - a classic sign of institutional absorption.
Momentum Signal: November 2025 saw a strong bullish monthly bar breaking above the 20-Month EMA and the resistance level on high volume.
The Prebreakout Squeeze: December 2025 is closing as a tight doji above the breakout level. This narrow-spread candle above the EMA/resistance is a "squeeze" that creates tension - and could resolve in an explosive move if bulls can push beyond the year-long pattern's boundary.
Step 4: Fundamental Engine (The Notebook)
Operational Turnaround: Q2 FY2026 saw robust profit growth of 23.13% YoY (₹282.57 Cr) and record quarterly revenue.
Margin Expansion: Standalone EBITDA margins surged to 25.46%, a 257 bps improvement reflecting enhanced operational efficiency.
API Surge: The API business is a major growth driver, with sales increasing 28% to ₹408 Cr in the most recent quarter.
Valuation Gap: Currently trading at a P/B of ~4.9x. While higher than some peers, its ROA of ~7.3% and ROE of ~12.8% are trending upward as operational leverage kicks in.
Financial Health: Maintains a very low debt-to-equity ratio of ~0.19 with an interest coverage ratio of 34.9x.
Possible Entries:
Aggressive: Within the current "squeeze" zone (₹1380–₹1470), as close to the 20-Month, or 20-Week EMA as possible.
Important note for this entry - check how the monthly closes (in 2 days from now). If it closes somewhat like it looks now (a tight doji), then this entry would have decent odds.
Conservative: On a decisive weekly close above the pennant's upper boundary.
Invalidation of the setup: Bearish break & close below the pennant, or below the 20-month EMA (or 20-week EMA if following on weekly)
Disclaimer: This analysis is for educational purposes only and does not constitute financial advice. Market investments are subject to risk; please consult a SEBI-registered advisor before trading.

EURCADPair looks to be ready for the drop. way too many bearish signals in sight. Looking to swing to support of 1.58000.

Mughal Long call - Weekly TFMughal Triangle pattern weekly TF
Long position on Weekly TF
TP1: 150
TP2: 165

NQ Update 24,816 - Funded Future's TraderMy target for EOD tomorrow. Obviously through future's you have the ability to follow these through options a bit better.
100% On all future callouts and option callouts. I stream live on YT everyday.
Ask about the indicator it's free.

GBPJPY_SHORT SELL_15 MIN STRATERGYThe pair has broken out out of Pennant Chart Pattern and has also retested its resistance.
We are expecting a price to go down and an entire Pennant Chart Pattern.
A risk ratio reward is 20 which is a good contract.
Based on analysis
Entry: 208.430 / 208.110
SL: 208.600
TP1: 207.630
TP2: 206.780
TP3: 206.230
TP4: 205.215
A proper risk management should be applied

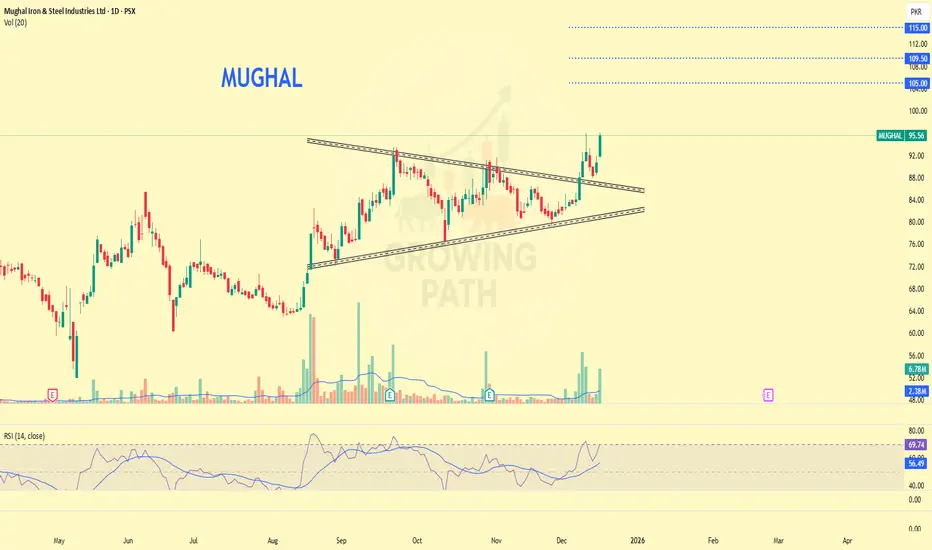
MUGHAL – Bullish Continuation with Two Clear ScenariosMUGHAL – Bullish Continuation with Two Clear Scenarios
Price has broken out of a compression / triangle structure with volume confirmation. Trend remains bullish, however RSI is near 70, so chasing is not advised.
Scenario 1: Continuation above breakout zone → move towards 100–105–109
Scenario 2: Healthy pullback towards 92–94 → better risk-reward entry
As long as price holds above 88, bullish structure remains intact.
Trade with proper risk management.
NQ 24,958 TargetShorting NQ from the 35,317.5 or so will obviously need to adapt and adjust as time goes on reference my previous post for levels

$BTC Bearish Pennant Or Higher Low Breakout?₿itcoin continues to struggle to reclaim the 9DEMA.
Is this a bearish pennant that will trap bulls?
Or will these higher lows lead to a violent breakout to the upside?
If PA can start trading within the POI above the .618 Fib then there’s a chance for a nice relief rally going into Christmas. Gut says it might breakthrough on the 5th attempt.
Confirmation will be CRYPTOCAP:BTC closing above the 50MA and 50% Gann level.

Bullish Continuation for Newmont CorporationNYSE:NEM
Newmont Corporation is predicted to bullish following the increment of gold price projection.
We'll see if Newmont can achieve the target $150 until April 2026.

AU10Y 8% By 2028The bullish pennant has been broken to the upside.
If similar momentum is maintained in the second half of the move, we might see 8% by 2028.
Each fib level correlates with a resistance zone.
Major Australian banks have already moved to increase fixed interest rates on some loan products out of cycle.
