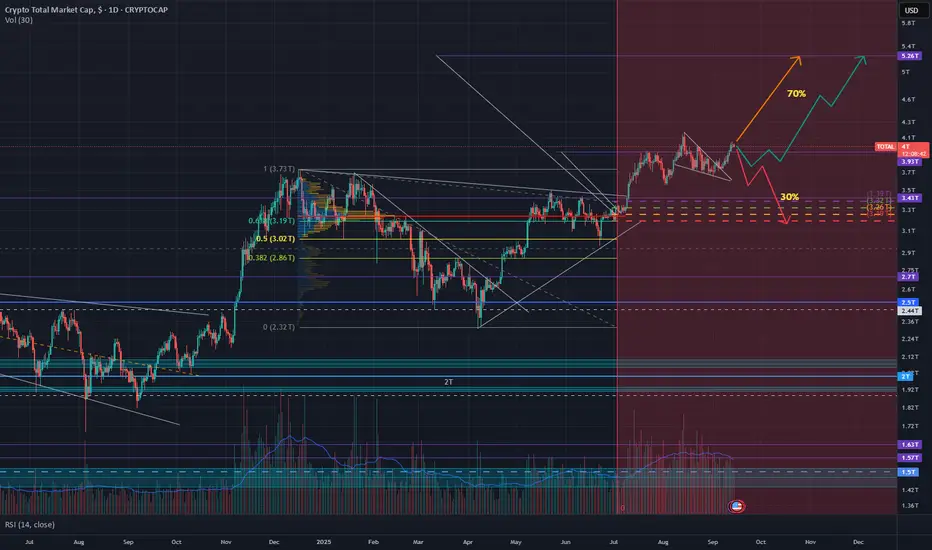
TOTAL 1D HVF making good progressSupportive that the bull market is not over yet. There is still time in the setup, and price has not invalidated it yet.
Keep on keeping on
Pennant
PEPE 1D HVFPEPEUSD making an HVF. RH3 is in.
We expect the next few days to cool off a bit followed by a surge to the upside

SOLBTCSOLBTC is on the brink of a HVF compliant RH3. We expect a small pullback to wind up before breaking out against BTC. Alts outperforming BTC is bull market conditions.
Too late now to catch the current leg, don't FOMO in. Keep in weekly review to find the right price to go big.
Fundamentals:
- Chose coin
- Doller weakness environment
- Rate cuts expected after weak economic data

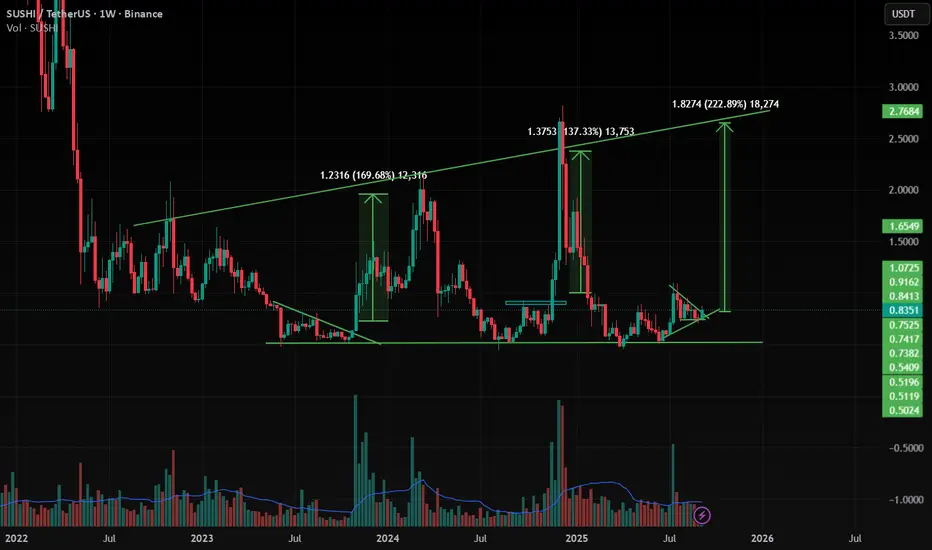
SUSHI Ready for 200 % Up Move SUSHI is forming expansion channel and moving inside that pattern and now it is at support and breaking from a pattern at support , so we can expect 200 % Up move from that breakout .
and at the same time Bitcoin dominance is decreasing and altcoins dominance is started increasing , so look on all the altcoins
and follow proper risk management , it has very good chances to move UP side but first we have to protect the down side , where risk management comes into game .
IMX/USDT , 1WIn Weekly if IMX breaks the Wedge pattern with strong candle close . it will move very fast (300%) like the same as past move . as the altcoins season is starting and slowing gaining momentum.
and at the same time Bitcoin dominance is decreasing and altcoins dominance is started increasing , so look on all the altcoins
and follow proper risk management , it has very good chances to move UP side but first we have to protect the down side , where risk management comes into game .

LRC/USDTLRC is moving inside the channel pattern in weekly , Now it is at support zone from where it can give amazing move (140% nearly) if the altcoins gain volume in market-cap .
and at the same time Bitcoin dominance is decreasing and altcoins dominance is started increasing , so look on all the altcoins
and follow proper risk management , it has very good chances to move UP side but first we have to protect the down side , where risk management comes into game .

SEI - MASTERCALL AGAIN! - +30% up.Another mastercall on NYSE:SEI - +30% up already ✅🔥
You know what's coming??? 🤑
Whyyy aren't you following me yet????

XTZ Secondary Trend. Channel. Wedge. Capitulation Zone. 07 05 20Logarithm. Time frame 1 week (less is not necessary).
The secondary trend has formed a horizontal channel for several years, with repeating wedge-shaped formations, the third time we entered under the support of this channel not by squeezes to collect long stop-loss, but by full candles and the structure of a descending wedge. It looks more vertical. The corrective movement to this semi-vertical wedge, quite possibly, will similarly have an aggressive character. The wedge is almost in the final phase of its formation. I showed percentages for clarity to the key reversal zones, for orientation for your money management and setting the first medium-term, and possibly local targets.
The main trend of this previously hyped cryptocurrency since 2017
XTZ/USD Main Trend. Descending Channel 01 2023

ZK Secondary trend.-82% Wedge. Reversal zones. 01 05 2025Logarithm. Time frame 3 days. Decrease from listing about -82%. For cryptocurrencies of such liquidity and capitalization, this is not the maximum decrease (-90-96%). But sometimes from such values as now (-82-85%), taking into account the news hype during the listing "whales $ 458 million", a reversal and strong pumping can occur under the market as a whole. For example, like another hype project of "hanging noodles" - Flare (distributed to XRP holders). Decrease by -82% and then pumping slightly above the listing price under the next alt season of the cycle + 560%.
This does not necessarily mean that this will happen, this is an example of what happens from such values of decline with such liquidity and hype. In some ways, not only in the structure of the TA formation, but in the hype and disappointment of "investors", the projects are identical.
Main trend , and the previously shown zone, in which the price is now.
ZkSync Main trend. L2 for ETH. $458 million funds 21 02 2025
Main trend now in the moment (full trading history).
There is no need to guess the minimums and maximums. It is important to know these zones and have an acceptable average price, from the position of the trend and its potential. It is regulated by the distributed entry volume (in advance) at potential reversal zones.

#XAUUSD in Consolidation After consolidating for months gold gave a bullish breakout. After a huge rally, before reaching its final target #XAUUSD #Gold taking a break now, before moving up further.
Currently it has formed a Bullish pennant formation.
Anyway being a technical trader, can get into entry after breakout confirmation.

$ONDO - READY TO FLY???CRYPTOCAP:ONDO - 15% up already 💰
You know what's coming?? 🚀
If yes, like & share! 👍

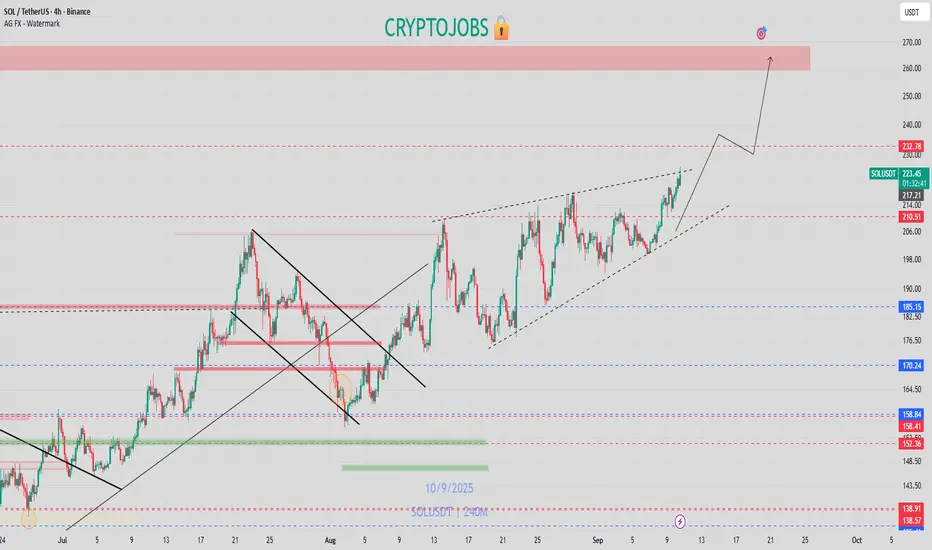
$SOL - ASCENDING ACCUMULATIONCRYPTOCAP:SOL - Ascending accumulation!
Strong uptrend daily; Bullish breakout awaited! 📈
Upper key resistance: 266 - 270$
GBPJPY Bearish PennantPatiently waiting for a break out and retest of this bearish confirmation pattern. There is also an inverted head and shoulders on the JPYBasket for extra confluence on the M15 TF.

1day xrp bullish pennantHard to tell which of these trendlines is the most valid top trendline and bottom trendline of this triangle/pennant so I have to include them all since any can potentially be. *not financial advice*

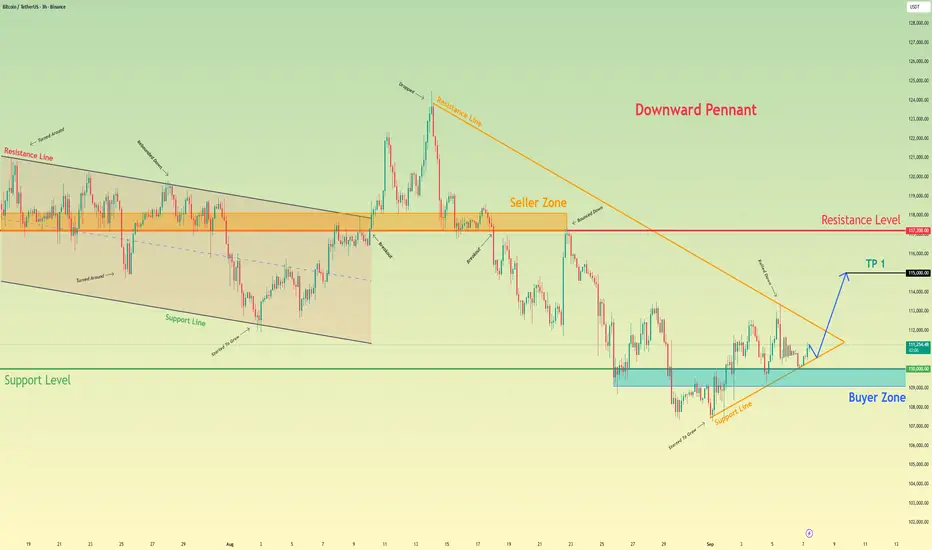
Bitcoin will exit from pennant and continue to growHello traders, I want share with you my opinion about Bitcoin. The market for Bitcoin has been undergoing a lengthy corrective phase, with the price action methodically descending since its last major peak. This bearish price action has been contained within a large downward pennant, a classic reversal pattern that suggests the preceding downtrend is losing momentum as volatility contracts. The price for BTC has been squeezed between the descending resistance line and an ascending support line. Currently, the asset is at a critical inflection point, as it is directly testing this ascending support line after a recent rejection from the upper boundary of the pattern. The primary working hypothesis is a long scenario, predicated on a bullish resolution from this dynamic support. The expectation is that buyers will defend this ascending support line, initiating a powerful rebound that is strong enough to cause a breakout above the pennant's main resistance line. This would signal a reversal of the recent downtrend. Therefore, the TP is logically placed at 115000 points, a prudent intermediate target aiming for a key area of prior price consolidation. Please share this idea with your friends and click Boost 🚀
POL - ready to fly!GM TEAM!
I see a Beautifull bullish candle close H4 on PSX:POL 📈
Time to moon?? 🚀

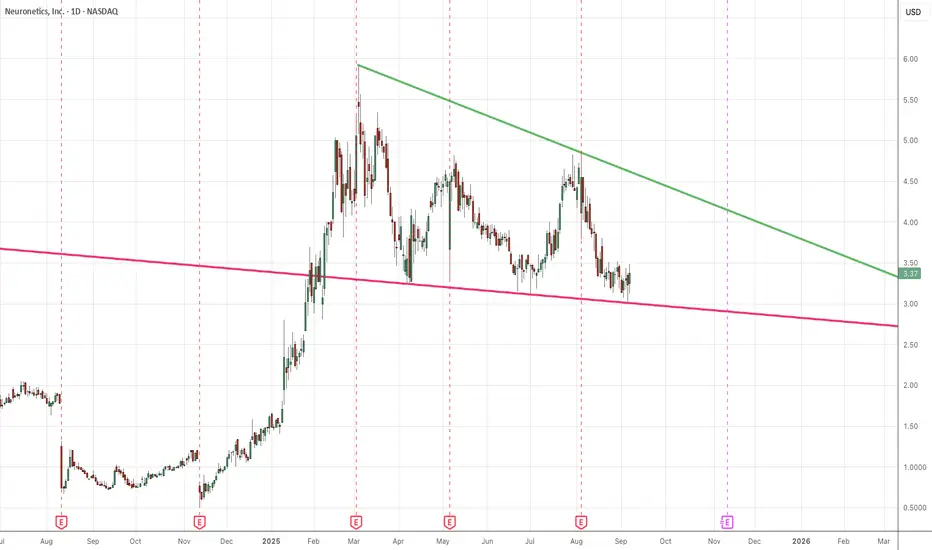
Excellent risk/reward scenario in $STIMIt appears that NASDAQ:STIM is in a bullish flag pattern. It is at a relatively excellent spot to begin a speculative position. The stop loss, I feel, should be around 2.98 - 3.00 which is about 11% or so to the downside. Optimally one would do better to get as close to the $3.00 mark as possible , which is doable since the stock has been in a relatively tight range for the past 13 days. I emphasize the word "relatively" in this post. For the upside, I think t would likely test the upper limits of this flag pattern, around $4.40, or ~30% higher. However, if this does beak the flag pattern to the upside, the measured move of this stock should be ~$5.30 from the base of the flag, which would put it around $8.30 or so. I feel this could happen, given the added boost of acquiring Greenbrook clinics last year. NASDAQ:STIM is expecting an increase of 58%EPS this year and is operating with a gross margin of 53%..This is a low float stock with only 40 million shares in the float, 12% of that is held short. Also of note.about $260,000 of Feb 5c calls traded near the ask today, so there is someone out there that also thinks this stock can go much higher. I would be long.
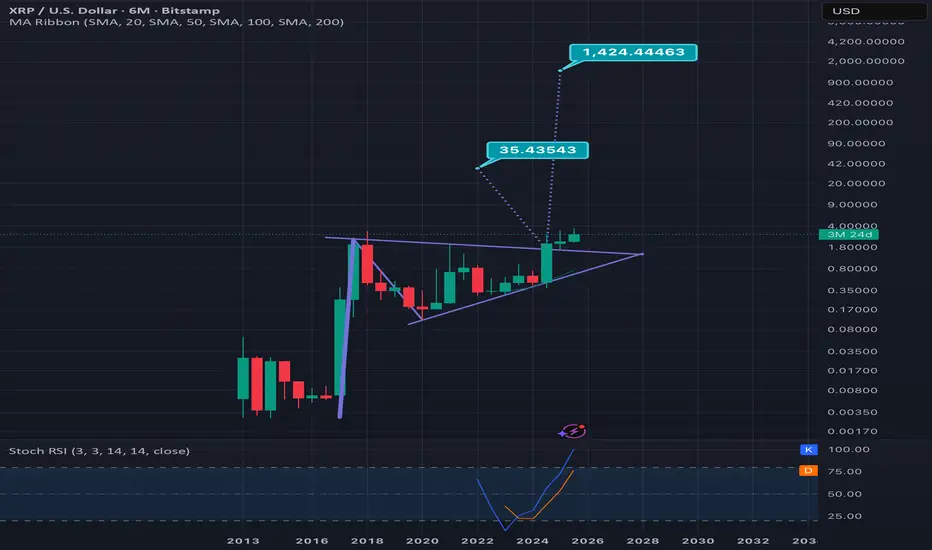
6 month log scale xrpusd chart updatedMy previous version of this chart I placed the breakout tarts arbitrarily before the actual breakout so I wanted to post an updated version with the two targets lined up directly at the point of the breakout. Smaller target is for just the triangle and the bigger target for the entire bullish pennant. Remember this being a 6 month time frame this could take several years still even to hit the highest target *not financial advice*

SEI - Bullish pennant daily & H4NYSE:SEI - Bullish pennant H4 playing well 📈
Upper monthly levels:
0.3700 - 0.380$
0.450 - 0.4600$
0.660 - 0.670$
TP2 hit already ✅
Patience, is key.

A potential path to 134kIt appears bitcoin is breaking up from a bulllish pennant who’s top trendline seems most valid on the 4hr chart, its bottom trendline most valid on the daily chart and its flag pole most valid on the weekly chart. Sometimes patterns will be cross timeline like that. If this is the pattern that is about to be validated, we should see confirmation in the form of price action using the dotted measured move line like a ladder and as support in the near future as well as also potentially resistance later on on the way to the target. When you see that type of thing occur, probability increases that this is the real breakout. *not financial advice*

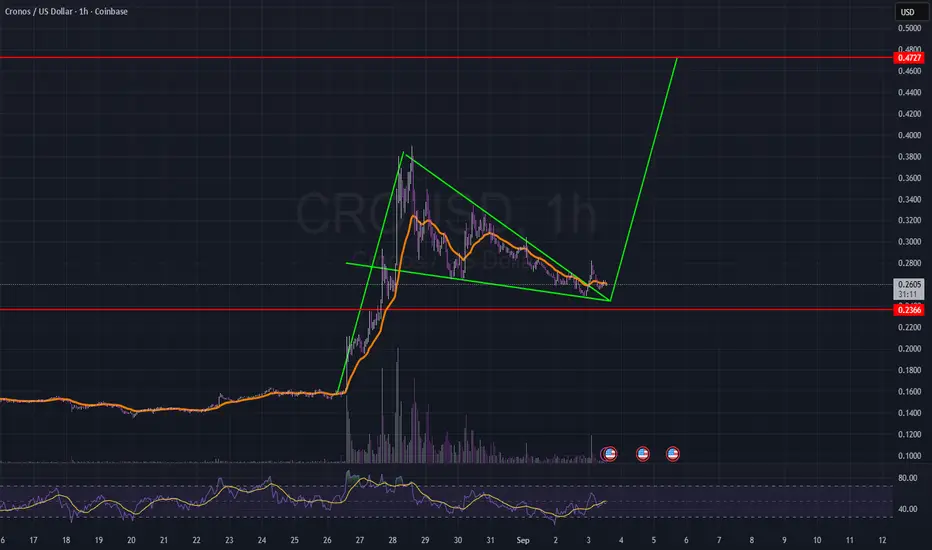
CRO Bullish pennantCRO broke out of bullish pennant. Possible to break down to last resistance. Anyway, my bags are full. Getting nice stake out of it.