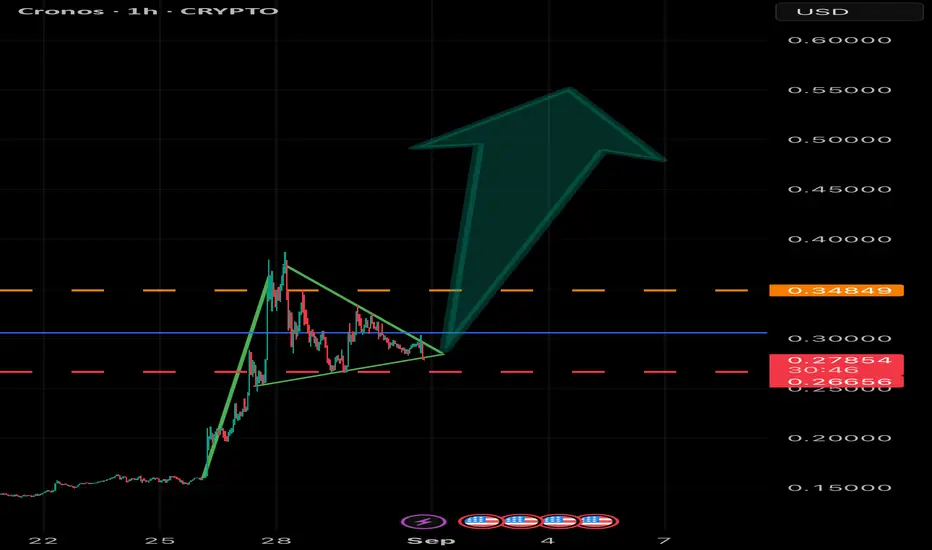
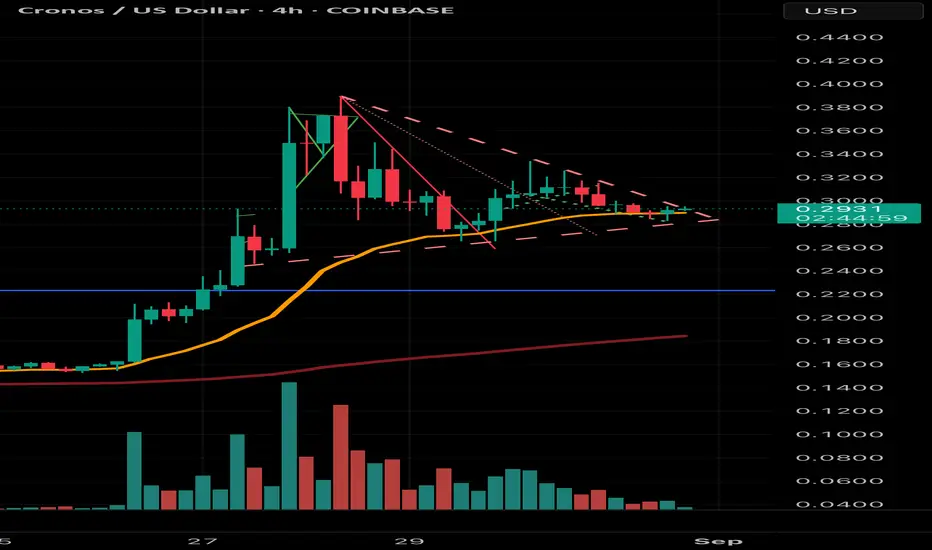
CRO - Bullish Pennant FormationBullish Pennant Analysis for CROUSD (based on provided chart as of late Aug/early Sep 2025):
• Flagpole: Sharp upward surge from ~0.15 to ~0.48 around Aug 28, driven by strong momentum, forming the pattern’s “pole.”
• Consolidation Phase: Post-peak, price enters a symmetrical triangle (pennant) with converging trendlines: declining highs (~0.48 to ~0.30) and rising lows (~0.27 upward), lasting ~1 week on 1H timeframe, indicating temporary pause in uptrend.
• Characteristics: Pattern resembles a small flag/pennant; volume likely decreases (not visible but typical); shorter duration fits bullish continuation criteria.
• Current Status: On Aug 31, 2025, price at ~0.279 is within the pennant, near apex, showing formation but no breakout yet. Down 4.63% suggests consolidation pressure.
• Breakout Signal: Bullish if price breaks upper trendline (~0.35) with rising volume; confirms continuation.
• Price Target: Measure flagpole height (~0.33), add to breakout point; potential target ~0.60-0.68.
• Invalidation: Bearish if breaks lower trendline below ~0.27, signaling reversal.
• Implications: High probability (~70% historically) of upward move if valid; watch for crypto market catalysts like BTC correlation.
Pennant
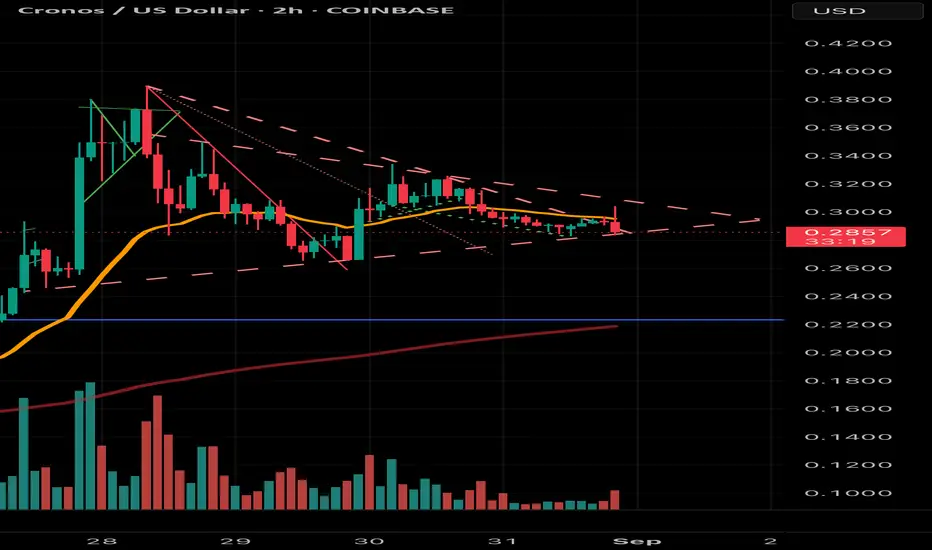
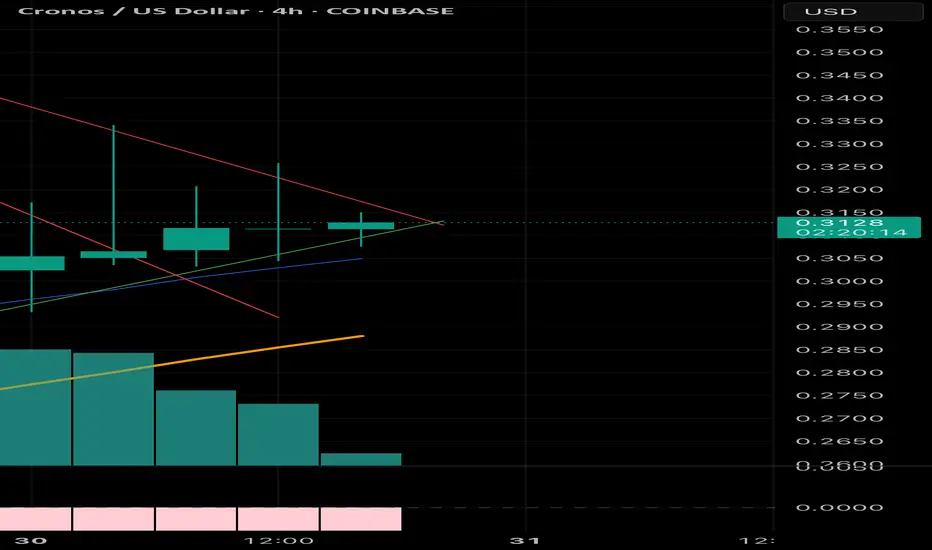
CRO Pennant Update - One more dayCRO is progressing along the pattern I’ve been suspecting, however, the pennant just expanded to the final adjustment, I think, which allows until Monday evening before the next up love begins. I do believe a big green candle will take place but just a feeling.
This is not investment advice and you should not make any trades based on my reads. This is just me sharing insights.
DDP 👊🏼👊🏼
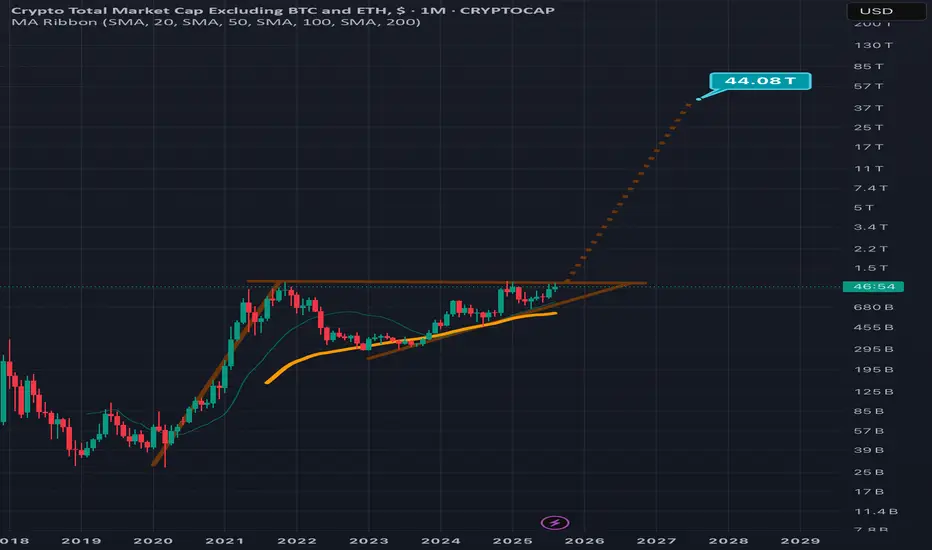
Monthly logarithmic chart on total3 suggests it could 44x!On the total3 chart we can see the majority of altcoins (excluding ethereum) have been consolidating for quite a long time in this ascending triangle which s also a bullish pennant. These patterns break to the upside far more than they break to the downside and this current one is nearing its apex. If we clued the pole of the pennant to calculate the Bullish breakout target/measured move, we can see that the target is 44 x higher than the current price. Of course this beng a logarithmic scale pattern, it may not ht its full 100% breakout target for multiple years even, but the angle of the measured move line does suggest we could see it reach such heights by 2028 and possibly even before it. *not financial advice*
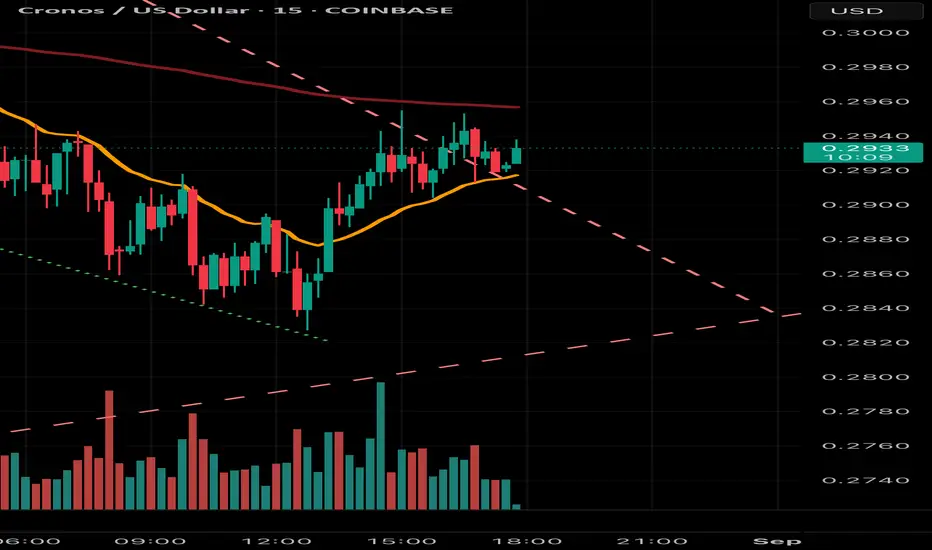
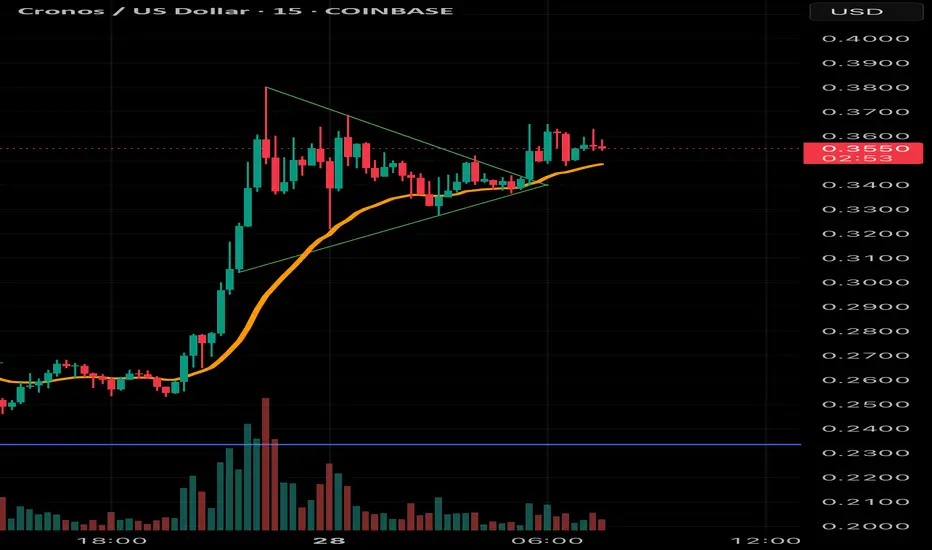
8, 15-min candle closes outside the pennant flagPrice is closing consistently outside the pennant flag on the shorter timeframes. This is a good sign that the continuation is close. Price is just creeping out sideways, at some point it’ll move up more quickly.
CRO Looks Like It Will Resume Upward Trend NowMy assessment that price would continue up last night was off by a day, as the market structure kept developing and price action caused the pennant flag formation to get bigger. It does look like this continuation of the upward price action will continue by midnight, as we’re deep into the apex of the flag and on the 4-hour price is sitting on top of the 21-day EMA and CRO is in an uptrend. Couple this with alt-season being in full swing now, and the potential seems really strong that this will continue soon.
DDP
- not trading or financial advice just my insight and I’m not an investment adviser. If you make a trade based on this you can lose all or part of your money…or you could make a ton of 💰💰 COINBASE:CROUSD .
CRO Bull is Resuming, ConfirmationContinuation of my previous posts on Trading View and X . CRO’s strong downward move that started yesterday seems to be over.
After inking 7 straight green 4-hour candles, working #8, and about to break out of a final downtrend line, CRO seems destined to continue its upward trajectory. Today CRO price almost full recovered and I suspect it will ink a strong green candle out of this pennant flag it’s been forming since yesterday. There’s a possibility of a final shakeout down before a strong move out of the w pennant, but I feel price will just move up strong. The price has to close about .3271 to confirm the bull trend is resuming. I suspect the upside move will be significant from here before 8p EST.
BTCUSD Long: Breakout and Rally to 116500 levelHello, traders! The prior market structure for BTCUSD was a bullish ascending channel, which concluded with a pivot point high near the 118900 supply area. A subsequent breakdown from this channel shifted the market's momentum, initiating a corrective phase that took the form of a descending pennant. This bearish structure guided the price auction down to the major demand area around 112000, where a new pivot point low was established.
Currently, the price is consolidating within the final stages of this descending pennant, coiling between the supply and demand lines. The auction is approaching the apex of the pattern, but before a final resolution, one more test of the lower boundary is anticipated. The immediate expectation is for a final corrective move downwards to test the ascending demand line near the 112000 demand area.
The primary scenario anticipates a bullish resolution following this final test of support. The price is expected to reverse from the demand line, initiating a rally strong enough to break out above the descending supply line. Following the breakout, a brief retest of the broken line as new support would confirm the shift in control to buyers. This successful retest would then be the trigger for a continuation of the rally. The take-profit is therefore set at the 116500 level, targeting a key area of prior market imbalance. Manage your risk!

Hitting new recent highs breaking out of a pennant consolidationCRO seems prime for another leg up. After a few days of strong upside it’s running into resistance on the weekly chart, but even though it is at a current high, not all-time I’ll add, CRO still has significant upside potential .
CRO is consolidating strongly after breaking out of a pennant consolidation - on all charts 4-hour and under it can be seen, you will not see it on the daily. The resistance it encounters now traces back to November 2021 through April 2022 — on the weekly its more easily seen.
I am not an investment adviser, and this is NOT investment advice. Crypto is very volatile and you could lose your shirt if you listen to what I’m saying or think I’m advising you to buy. However, since transparency is key, after taking a nice profit yesterday doing an 1-hour trade, and then deeper analysis I’ve personally invested $$$ tens of thousands at this level based on my analysis of the trend continuation.
DO NOT BUY CRO unless you are prepared to lose money. I have a much higher risk tolerance than most and this could be a dangerous, losing trade, but I do feel it will be a real nice win today . If you follow me and my advice and you lose, it’s your fault not mine. Oh also, if you buy and it starts going up, the minute you get that feeling “I’m going to be rich”… SELL right away and take your damn profit!
DDP 👊🏼👊🏼☝🏼🙏🏼
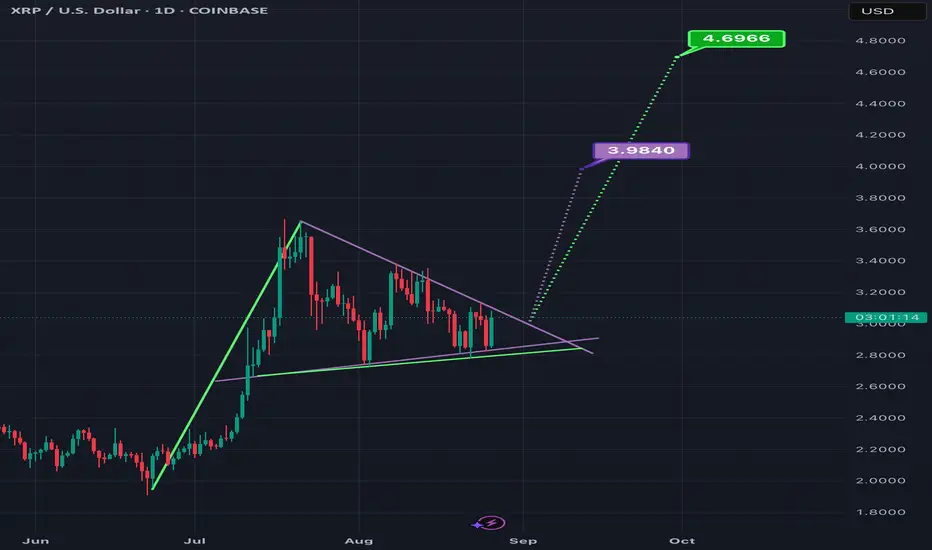
Symmetrical Triangle/ Bull Pennant on XRPUSD Nearing its ApexThe bottom trendline of this triangle definitely seems to have finally been narrowed down to this purple line and green line with multiple touch points to back that up. *not financial advice*

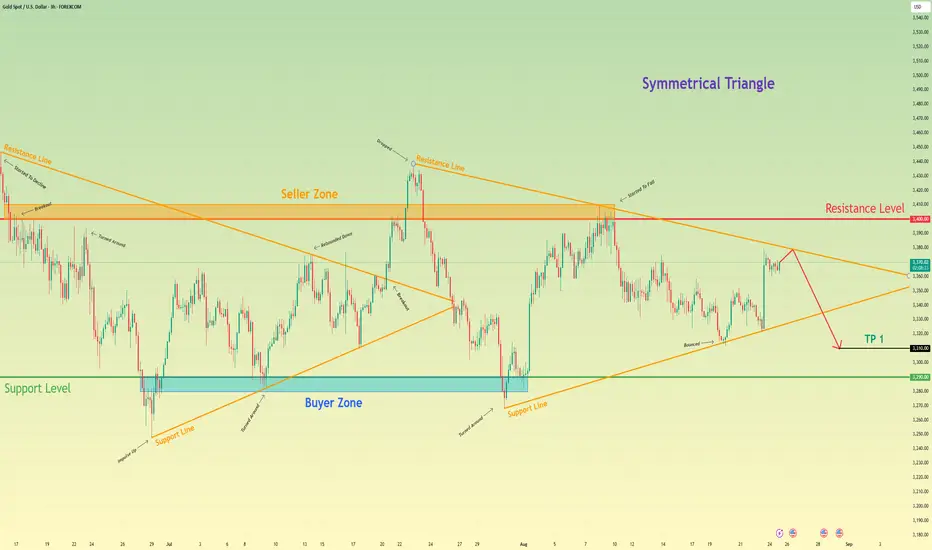
Gold will drop from resistance line of triangle to 3310 pointsHello traders, I want share with you my opinion about Gold. The market for Gold is currently defined by a large symmetrical triangle, a pattern of equilibrium that has formed after a strong rebound from the 3290 buyer zone halted the previous downward trend. This new market structure indicates a period of contracting volatility, with the price action for XAU being methodically squeezed between a descending resistance line and an ascending support line. These boundaries are anchored by the major seller zone around the 3400 resistance level and the aforementioned 3290 buyer zone. At present, the asset is at a critical inflection point, having rallied to test the descending resistance line of this triangle. The primary working hypothesis is a short scenario, based on the expectation that the 3400 seller zone will hold and that sellers will re-emerge to defend this territory. A confirmed rejection from this upper boundary would validate the integrity of the symmetrical triangle and likely initiate another major downward rotation within the pattern. This fall would target the ascending support line and the underlying horizontal support. Therefore, the TP for this rotational play is logically placed at 3310 points. Please share this idea with your friends and click Boost 🚀
Gold coils beneath record high, bulls on alertWhether you call it a bull pennant or an ascending triangle, it’s hard to ignore the coiling in gold beneath the April record highs, keeping traders on alert for a potential bullish breakout.
The latest bounce off uptrend support, fuelled by Jerome Powell’s dovish pivot at Jackson Hole, has gold within reach of downtrend resistance from those highs, sitting near $3390 this week.
A break of the uptrend, especially if matched by a push beyond the $3408 May peak, could draw in fresh bulls targeting a retest of April’s $3500 record. Longs could be established on the break, with stops beneath the downtrend or $3408 depending on entry level. Resistance at $3435 remains an early hurdle, with gold stalling above it on four prior occasions. If the mid-June high near $3450 gives way, there’s little technically blocking a run towards $3500 or beyond.
While weekly RSI (14) and MACD hint at waning momentum, the overall signal still marginally favours the topside.
Good luck!
DS

SUDARSHANCHEMSUDARSHANCHEM showing very good strength and consolidating since a month near ATH. Result is expected tomorrow on 25-Aug. If it declares bumper result then we may see next leg of steep rally. In recent time accumulation has been observed. Provided that if it closes above 1380 level then one may get very good risk-reward trade from hereon. Keep a stock in watch list. Just a small volume may push it above resistance line.

Bitcoin will bounce from buyer zone and start to growHello traders, I want share with you my opinion about Bitcoin. The broader market context for Bitcoin has been one of prolonged and volatile consolidation, with price action largely contained between two dominant control zones: a major seller zone capping rallies near 120000 and a foundational buyer zone providing strong support around 112000. After the most recent rejection from the upper boundary, the asset has undergone a significant downward correction, which has taken the shape of a smaller descending triangle. Currently, the price has reached a critical inflection point, as it is testing the apex of this triangle directly at the major horizontal support level of 112000. The primary working hypothesis is a long scenario, which anticipates that the strong historical demand within the buyer zone will absorb the recent selling pressure and initiate a powerful rebound. This rebound is expected to be strong enough to cause a breakout from the descending triangle, signaling a shift in short-term momentum. The scenario further anticipates a brief retest of the broken triangle's resistance line from above to confirm it as new support. Following a successful retest, the path would be clear for a continued rally. Therefore, the tp for this move is logically placed at the 117000 level. Please share this idea with your friends and click Boost 🚀
Disclaimer: As part of ThinkMarkets’ Influencer Program, I am sponsored to share and publish their charts in my analysis.

Oil Prices Drop on Russia-Ukraine Talks HopeOil prices decline in anticipation of potential negotiations between Russia and Ukraine
U.S. President Donald Trump announced plans to facilitate a meeting between Ukrainian President Volodymyr Zelenskiy and Russian President Vladimir Putin, following his Monday summit with Zelenskiy and European leaders. Zelenskiy called the talks with Trump “very productive,” highlighting discussions on U.S. security assurances for Ukraine. A resolution to the Russia-Ukraine conflict could lift sanctions on Russian energy exports, freeing up crude oil trade. Oil prices have dropped around 10% this month due to trade tensions and increased OPEC+ production.
Technically the price consolidates below the intermediate 6,300.00, forming the bearish pennant. Price is getting ready to decline. Here, the first target will be the major level of 6,000.00.

TSLA consolidation is looking more and more bullish
Last week, the pennant consolidation pattern was broken with a higher high (HH)
Uptrending RSI
Current $330 support is reinforced with the 50 and 20 SMAs
And some reminders
Price is above 200SMA -> stock is in bullish territory

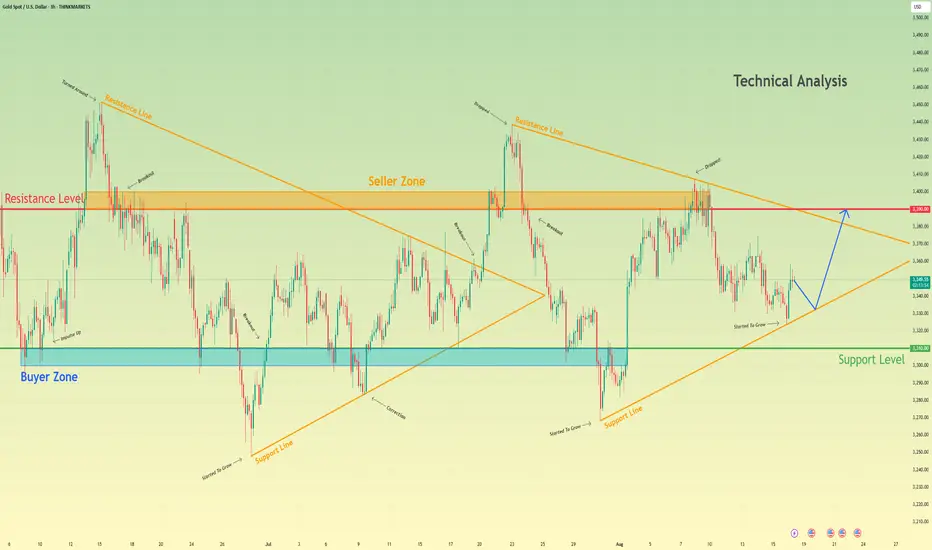
Gold can make correction and then continue to move upHello traders, I want share with you my opinion about Gold. The price market is currently in a state of equilibrium, consolidating within a large symmetrical triangle after a significant upward rebound from the recent lows near the 3310 buyer zone. This reversal invalidated the prior downward trend and has since forced the price into a period of balance, characterized by contracting volatility between a descending resistance line and an ascending support line. The price has been methodically rotating within this structure, with the seller zone around the 3390 resistance level consistently rejecting bullish attempts. At present, the asset is undergoing another downward correction, approaching the critical ascending support line of the triangle for a key test. The primary working hypothesis is a long scenario, based on the expectation that buyers will once again defend this dynamic support and maintain the integrity of the consolidation pattern. A confirmed and strong bounce from this support line would signal the start of another major upward rotation within the triangle. Therefore, the tp for this long idea is strategically placed at the 3390 level. Please share this idea with your friends and click Boost 🚀
Disclaimer: As part of ThinkMarkets’ Influencer Program, I am sponsored to share and publish their charts in my analysis.
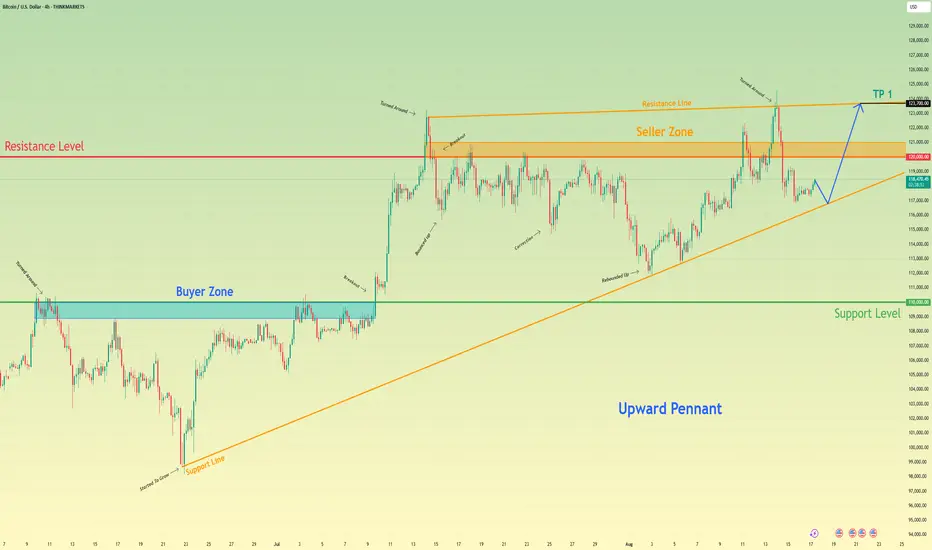
Bitcoin may bounce up of support line and break resistance levelHello traders, I want share with you my opinion about Bitcoin. Following a powerful upward trend and a significant breakout, bitcoin has established a new and higher territory for its price action, leading into the current phase of extensive consolidation. This consolidation has taken the form of a large upward pennant, a classic pattern of contracting volatility where the price is being squeezed between a descending resistance line and an ascending support line. The market has been rotating within these boundaries, with the seller zone around the 120000 resistance level capping rallies and the dynamic support line providing a floor for pullbacks. Currently, the asset is positioned at a critical juncture, testing the ascending support line of this multi-week formation after a corrective move down. The primary working hypothesis is a long scenario, based on the expectation of a successful upward rebound from this dynamic support. A confirmed bounce would validate the integrity of the pennant and suggest that another full rotation to the upside is the most probable path. This move would first challenge the horizontal resistance at 120000. Therefore, the ultimate TP for this rotational play is logically set at the 123700 level, as this precisely targets the upper resistance line of the pennant, representing the completion of the swing and a key decision point for a potential future breakout. Please share this idea with your friends and click Boost 🚀
Disclaimer: As part of ThinkMarkets’ Influencer Program, I am sponsored to share and publish their charts in my analysis.
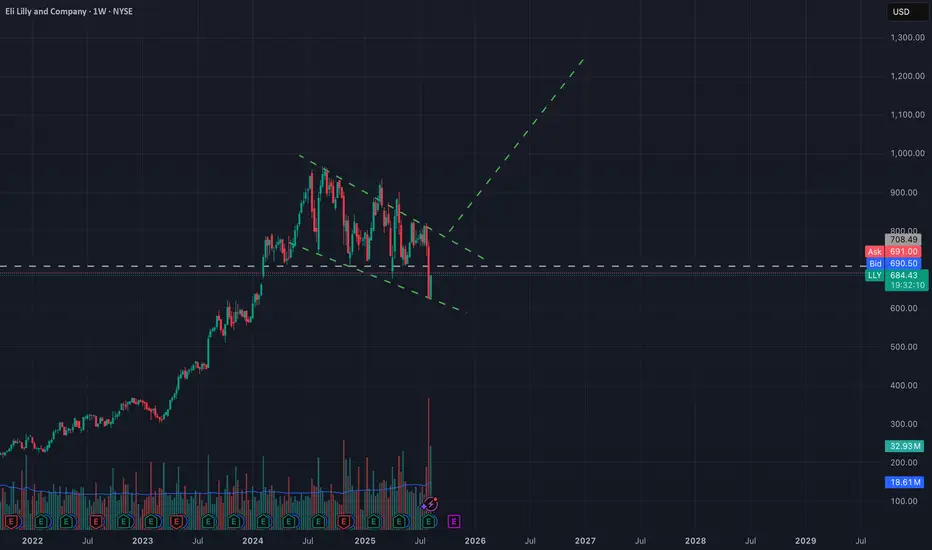
LLY - Clean LevelsBull flag patten on the LLY weekly Chart. The base of the flag/channel has been reactive so far although with low volume (See previously boxed LLY chart) off the top of the recent boxed range.
If you look at the previous chart, you will see that LLY is currently floating up through a low volume node on the anchored volume profile. Unless sellers step in here, 708.49/709 - 711.44 is the next target.
Volume will be in that area, if buyers step in, could be great for calls. Otherwise we could see a look above and fail of the top boxed range(again see previous chart under related publications to the right of this post).
~The Villain
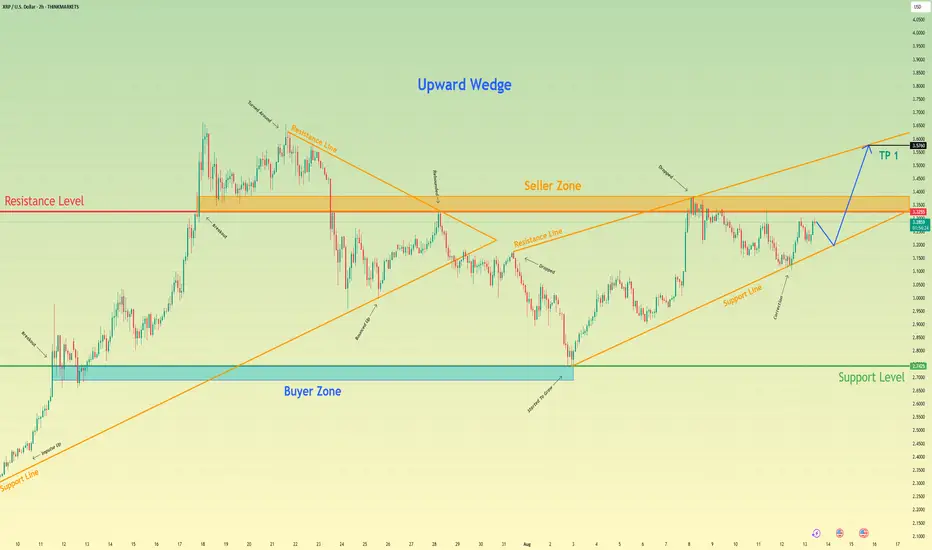
Ripple will continue to grow in wedge and break resistance levelHello traders, I want share with you my opinion about Ripple. The price action for Ripple has been methodically developing within the confines of a large upward wedge. This pattern has defined its strong upward trend since the last major rebound from the buyer zone around 2.7425. This structure has guided the asset higher through a series of corrections and upward rebounds, showcasing a sustained campaign by buyers. Currently, the price is at a critical juncture, consolidating directly below the significant horizontal resistance level at 3.3255. This level, which is also a major seller zone, has previously capped rallies and represents the most immediate obstacle to a continuation of the uptrend. The primary working hypothesis is a long scenario, based on the expectation of a decisive breakout above this resistance. Such a breakout would signify that buyers have absorbed the available supply and are ready to push the market to a new high. The scenario anticipates that following the initial break, the price will perform a corrective retest of the 3.3255 level, treating the former resistance as new support. A confirmed bounce from this retest would validate the breakout and provide the impetus for the next impulsive wave higher. Therefore, the TP for this continuation move is logically placed at the 3.5760 level, which aligns perfectly with the upper resistance line of the entire upward wedge formation. Please share this idea with your friends and click Boost 🚀
Disclaimer: As part of ThinkMarkets’ Influencer Program, I am sponsored to share and publish their charts in my analysis.
EURUSD Bulls Defend 1.16 – Break Above 1.17 Could Ignite RallyOn Monday, I mentioned that EURUSD could extend its ascent thanks to a short-term pennant formation.
For this reason, I bought into dips and, fortunately, my stop loss was well placed — the pair reversed only 5 pips above it.
Now, the trade is sitting comfortably with a 40-pip profit, and in my view, the upside potential isn’t over yet.
Technical view:
• On Monday, EURUSD dipped to test the 1.1600 support zone.
• The bounce from there resumed the uptrend that started after this month’s NFP release.
• The pair is now challenging the horizontal resistance around 1.1700.
A clean break above 1.1700 would likely open the door to the 1.1800 area.
Bias: EURUSD remains bullish as long as 1.1600 holds. 🚀
Disclosure: I am part of TradeNation's Influencer program and receive a monthly fee for using their TradingView charts in my analyses and educational articles.

Bullish pennant forming on 1hr?ETH/USD appears to be forming a bullish pennant on the 1H chart following a strong impulsive run from $4,290.64 to $4,518.60. The consolidation is converging toward the apex with declining volume, consistent with continuation pattern behavior.
Breakout Projection :
Pole height : $227.96
Estimated breakout point : ~$4,622
Target : ~$4,842
Invalidation : Breakdown below the lower pennant trendline with strong volume before breakout would invalidate the bullish pennant thesis.
This is not financial advice. It is merely an observation of an optimistic apparent pattern formation. Always do your own research and assess your own risk tolerance before making any trades.
