Sequent Scientific Ready for Bounce| Key Levels in Play . This is the daily timeframe chart of Sequent Scientific.
The stock is moving within a well-defined structure, showing strength despite a volatile market environment.
Key support levels: 200 and 170
EMA support: Near the 190 level
Resistance zone: Around 270
If these support levels sustain, the stock may witness a further upside move in the coming sessions.
Thank you.
Pharmastocks

Max Healthcare Showing Strength Near Support ZoneThis is the daily timeframe chart of Max Healthcare.
The stock is moving within a well-defined channel and is currently trading near the support zone at 1090–1120.
Trendline resistance is placed near the 1200 level; a breakout above this zone may lead to new highs.
If the support zone holds, we may see higher prices in Max Healthcare.
Thank you !!

"LLY's Bear Market Mode ON | Crash Incoming"“ LLY is gearing up for a sharp correction down to the $35–$17 zone — a critical reset that could flush out weak hands before the next explosive bull run. Stay sharp, this is where big opportunities form. ⚠️
🔥 Summary:
Eli Lilly (LLY) looks ready for a major market reset after completing a historic five-wave climb. This could be the start of a long-term corrective Wave 2 , potentially wiping out years of gains before the next explosive super-cycle takes off. The bull run isn’t over — but it’s taking a serious pause. ⚠️📉
🌊 Wave Theory Outlook
LLY’s multi-decade Elliott structure shows a completed Cycle Wave 1 peaking near the 2.618 extension zone around $1029. Historically, such extensions often mark exhaustion.
Next comes Wave 2 , which could retrace deep into the $35–$17 zone (the 0.618–0.786 Fibonacci region and prior structural base). Expect a complex W-X-Y pattern , shaking weak hands before a powerful Wave 3 bull expansion later this decade.
📉 Price Action & Smart Money Context
The chart shows exhaustion wicks, momentum divergence, and slowing volume — classic signs of distribution .
Smart money is likely off-loading near the highs , preparing to reload at discount levels once liquidity below 2020–2022 lows is taken.
Expect liquidity sweeps, imbalance fills, and a long-term accumulation base forming near the orange demand zone before the next breakout.
💰 Fundamental Alignment
Despite incredible fundamentals — obesity and diabetes drug leadership, global demand growth, and innovation — valuation gravity always returns .
A deep correction would align price with sustainable earnings and provide institutional re-entry opportunities at fair value.
🧠 Traders ,
"the charts are whispering — a major LLY correction is loading.
Our projections highlight the $35–$17 zone as the key accumulation region before the next super-cycle.
Stay alert, plan your levels, and don’t fight the wave. 🌊📉
Where do you think LLY bottoms out? Share your thoughts below 👇”
— Team FIBCOS
#LLY #EliLilly #BearMarket #Correction #WaveTheory #SmartMoney #ElliottWave #Fibcos #TechnicalAnalysis #PriceAction #Investing #PharmaStocks #StockMarket #MarketCycle #ChartAnalysis #Bearish #Wave2 #TradingView #StockAlert #MarketReset

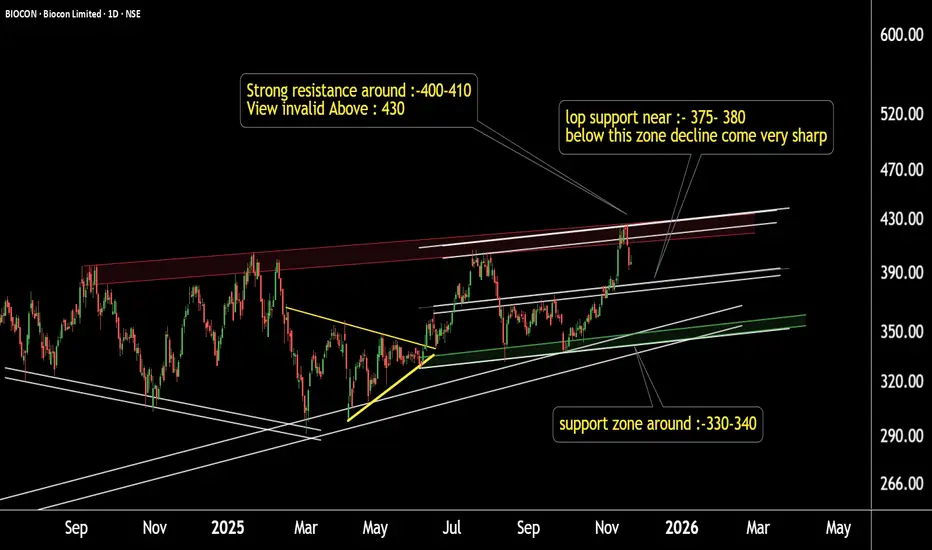
Biocon Under Heavy Selling Pressure — Momentum Turning WeakBiocon – Daily Timeframe Update
This is the daily timeframe chart of Biocon.
The stock is showing a sharp decline and may take a pause near its first LOP support at 370–380.
If this support breaks, the next strong support zone lies at 330–345, from where a potential reversal can be expected.
Thank you !!
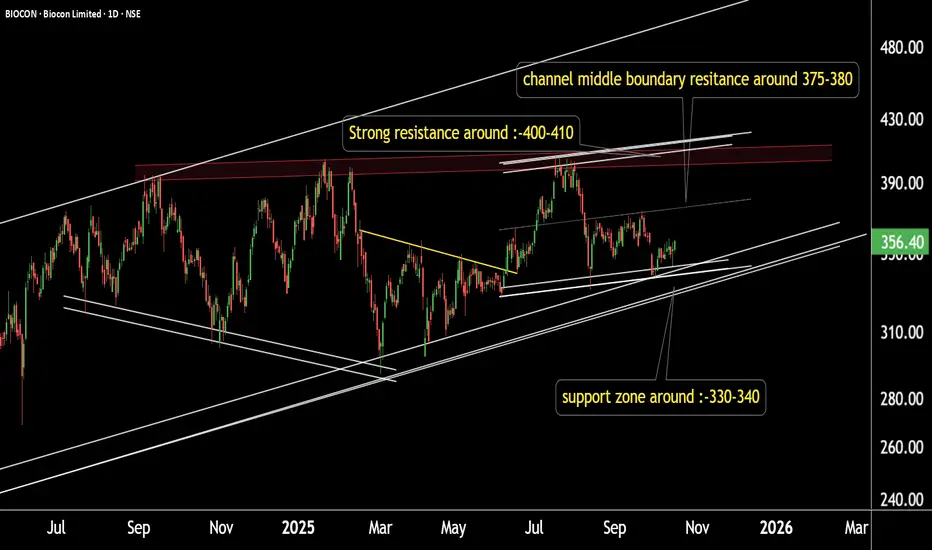
“Biocon Showing Strength — Support Zone Intact!Biocon Technical Update (Daily Timeframe)
Biocon is holding a strong support zone around ₹330–340, which is being respected across multiple timeframe structures. Within the stock, a smaller parallel channel is forming, whose support also aligns with the ₹330–340 range.
The mid-boundary of this short-term channel is near ₹375, while the upper boundary sits around ₹400–410, which may act as short-term and long-term resistance levels.
If the support zone continues to hold, Biocon may witness upside momentum in the coming sessions.
Thank you!
Novo Nordisk Setup – Is This the Pharma Sector’s Strongest Play?🚀 NVO "Novo Nordisk" – Wealth Strategy Map (Swing/Day Trade)
📈 Trade Plan (Bullish Setup)
Trend Confirmation: The bullish trend is supported by Dow Theory accumulation phase 📊.
Candle Signal: A Heikin Ashi Doji has formed, adding confluence to the setup.
Indicator Alert: LSMA (Least Squares Moving Average) line has confirmed a breakout, reinforcing the bullish case.
🎯 Entry Strategy (Layering Style)
This plan uses a layered entry approach — placing multiple buy-limit orders across price levels to scale into the trade:
Layered Buys: 54.00 → 55.00 → 56.00 → 57.00
(⚡ You can expand your limit layers further depending on your own preference and risk appetite.)
✅ This layered method allows flexibility, smoothing entries instead of relying on a single price level.
🛡️ Risk Management
Stop Loss Idea: Suggested protective stop near 52.00 🔒.
📢 Note: Risk is personal! Adjust your SL to fit your risk tolerance, capital, and trading style.
🎯 Profit Target
Target Zone: 66.00 (area of heavy resistance + possible overbought levels ⚡).
⚠️ Note: Exiting before the “crowd trap” forms is key — take profits wisely when conditions match your own plan.
🔗 Related Pairs to Watch
NYSE:NVO (Primary)
NYSE:LLY (Eli Lilly) 🧬 – Correlated pharma sector, often mirrors biotech sentiment.
SP:SPX / AMEX:SPY 📊 – Broader market direction can impact large-cap pharma momentum.
$USD/SEK 💱 – Novo Nordisk is Danish; currency fluctuations sometimes influence investor flow.
Keeping an eye on these correlated assets can improve timing and risk management.
✨ “If you find value in my analysis, a 👍 and 🚀 boost is much appreciated — it helps me share more setups with the community!”
#NVO #NovoNordisk #Stocks #SwingTrade #DayTrade #StockMarket #Bullish #HeikinAshi #DowTheory #TradingStrategy #PharmaStocks #LayeredEntries #RiskManagement

BIOCON:Support Zone Holding Firm – Eyes on Next Upside MoveBIOCON – Daily Timeframe Analysis
Support Respect: BIOCON is currently respecting its 2023 support zone.
Current Level: The stock is trading near the 320–330 range.
Next Support: If this zone breaks, the next major support is placed around 285.
Bullish Scenario: Sustaining above these key support levels may lead to a strong upward move and potential new highs in the stock.
Thank you.

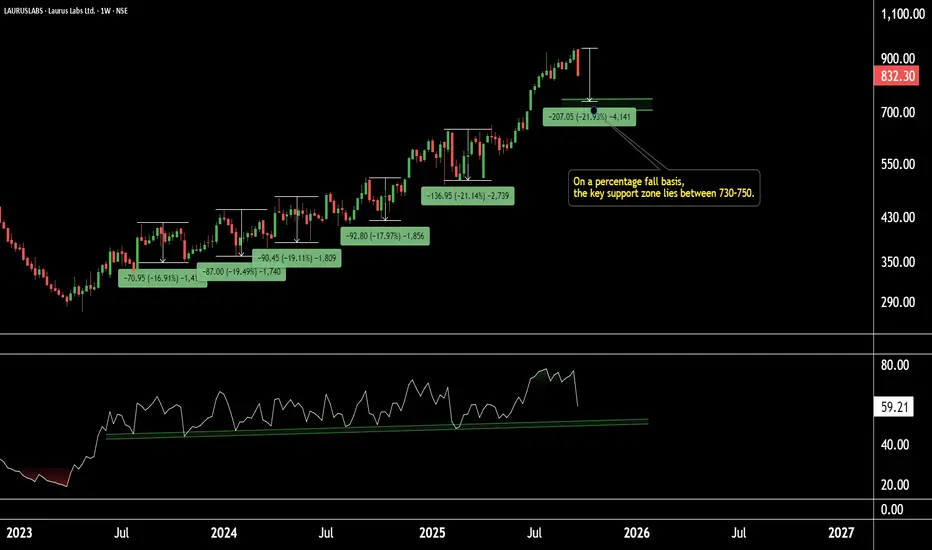
Laurus Labs | Price Action Buying Zone on RadarLaurus Labs | Weekly Technical Outlook
On the weekly timeframe, Laurus Labs has been showing consistent corrections of around 19–20% in each fall.
Currently, the stock is approaching a strong support zone near 700–730, where the weekly RSI is also holding support.
If this level sustains, Laurus Labs has the potential to see higher price levels in the coming sessions.
Thank You !!
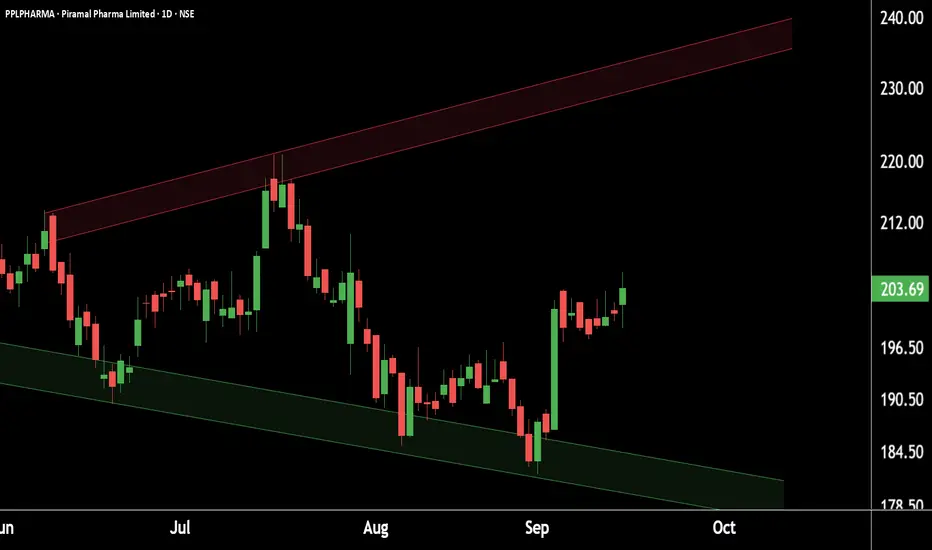
Piramal Pharma setting up for a breakout – pattern looks strong!This is the daily chart of Piramal Pharma (PPLPHARMA).
PPLPHARMA is forming a Bow & Tie pattern and has reversed from the support zone, currently sustaining in the ₹195–200 range.
If this level holds, we may witness higher prices with a potential upside target around ₹230.
Thank you !!
Ironwood Pharmaceuticals | IRWD | Long at $0.61Ironwood Pharma NASDAQ:IRWD stock dropped ~89% in the past year due to disappointing Phase 3 Apraglutide trial results, FDA requiring an additional trial, weak Q1 2025 earnings (-$0.14 EPS vs. -$0.04 expected), high debt ($599.48M), and analyst downgrades. So why would I be interested in swing trading this company? The chart. The price has entered my "crash" simple moving average zone, which often results in a reversal - even if temporary. Also, Linzess (GI drug) revenue is steady, and I thoroughly believe that alone pushes the fair value near $0.95, if not higher. Thus, at $0.61, NASDAQ:IRWD is in a personal buy zone with the potential for additional declines before future rise.
Target:
$0.95 (+55.7%)

Novo Nordisk (Revised) | NVO | Long at $47.78**This is a revised analysis from February 5, 2025: I am still in that position, but added significantly more below $50**
Novo Nordisk NYSE:NVO is now trading at valuations before its release of Wegovy and Ozempic... From a technical analysis perspective, it's within my "major crash" simple moving average zone (gray lines). When a company's stock price enters this region (especially large and healthy companies) I always grab shares - either for a temporary future bounce or a long-term hold. While currently trading near $47 a share, I think worst case scenario here in 2025 is near $38-$39. Tariffs may cause a recession in the second half of 2025, so no company would be immune.
As mentioned above, I am still a holder at $86.74. However, I went in much heavier within my "major crash" simple moving average band and have a final entry planned near $38-$38 (if it drops there). My current cost average is near $55.00.
Why do I still have faith in NYSE:NVO ? Because no one else does right now, yet it generated $42 billion in revenue, $14 billion in profits, and has significant cash flow YoY. The company has a massive pipeline, despite Wegovy and Ozempic competition, and I think the market is undervaluing its position in the pharmaceutical industry.
Revised Targets in 2028:
$60.00 (+25.6%)
$70.00 (+46.5%)
$80.00 (+67.4%)

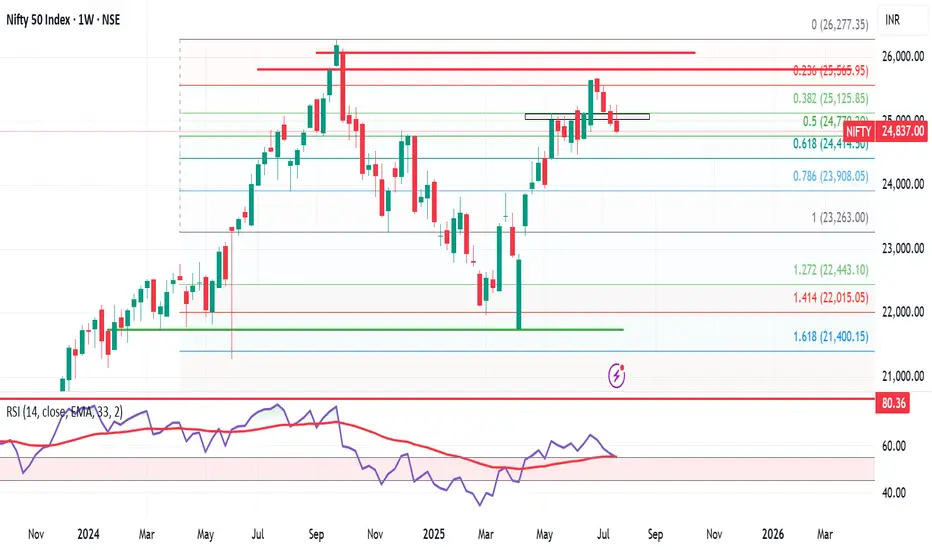
Nifty Weekly Market Update – Brace for Bearish Momentum? Nifty ended the week at 24,837, down 131 points from last week’s close. It made a high of 25,246 and a low of 24,806, staying perfectly within my projected range of 25,400–24,500.
As highlighted earlier, Nifty has now formed an inverted hammer on the weekly chart — a classic bearish reversal candlestick. 🔍
📅 Flashback: On 6th July, I mentioned giving bulls 10–15 days of playtime. That phase seems to be ending. The monthly time frame remains bearish, and now the weekly chart is aligning, indicating a stronger downside risk.
🔮 What’s Next?
👉 Expect Nifty to trade between 25,300–24,400 in the coming week.
👉 A break below 24,400 could open doors to 23,900.
👉 If 24,400 holds, bulls may still have a chance to regroup.
🧠 Pro Tip: Only Nifty Pharma is showing resilience. Those looking for long trades should focus on strong pharma stocks — the rest of the sectors are showing bearish signs.
Meanwhile in the US:
S&P 500 hits another all-time high, closing at 6,388, up 90 points from last week. My long-standing target of 6,568 now looks well within reach.
But here’s the catch — despite US strength, it’s not supporting Indian markets. If US markets correct, expect intensified selling pressure in India.
🎯 Strategy for Indian investors:
Let the bears rule till 7–8 August. Stay alert, and be ready to grab high-quality stocks at bargain prices. This is not the time to panic, but to prepare smartly.
Lupin At Best Support !! This is the 4 hour chart of Lupin .
Lupin appears to be forming a potential Three Drives bullish reversal pattern, with both drives terminating at the 1.27 Fibonacci extension level, indicating a possible exhaustion of the downtrend.
Lupin is trading within a well-defined descending channel. It has once again approached the lower boundary of the channel, which lies around the 1865–1880 zone, and is showing signs of a bounce.
If this level is sustain , then we may see higher prices in Lupin.
Thank You !!

Novartis | NVS | Long at $99.00As one of the largest pharmaceutical companies in the world, Novartis NYSE:NVS is poised to grow well into 2027. It's trading at a 17x P/E, earnings are forecast to grow 7% per year, it has low debt, and has been raising its dividend over the past few years (3.8%). The price on the daily chart is nearing the historical simple moving average line and may be poised for another move up. However, entry into the lower $90's or even $80's is still not off the table and, in my view, a great opportunity. Thus, at $99.00, NYSE:NVS is in a personal buy zone.
Target #1 = $110.00
Target #2 = $120.00

Finally a stock I like...this one is a real dealFinally, an investment idea! (after how much doom and gloom?) — Novo Nordisk.
You will all be familiar with Ozempic, the Danish company’s flagship product and the reason so many celebrities, influencers, b listers and regular schmegular Americans are suddenly skinny. I ignored the stock for most of ‘23/24, because it was so expensive. I am still a value investor (for my sins) and I just didn’t see a lot of value there — it was priced in.
Imagine my surprise as I was thinking about “megatrends” (vom) for the year ahead — AI, data, 'zempy. Novo stock has fallen 37.80% in the last six months. And you know what that means…that’s a real deal!
Why is it a real deal? (Don’t you like booze stocks Eden?)
Ozempic is not going away. At this point it is synonymous with weight loss as “Uber” is to ridesharing or Google is to search.
Note this data per Barclays, from recently issued rx data in the US — Ozempic script issuance has grown +8.4%, while WeGovy slightly trails it at 7.4% — both owned by Novo. While Eli Lilly also makes a GLP, Novo is still the leader.
Strong guidance from management on sales — +16% - 24% — roughly implies revenue of $48bn for ‘25 and $57bn for ‘26…that’s a compounder.
America and much of the western world has an obesity problem. There is a clear incentive for governments to underwrite the drug because obesity has a clear social + fiscal cost on society — per UoA, the fiscal cost of obesity in NZ is at least $2bn¹.
People have an incentive to use Ozempic, because they are vain.
This is a nice hedge against the booze stocks I like so much. Benefit from both sides of the trade — buy booze at low teens multiples; buy Novo and benefit from lower drinking rates as there’s several studies that imply ‘Zempy reduces drinking.
I don’t want Ozempic, because I like to live the good life.
This does not mean the vast majority of people won’t use Ozempic. At the moment, one in eight Americans have used a GLP. That’s +334mn people. 40% of Americans are obsese.
There’s a Lollapalooza effect happening here — a bunch of incentives — vain people, governments wanting less obese people, the various side health benefits of GLPs, etc. I like when a lot of incentives are aligned because you’re relying on psychology rather than projecting numbers on an excel spreadsheet.
Novo has sold off recently due to a trial of its CagriSema drug missing expectations. Eyes on the prize, though — current GLPs, which still have plenty of market to saturate.
Eli Lilly has traded up in recent times, while Novo has traded down. The two tend to trade in lockstep so the disconnect is an opportunity to buy the world’s leading GLP maker at a good price.
Eli Lilly is the closest comp, but it trades at a 38x fwd multiple, while Novo trades at 20x — i.e. an almost 50% multiple discount (see chart). I like that too…
Note analyst recs on chart also…
This analysis is provided by Eden Bradfeld at BlackBull Research—sign up for their Substack to receive the latest market insights straight to your inbox.

GMED breaking out for another bullish move!Globus Medical, Inc. (GMED), a leader in musculoskeletal solutions, is currently exhibiting strong bullish signals.
The stock has maintained a steady uptrend, forming higher highs and lows on weekly charts.
Trading above its 50-day and 200-day EMAs, GMED recently witnessed a golden cross, further solidifying its bullish momentum.
Key support levels is identified at $80. Volume trends support the uptrend, with higher activity during rallies and lower volumes on pullbacks, indicating weak selling pressure.
Momentum indicators like the RSI at 62 shows hidden divergence.
A recent bullish engulfing candle on the daily chart and a breakout from flag & pole confirm upward momentum. Traders can look for this breakout for continued gains.
Overall, GMED shows promising potential for further upside in the medium term.
The stock can easily go till 108-110 with a stop loss of 80 which is risk reward of 1:3X.

Phathom Pharmaceuticals ($PHAT ): High-Growth Potential I spend time researching and finding the best entries and setups, so make sure to boost and follow for more.
Phathom Pharmaceuticals ( NASDAQ:PHAT ): High-Growth Potential in Biopharmaceuticals
Trade Setup:
- Entry Price: $7.53 (Activated)
- Stop-Loss: $5.67
- Take-Profit Targets:
- TP1: $22.00
- TP2: $41.80
Company Overview:
Phathom Pharmaceuticals ( NASDAQ:PHAT ) is a biopharmaceutical company focused on developing and commercializing novel treatments for gastrointestinal diseases. With a pipeline of promising drugs, NASDAQ:PHAT is gaining attention as a high-potential player in its sector.
Recent FDA approvals and upcoming clinical trial data releases have positioned the company for significant upside. These developments could catalyze rapid stock price appreciation in the coming months.
Earnings Reports:
- In its most recent quarter, NASDAQ:PHAT reported revenues of $12.3 million, driven by early sales from its newly approved drug for acid-related conditions.
- Operating losses narrowed compared to previous quarters, reflecting disciplined cost management.
Valuation Metrics:
- Market Cap: $500 million, indicating a small-cap stock with room for growth.
- Price-to-Sales (P/S) Ratio: 4.1, suggesting moderate undervaluation compared to industry averages.
Market News:
- Phathom recently announced successful Phase III trial results for another key drug in its pipeline, expected to drive future revenue growth.
- The company is expanding its distribution partnerships, aiming to broaden its market reach.
Technical Analysis (Daily Timeframe):
- Current Price: $7.53
- Moving Averages:
- 50-Day SMA: $6.80
- 200-Day SMA: $7.00
- Relative Strength Index (RSI): Currently at 55, signalling neutral momentum with room for further upside.
- Support and Resistance Levels:
- Immediate Support: $7.00
- Resistance: $9.00
The stock has activated the entry at $7.53, with strong support at $7.00. A breakout above $9.00 could set the stage for rapid movement toward TP1 at $22.00 and TP2 at $41.80.
Risk Management:
The stop-loss at $5.67 limits downside risk to approximately 25%, while the first take-profit target at $22.00 offers a **192% gain**, and TP2 provides a massive **455% return**, making this an attractive trade for long-term investors.
Key Takeaways:
- NASDAQ:PHAT is a high-risk, high-reward opportunity in the biotech sector, driven by a strong pipeline and recent FDA approvals.
- The trade setup offers an excellent risk-to-reward ratio, aligning with the stock’s growth potential.
- Ideal for investors seeking exposure to a rapidly developing biopharmaceutical company.
When the Market’s Call, We Stand Tall. Bull or Bear, We’ll Brave It All!

Stock Analysis Report: Aurobindo Pharma Ltd.Overview:
The chart presents a technical analysis of Aurobindo Pharma Ltd. on a daily timeframe. The stock shows a recovery pattern with a visible RSI divergence, indicating a potential bullish reversal.
Key Observations:
1.RSI Divergence:
A bullish divergence is identified as the price made lower lows while the RSI formed higher lows, signaling waning bearish momentum and the likelihood of an upward move.
2.Critical Support Levels:
Immediate support is marked at ₹1,273.35, corresponding to the 200-day moving average.
A strong base exists at ₹1,199.40 and ₹1,101.55, which acted as previous demand zones.
3.Potential Resistance Zones:
Initial resistance levels are observed at ₹1,310.80 and ₹1,346.60.
Major resistance is seen at ₹1,403.25 and ₹1,450.35, where the stock could face selling pressure.
4.Buying Strategy:
Enter long positions only if the price stabilizes above ₹1,273.35, confirming support.
Watch for a breakout above ₹1,310.80 for momentum trades targeting higher resistance levels.
5.Volume Analysis:
Increased volume on recent upward moves supports the bullish sentiment.
Monitor volume patterns for confirmation of breakouts or trend reversals.
Conclusion:
Aurobindo Pharma shows signs of a potential bullish reversal. Traders should closely observe the ₹1,273.35 support level and enter only upon confirmation. Targets are placed at ₹1,310.80, ₹1,346.60, and beyond. Implement proper risk management to account for potential volatility.

Alkem Laboratories Ltd. (NSE: ALKEM)Technical Analysis and Key Levels
1.Current Price Action:
Alkem Laboratories is trading at ₹5,484.40, testing a critical support zone (₹5,300–₹5,450) identified by historical price action and volume profile.
2.Resistance and Support Levels:
Immediate Resistance: ₹5,811.55 (previous swing high).
Key Resistance Zone: ₹6,000–₹6,346.55. A breakout above ₹6,346.55 can lead to fresh bullish momentum.
Immediate Support: ₹5,323.60 (near-term support).
Critical Support: ₹4,629.85, a major demand zone. Failure to hold this level could trigger further downside.
3.Volume Profile:
High-Volume Node (HVN): Significant buying interest is observed around ₹5,450–₹5,800.
Low-Volume Node (LVN): Below ₹5,300, liquidity decreases, increasing the risk of a sharp drop toward ₹4,629.85.
4.Moving Averages:
The stock is currently hovering around the 50-day moving average, indicating short-term indecision.
The 200-day moving average at ₹5,323.60 acts as crucial support for long-term trend analysis.
5.RSI Indicator:
The RSI is neutral but leaning towards the oversold region, suggesting potential accumulation in this zone. A break below ₹5,323 could push RSI into bearish territory.
6.Key Observations:
Nomura's Price Target Update: Nomura revised the price target to ₹6,097 (Neutral stance), close to the immediate resistance levels, which aligns with market consolidation.
7.Potential Scenarios:
Bullish Case: Sustaining above ₹5,484.40 and breaking ₹5,811.55 may open doors for ₹6,346.55.
Bearish Case: A decisive break below ₹5,323.60 could lead to ₹4,629.85.
8.Trading Strategy:
For Bulls: Look for confirmation above ₹5,811.55 with increased volumes before entering long positions.
For Bears: Short opportunities arise if the stock breaks and sustains below ₹5,323.60 with a target near ₹4,629.85.

APOLLOHOSPITAL 240 MINS TIME FRAME - MY VIEW ONLYThe Structure looks good to us, waiting for this instrument to correct and then give us these opportunities as shown on this instrument (Price Chart).
Note: Its my view only and its for educational purpose only. Only who has got knowledge about this strategy, will understand what to be done on this setup. its purely based on my technical analysis only (strategies). we don't focus on the short term moves, we look for only for Bullish or Bearish Impulsive moves on the setups after a good price action is formed as per the strategy. we never get into corrective moves. because it will test our patience and also it will be a bullish or a bearish trap. and try trade the big moves.
we do not get into bullish or bearish traps. We anticipate and get into only big bullish or bearish moves (Impulsive Moves). Just ride the Bullish or Bearish Impulsive Move. Learn & Know the Complete Market Cycle.
Buy Low and Sell High Concept. Buy at Cheaper Price and Sell at Expensive Price.
Please keep your comments useful & respectful.
Keep it simple, keep it Unique.
Thanks for your support
Tradelikemee Academy
Saanjayy KG


Globus Medical: Approaching resistance, is a breakthrough comingWeekly Chart
● The stock has tested the trendline resistance multiple times.
● Currently, it is trading just below this level.
● A breakout above this resistance is anticipated in the near future.
● Following the breakout, the price may increase.
Daily Chart
● A Symmetrical Triangle pattern has formed.
● A strong breakout has taken place, supported by significant volume.
● The price is now set for a potential upward movement.
