TTD - Swing up opportunityTTD had a strong dip of nearly 18% over the last 4 days, retracing 62% of the recent swing up and looks to be finding support as it closed with a pin bar candle. The odds that it is done pulling back is high now that we are also seeing a potential bullish divergence between price and RSI.
Long if it is able to rise above the hi of this pin bar (@ 840.30) with initial stop loss slightly below the pin bar low @ 796.
Looking to scale out partially at least as it approaches the last high at 972 and protect the rest of the position with trailing stops
Disclaimer: This is just my own analysis and opinion for discussion and is not a trade advice. Kindly do your own due diligence and trade according to your own risk tolerance. Thank you. Feel free to give me your thoughts ! :)
Pin Bar


GOLD US SESSION 15M SCALPRules for Bullish/Bearish Reversal
1 - Pin Bar - Hammer
2 - Stop Hunt Wick
3 - Low Bear Engulfment
#3 Lowest Bear Candle
Break High for Reversal
Break Low for Continuation
#3 Highest Bull Candle
Break High for Continuation
Break Low for Reversal


Long EURGBPRecently EURGBP ranged in H4 rectangle pattern and falls to below of this and makes a bullish pinbar candle.we can expect some upside movement from this area!

LTCUSD Trade Opportunity (Cryptocurrency)Next entry is at 109.77 for a Buy. Wait for the candle to close above 109.77. Next watch for a buy signal at 109.77. Watch for a bullish pin bar. Or a bullish engulfing bar. Enter at a "higher low."

CADCHFDaily pin bar On the bottom of the channel and demand zone as well.
I am expecting the market eventually to go up where the target is shown.
Thanks for taking the time and reading my chart.

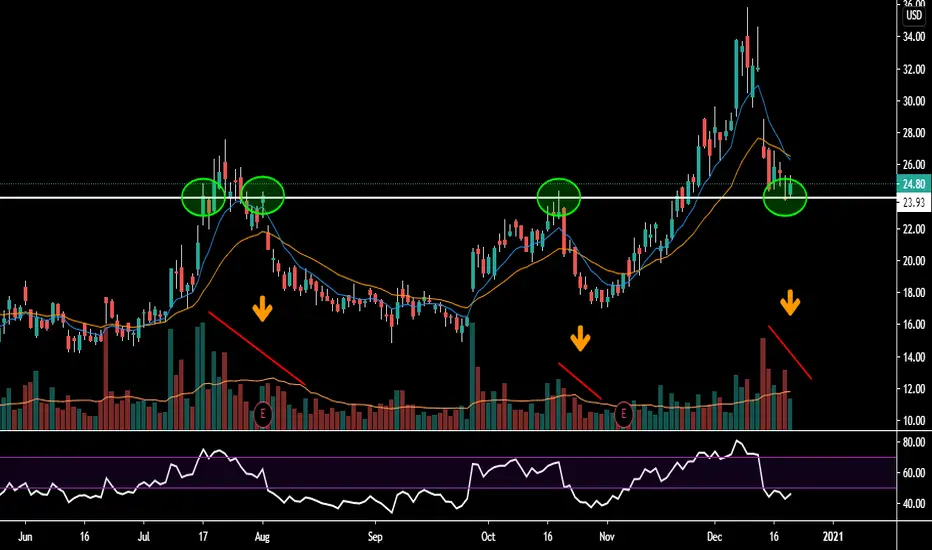
SPCE Possible ReversalSPCE showing signs of a possible reversal. Gathering/consolidating support along a previous significant resistance level. Volume has typically tapered lower during downtrend which we currently see. High risk play entering right now, I'd like to see more confirmation first before entering (RSI divergence along lows or break of pinbar printed on 11/30.
Heavy eyes on the 1/15/21 $25c and $30c. Volume seems to be focused there.
Leave a comment to discuss!!!

AU Shorts next upSeeing bearish timeframe confluence from the weekly down to the 4H. Bearing pinbar forming around the .75611 resistance zone.

LONG BTC (+4R trade)Long BTC at market or just buy first possible dip.
Price bounced
on 6h demand zone
hitting also a 6h Fair Value Gap
hitting 0.5 - 0.618 fibonacci golden zone
creating a pinbar (hammer) on 6h
Apply risk management

NZDUSD, 4hr tf, sell ascending trendline breakHello my friends,
Before i start with today trade ideas, let's review some of the trade i took yesterday.
There were 2 trade ideas i shared which are GBPAUD and GBPCAD sell positions.
Both trades now closed with a nice profits.
First trade is GBPAUD which i closed manually for +210 pips and banked 3.5R yielding 7% profit
Second trade is GBPCAD which i closed manually as well for +220 pips and banked 3.6R yielding 7.2% profit
For today i am going to sell NZDUSD because i think this pair could have some retracement retesting 0.6940 area.
The reason why is because price already broken below the ascending trendline and stopped making higher high.
This recent movement could be a lower high and might be followed by a lower low.
If you see the last daily candle close, it is also very clear that it was a bearish pinbar so we could see sellers step in to push price down.
Sell NZDUSD 0.7065
Stop loss 0.7105
Take profit 0.6945 (3R)
RR Ratio 1 : 3
Use only 1-2% risk
Good luck

GBP/USD - Expected to move downYo traders,
This trade looks good to move down.
Based on my previous analysis for US index which shows a bullish forecast, GU seems to be in line with the same and looking to move down.
Price has reached the weekly resistance and has shown rejection (pin bar candle at resistance on daily). In the past we have seen the same rejection at this level.
Lets wait for the trend to break before it moves down
Thanks
Madtradex

GBPAUD, daily tf, sell the bearish pinbar candleHello my friends,
I found something interesting with GBPAUD pairs.
As you can see, friday candle close was very interesting.
After shooting up for 150 during Asia and European session , it closed significantly lower erasing all the gain during American session.
The result of Friday movement is the daily candle became a bearish pinbar candle.
I would say this mean sellers really step up and controlling this pair right now.
We will aim to sell this pair for next week.
For this trade setup we will wait for some retracement before entering sell.
The best area to sell will be around 1.8175 because there is a horizontal resistance level here.
Sell GBPAUD 1.8175
Stop loss 1.8225
Take profit 1.7875 (6R)
RR ratio 1 : 6
Use only 1-2% risk
Good luck

Going Short on EURUSDRunning Trade...
Do your own analysis ...
Dont Forget Moving Stop-loss At Break-even
Disclaimer!
This post does not provide financial advice. It is for educational purposes only! You can use the information from the post to make your own trading plan for the market. You must do your own research and use it as the priority. Trading is risky, and it is not suitable for everyone. Only you can be responsible for your trading.

ETH - Looking at the Recent Drop and ReversalI look at ETH from a few different timeframes (1D to 1W), analyze the drop and reversal that occurred this past week and then look at the big picture.

AAVE - Taking a Look at the Weekly and Daily Candlestick ChartsI take a look at the weekly and daily charts in AAVEUSD and point out a few bullish candlestick setups that have formed over the past few weeks.

GBPUSD Long Positions Entries: 1.32671 1.33123 1.33980GBPUSD Long Positions Entries: 1.32671 1.33123 1.33980

EURUSD, 4hr tf, double top / bearish flag in playHello my friends,
Today we are going to trade with EURUSD.
As you can see price has been moving up respecting the ascending trendline for 1 week.
Today price finally closed below it on a 4hr timeframe and it also looks like price making a small double top pattern.
This could be a bearish reversal pattern so we are going to try selling EURUSD now.
If you look at daily tf, you cold also see that previous daily candle close looks like a bearish pinbar or shooting star candle.
Based on DXY as well, there is a potential DXY making a double bottom so we will try selling EURUSD as this pairs are mirrorring DXY movement.
Sell EURUSD 1.1865
Stop loss 1.1905
Take profit 1.1705 (4R)
RR Ratio 1 : 4
Use only 1-2% risk
Good luck

Bearish continuation for GoldHey guys, an excellent bearish daily close Friday on gold and the daily closed well below the Daily Mid-BB with a shooting star confirmation candle for Thursday's pinbar.
We expect the bear to continue at least until the FED meeting on Wednesday and we remain aiming for 1926 with a possible extension to 1916.
Let's see from there as we expect one more angry bull to show itself from that level before we break 1900 towards 1820.

AUDUSD ShortPrice is in a large symmetrical triangle. At triangle resistance and daily resistance a pin bar has appeared.

DCRBTC strong buyin recent days DCRBTC has increased about 30%, one of the main reasons was definitely the hammer candle at the bottom of the downward trend. as you can see three white soldiers pattern has been shaped. this means we might see 10-25% increase in short period.

EURJPY, daily tf, double top pattern to materializeHello my friends,
I hope you all enjoy your weekend and have a great trading week during this US Election week.
I am gonna share some setup for you all but before i start, let's review the previous week performance.
First position is GBPJPY sell at 136.45 which hit my SL for -70 pips. I lost 2% from this trade
Second poisition is GBPAUD sell at 1.8300 which i closed at 1.8060 for +240 pips. I managed to banked 6% profit or 3R
Third position is GBPCAD sell at 1.7170 which i closed at 1.7000 for +170 pips. I banked 5.6% profit or 2.8R
I still got some positions floating through the weekend and please check my posts if you missed it.
Let's start with EURJPY analysis.
As you can see, it looks like EURJPY made a double top pattern and price already broken below the neckline.
This upwards movement looks like a retest to me and it could be a good sell/short opportunity.
Counting the measured objecive of this double top pattern, it shold be around 121.00
So we could try selling it for 190 pips drop.
Thursday candle looks like a bearish pinbar indicating sell pressure, and Friday candle looks like an inside bar of previous candle.
With this 2 candle forming exactly at resistance, i expect price to drop because sellers are in control for now.
Sell EURJPY 122.80
Stop loss 123.30
Take profit 121.15 (3.3R)
RR ratio 1 : 3.3
Use only 1-2% risk
Good luck
