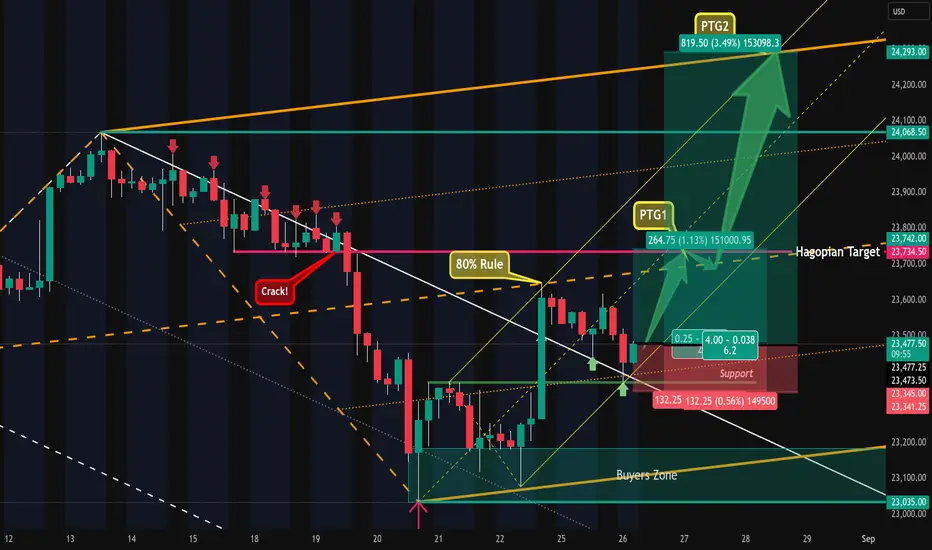
Nasdaq Short Is Playing Out - TGT 24'080First, Nasdaq has failed to make a new high.
Then price dropped, missing the red CL by just a couple of points. Is this really a miss?
Let’s play: *What if…*
The white fork measured how far price could pull back. As we Forkers know, there was about an 80% probability that price would retrace to the white Centerline - and indeed, the CL was reached.
Now it looks like price is turning on a dime.
Next target: the red Centerline around 24,080–24,000.
Here I’m sharing some deeper insights on the lower time frames:
Questions and comments are always appreciated.
Pitchforktrading

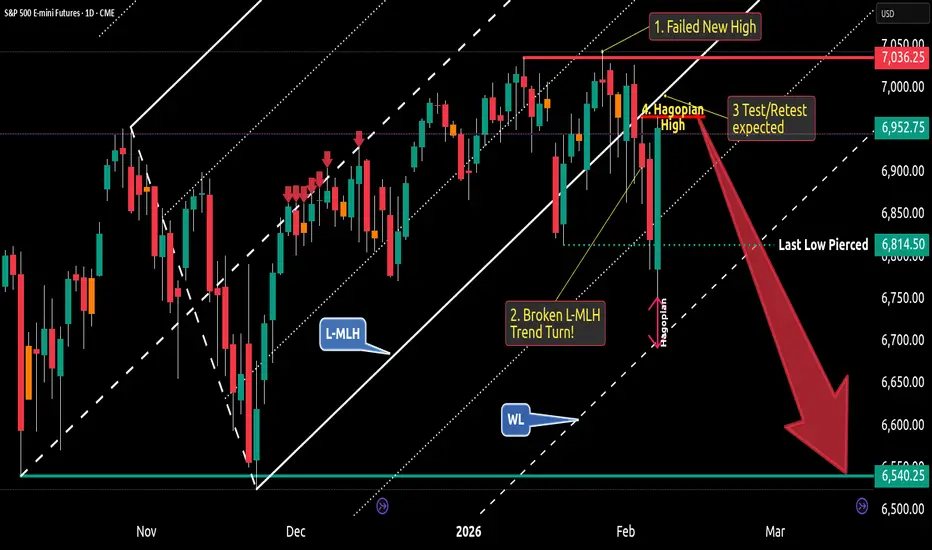
S&P500 Bearish Trend Turn - Here's My Short Trade🔱 As long as price follow the projection of a pitchfork, the trend is OK. But what we see here is a turn - and here's why:
1. The market failed to close above the last high. So, this is a failed new high - or a Double-Top
It is confirmed because the last low is pierced by the last Fridays bar.
2. Price opened & closed below the Lower-Medianline-Parallel = The projection of the fork, which shows the temporary trend, is clearly broken. And this means: Temporary Trend Turn.
3. What we see now with last Fridays bar is a expected Test/Retest of the L-MLH. It's also a slap in the face of early Bears.
4. And if you dig really deep, you also see the Hagopian against the Warning-Line (WL), which confirms the thesis of the Test/Retest of the L-MLH. Because Hagopian says, that price will go farther in the opposite direction than from where price came. In clear words: Price will go higher than the "Hagopian High". And to be precise, I expect the S&P500 to test the L-MLH.
So, week Short hands are completely clueless now. How can it be that price pulls back so hard...?
Thank God I'm trading with the pitchfork. They give me clear rules. And I never have to doubt, because there is zero subjectivity involved.
Can price go higher than the last high at 1. ?
Sure, everything is possible. But - It's not likely to happen, my Pitchfork rules say.
My trade?
I will observe price-action at the L-MLH.
As soon as the markets show it's hand by clear weakness, I'm loading my Boat to the Short side.
My exit? If a full bar is closing above the last high at 1.
There you have it.
👉 FYI: I'm NOT a signal service. I provide educational content. If you want to learn more about trading with the Pitchforks/Medianlines, I'm here for you to help. And of course you can always check out all my links where you find helpful, educational material.
I hope this helps and I wish you all a great and profitable new week.
Predicting Bitcoin Cycle Tops and Bottoms with Schiff PitchforksIntroduction: What is the Schiff Pitchfork ?
On Bitcoin's monthly timeframe, the pitchfork filters out noise and creates a stable rising channel where the median line and outer bands act as dynamic support and resistance. This framework helps identify where expansions and corrections tend to begin and end, making it exceptionally useful for spotting cycle tops and bottoms.
The 2017 Cycle: Pitchfork Accuracy in
The 2021 Cycle: Repeating Pattern Confirmation
The Top:
Bitcoin accelerated sharply into the cycle top near the upper boundary of the pitchfork
Price pierced above the channel then failed to hold, signaling an overheated phase
This marked the transition from expansion to bear market
The Bottom:
The corrective leg drove BTC down into the lower half of the pitchfork
The eventual cycle bottom formed close to the channel floor
The same structure that capped the bull market caught the bottom of the bear
Key Takeaway:
The 2021 cycle replicated the 2017 pattern, proving this isn't curve-fitted to one move
The tool works consistently across multiple cycles
The Current Cycle: What the Pitchfork Shows for 2025–2026
The Top Formation
Cycle top marked near the upper boundary of the pitchfork, exactly as predicted
The top aligns perfectly with the upper band trajectory, matching the 2017 and 2021 patterns
This confirms the pitchfork's predictive power across three consecutive cycles
Projected Bottom Level
Based on the current pitchfork geometry, the lower band projects to approximately $36,500–$49,000 range
This gives a clear risk/reward for the next major move
Important Note : While the pitchfork structure suggests a cycle bottom near $46,000 in late 2026, I still expect a relief rally for Bitcoin before we reach that level.

Are we close to a BTC bottom?check out the pitchforks...the previous ML of the pitchofork led to recovery..will it happen again? atleast a reaction for sure!

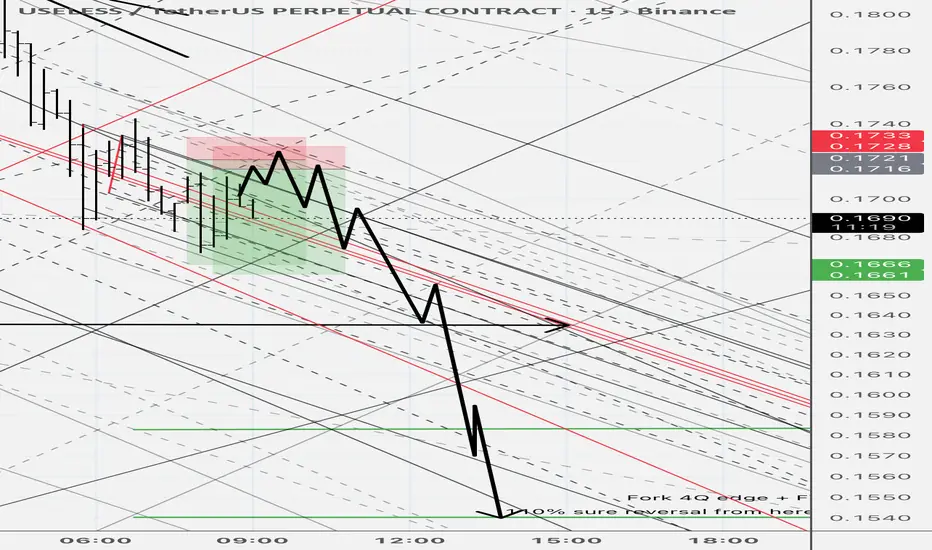
Short USELESS(actually useful!)Just a trading idea👇
Expecting a pullback through levels pointed on graph - probable price trajectory.
USELESS had a nice run, but it's actually just the BEGINNING!
Keep in mind - it's useless/has no usecase/no value.
Therefore a good, pure price-action instrument to test strategies on ;)
SOL — High Confluence Buy ZoneFrom 12th–14th August, SOL spiked into the 0.618/0.786 pitchfork resistance zone, where the best short entry presented itself. This rejection also marked the completion of wave 5 of the 5th Elliott Wave, confirming exhaustion in the $205–$210 zone.
After this sharp move, an imbalance has formed that typically gets retraced. When price spikes that quickly into resistance, it often gives the entire move back → meaning a return to the origin of the move. As price approaches this region, it becomes the prime zone for long re-entries.
🧩 Confluence Factors: 9
0.618 Retracement of the 5-wave impulse: $176.47
Daily level: $174.84
nPOC: $175.00
0.786 Trend-Based Fib Extension: $175.00
Anchored VWAP: ~$173.30
Sell-Side Liquidity (SSL): ~$173.50
Pitchfork 0.618 support: Aligning with this zone
Monthly Open (mOpen): $172.22 (major support)
0.786 Fib Speed Fan: Adding further structural support
🟢 Long Trade Setup
Entry Zone: $176.5 – $172
Best Entry: Around $175 (ideal ~ $173, confluence with liquidity + mOpen)
Stop-Loss: Below $167
Target: $219.21 (0.618 retracement of full move)
Potential Gain: +25%
R:R: 1:5+
Technical Insight
The 0.786 pitchfork rejection into wave 5 completion marked exhaustion at $205–$210.
Fast moves into resistance often retrace back to origin, opening the door for imbalances to be filled.
The $176.5–$172 zone clusters multiple technical supports, making it a high-probability long entry.
The mOpen at $172.22 and surrounding liquidity pocket stand out as the most ideal entry point.
With targets up to $219, the setup offers a strong +25% potential move with excellent risk-to-reward.
Key Levels to Watch
Support Zone: $176.5 – $172 (ideal entry ~$173)
Final Target: $219.21
🔍 Indicators used
DriftLine — Pivot Open Zones → For identifying key yearly/monthly/weekly/daily opens that act as major S/R reference points
➡️ Available for free. You can find it on my profile under “Scripts” and apply it directly to your charts for extra confluence when planning your trades.
_________________________________
💬 If you found this helpful, drop a like and comment!

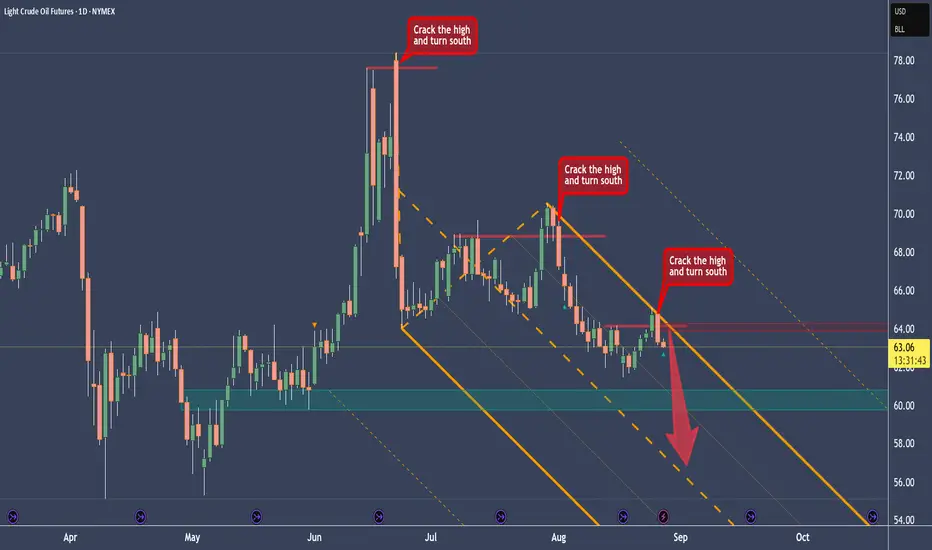
Crude Oil Short After Finding A Recurring BehaviorAfter I cleared the CL chart, I immediately saw a behavior that we can use for a setup right now.
You see that the highs got cracked, and then immediately price turns to the south. And since we are in a downtrend on Crude, we have a legit Short-Trade at hand.
With the modified Shiff-Fork you see how nice CL is reacting at the U-MLH, where it get's rejected. This level also coincides with the crack level.
I personally would love a pullback up to the crack-zone before shorting it. Maybe the trading Gods give us a gift on this Wednesday.
Talking about Wednesday: today we get the Crude Oil EIA numbers, which will probably move the markets.
However you plan is if you trade it, don't have FOMO. There are many more trades to come in your trading career.
Have a happy hump day §8-)
Nasdaq - Intraday Setup & Potential TradePrice was not abel to trade out of the white forks U-MLH and got constantly rejected.
It cracked the little support and fell down, but missed the white Centerline, creating a HAGOPIAN.
Then price traded outside of the white fork, following a textbook test/retest at the white U-MLH and found support.
The yellow fork points upwards, showing us the most probable path of price.
Going long near the white U-MLH gives us several potential targets:
1. the orange Centerline
2 the yellow Centerline
3. the HAGOPIAN target line.
4. the orange U-MLH
Stops would be below the last red bars low, because this, as of the time of writing, is the best structural level to hide behind.
I'm off to the mountains, have a happy trading day!
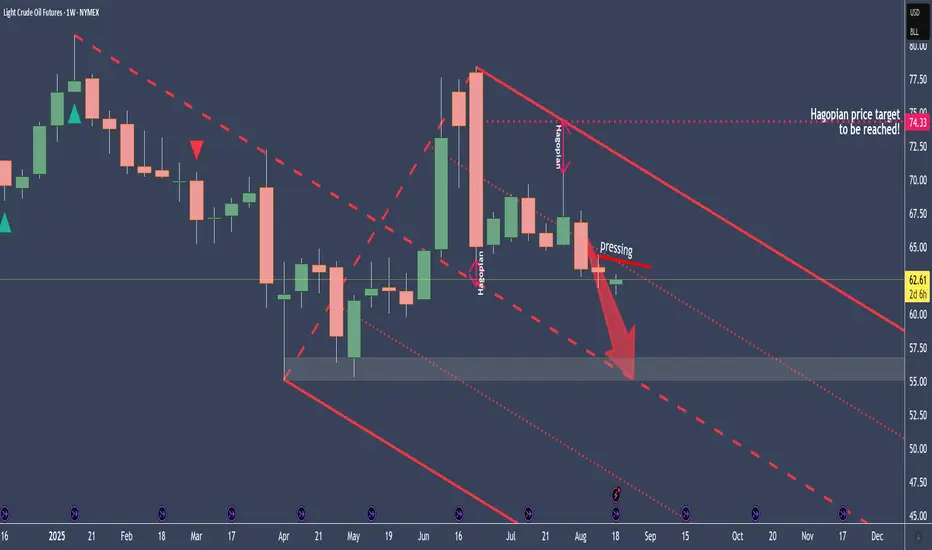
Crude Oil - Why I see it at $56 in the coming weeksCrude is trading below the centerline.
The pressing shows that the “election whales” don’t want higher prices at the moment.
Why?
No idea, and it doesn’t matter either.
All I’m interested in is where I can find a good entry to short crude. For example, a pullback to the pressure line, with a money management stop, or behind one of the weekly candles. It’s all a question of how much risk you’re allowed to take according to risk management.
Let’s see if we get an entry to join the sleigh ride down to the centerline.
NQ – Nasdaq follows the witch’s SPY prophecyNot only is the S&P 500 following the oracle in the SPY, but the Nasdaq has also given us a short signal. So, the scenario is the same as with SPY: short down to the Centerline.
For the indicator traders, I’ve also added the EMA(10) and EMA(20). Look at how well they’ve provided support so far. If the EMA(20) cracks, things will get hot. And if the CIB line (Change In Behavior) also breaks, then all hell breaks loose!
As already mentioned in the SPY post, it wouldn’t be a shame to take at least 50% of the profits you’ve accumulated so far. Because if it goes further up, e.g. above the U-MLH, you still have 50% left to benefit. If it goes down, we’ve already bagged 50%.
BTW: At the 1/4 line, we can usually expect support.
Exciting times, when maybe it’s better to sit still and keep your hands to yourself.
I’ll create the YT video with details tomorrow.
Happy profits to you all!

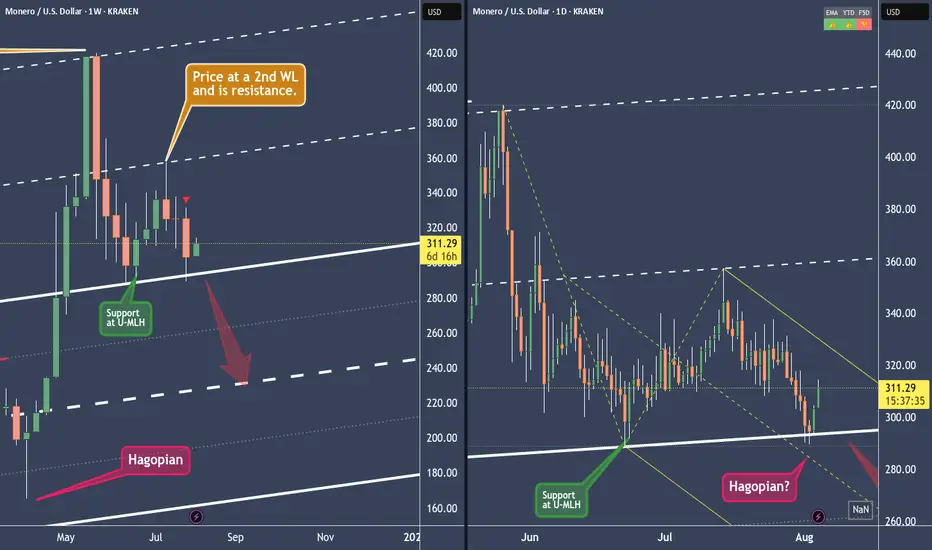
XMRUSD - Monero is strong. But strong enough?Can Monero break the U-MLH of the yellow Fork to stop the down-drift?
In the last post we see that Monero has the potential to reach the white Centerline at around $240. At least this is the view on the weekly Chart.
On the other hand we see support at the U-MLH in the daily Chart.
Until the U-MLH of the yellow Fork isn't breached by a open and close outside, the weekly short projection is in play.
DOGEUSD Has reached it's (first?) targetAfter reaching the Centerline, price eitheradvances to the Upper Extreme (U-MLH), or it reverses and it's target is the L-MLH, the lower Extreme of the Fork.
An Open & Close below the Centerline would indicate further progress to the downside.
A stop above the last high with a target around 2 would be the trade I would take.

ETHUSD - Ethereum can't crack the Warning lineWe can see ETHUSD nibbling at the WL.
This currently looks like a short-term pullback.
If Ether pulls back, we will at least see the U-MLH.
After that, the centerline would be the next target before further support can be expected.

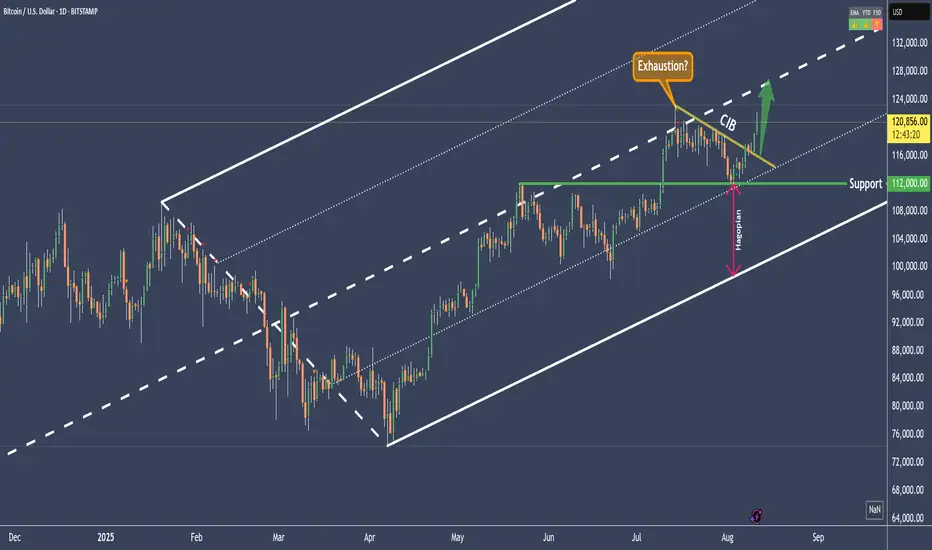
BTCUSD - Bitcoin potential at least 125'400Bitcoin is trading within the Pendulum Fork.
After the CL was reached, the price should have gone to the L-MLH.
However, this was not achieved, and instead a HAGOPIAN was left behind.
In most cases, this HAGOPIAN will drive the price higher than where it came from.
Since we know that in about 80% of all cases the market moves to the CL, we also have a good chance this time of reaching the high of at least 125,400. Personally, I see the target quite a bit higher, but let’s see what BTCUSD has in store for us.
Thanks for the likes peeps §8-)
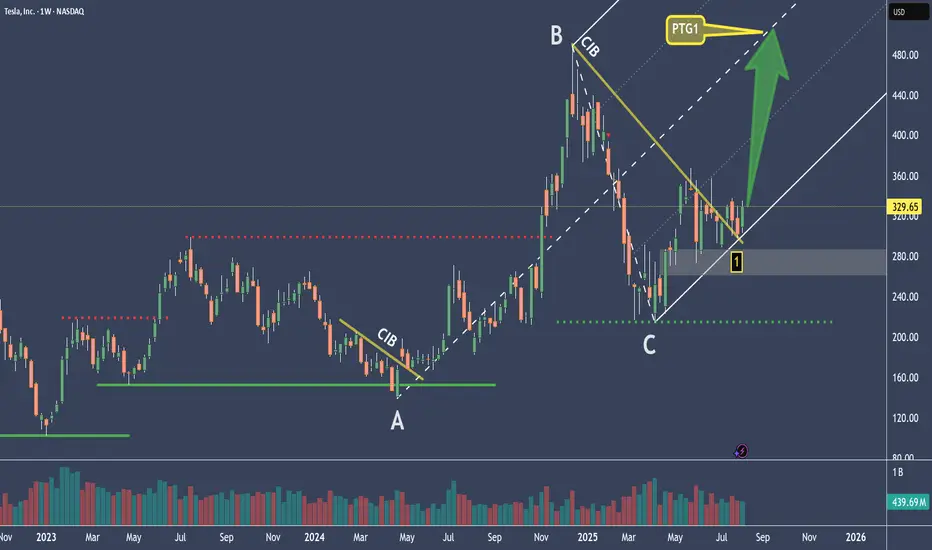
TESLA Is Counting Down The Clock – Moonshot?The red and green lines nicely illustrate what true support and resistance look like.
At the moment, it appears that the market has formed support again (1), but we can’t really confirm this since we don’t have a higher high that has been broken. So we can only assume that the base is at the C point.
We’ve been trading within the fork for several months now, which suggests that we’re once again in a longer-term upward movement.
If that’s the case, then we look for a nice profit target (PTG1) at the CL, because we know there’s over an 80% chance of reaching it.
An open and close outside the fork would be an exit signal, and could indicate a possible reversal to a short position.
I’ll explain further details in the YT video.
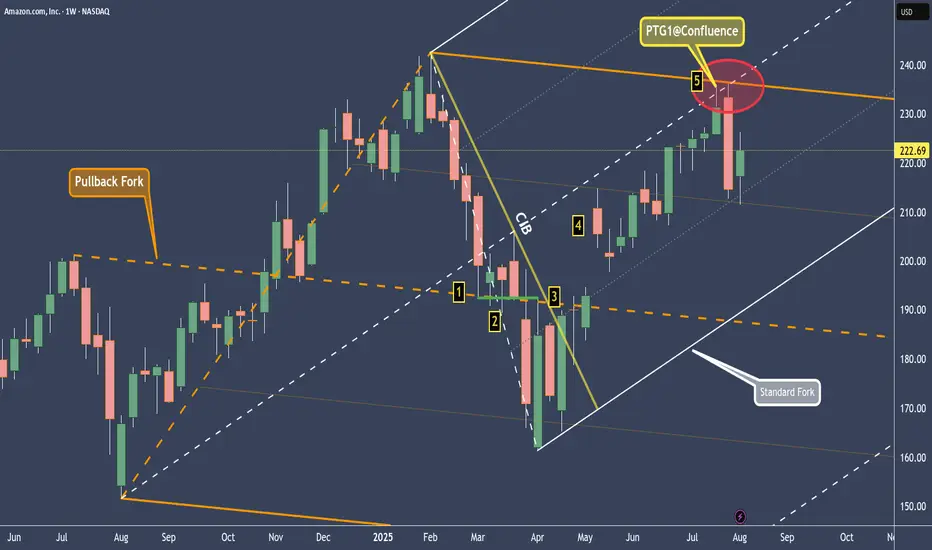
AMZN - Amazon Hit The 80% profit Target. Trend change ahead?On this chart we have 2 forks.
Orange: the pullback fork
It shows us where the equilibrium is — at the centerline, which the market respected to the tick (1).
After that, there were several bars that formed support (2).
When the CIB line was broken (3), the market gapped above the orange centerline and made its way up to the white centerline (5), the target that we can expect in around 80% of all cases.
Note the confluence point where the centerline of the white fork and the upper median line parallel (U-MLH) of the orange fork meet.
A day later, we saw a sharp sell-off within just one bar! Is this now another trend reversal?
No, clearly not.
For a trend reversal to occur, the market would have to break the white L-MLH (lower median line parallel). As long as the market is trading within the white fork, we remain long.
I’ll make a YT video soon, covering the details.
Wishing you all a successful new trading week.
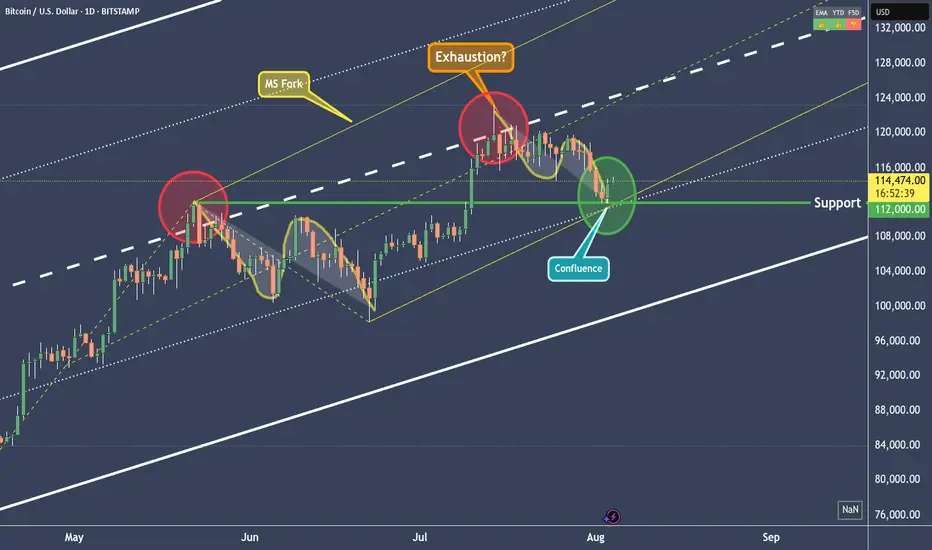
BTCUSD - Right to the point!In the last post (see the Linked Chart), I showed why BTCUSD would fall, and I also pointed out where the first price level for a possible pause might be.
On Friday, that level was reached, and the market seems to be turning *on the dot*. Will we now see higher prices again, or even a new all-time high? Let’s take a closer look:
The “confluence” point is marked by the white fork and the yellow modified Schiff fork. This point lies exactly on the 1/4 line. And this line often indicates temporary levels where at least a pause in the movement can be expected.
When we look at what Bitcoin did at this price level in mid-June, it seems likely that it will rise again. The overall pattern, from the centerline to the 1/4 line, looks extremely similar (see the A-B-C Wave Pattern)!
And yet, I’m not entirely convinced by the picture. Because this was the second time we reached the centerline.
For the brave, this wouldn’t be a bad entry point—or an opportunity to increase the position after this pullback. A possible stop for traders could be placed just below the current low, with targets at the centerline of course.
But why not just lean back, enjoy the profits, and switch into observation mode for now…
I will also make a video that explains the details and connections more clearly.
Happy Monday and stay patient to fight the FOMO! §8-)
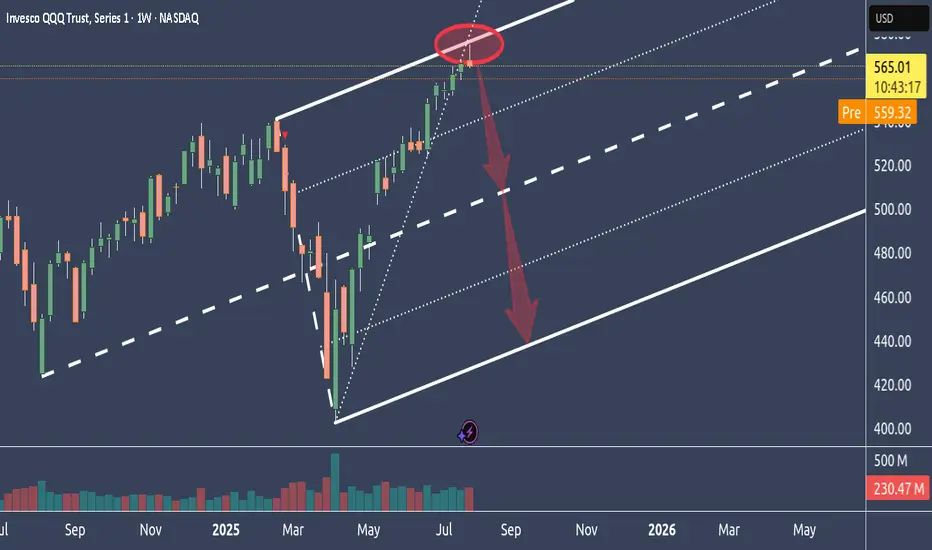
Why NQ is probably tanking big timeIn this weekly chart, we see QQQ, which represents the Nasdaq.
As we can see, it had a hell of a run up.
Too far too fast IMO, and it reached the stretch level at the Upper Medianline Parallel.
The natural move is now to let go, take a breath and trade down to center again, which is the Centerline.
After all the most major and most important earnings results are over, and Funds have pumped up their gains through manipulative Options plays, it's time to reap what they have planted and book the gains.
It's all in line with, all moves are at the point, and everything is showing in a simple chart.
Unless price is opening and closing outside of the U-MLH, it's time to load the Boat and sail to the South.
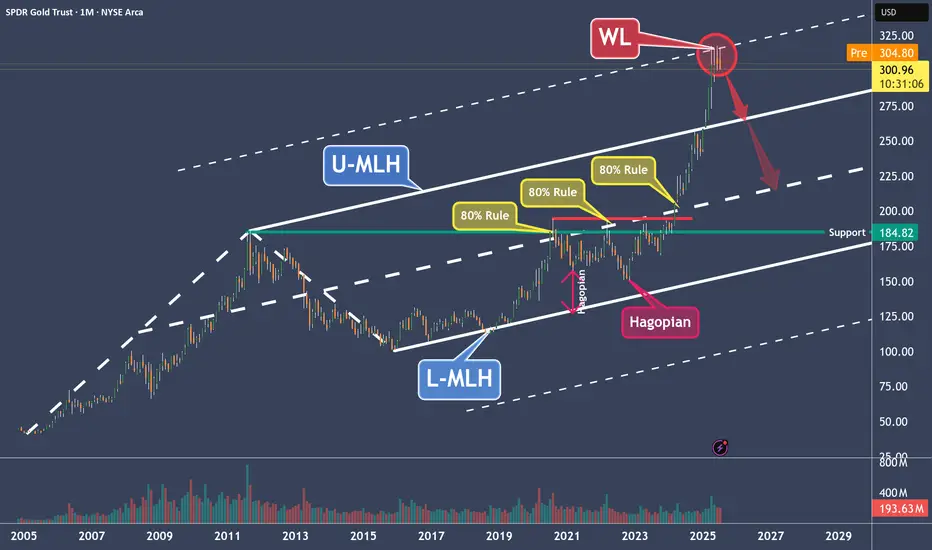
GLD – Why Gold Is a Clear Short to MePrice moved from the Lower Median Line (L-MLH) up to the Centerline, fulfilling the 80% rule.
Then we had two Hagopians, which sent price right back to the Centerline.
After the breakout above the Centerline, the next target was the Upper Median Line Parallel (U-MLH), which was reached rather quickly.
Finally, price broke above the U-MLH and was pulled up toward the Warning Line (WL).
Is this the end of the happy story?
I think so—because Gold has now reached its 2nd standard deviation, and there’s probably no more gas left in the tank.
The Trade:
- A logical target is the U-MLH.
- A secondary target is the Centerline.
At the very least, if you're long, this might be a good time to take some profits—because no tree grows to the moon.
For further details, I will follow-up with a Video explanation - See my Signature.
XRPUSD - Target reached. Reversal on the plateSo, that was a nice long trade.
Now price is stretched at the Upper Medianline Parallel (U-MLH).
As of the time of writing, I already see price pulling back into the Fork. A open and close within the Fork would indicate a potential push to the south.
Target would be the Centerline, as it is the level where natural Meanreversion is.
Observation Hat ON! §8-)

Fall Down to $70 ApproachingWith the RSI above average since mid-April 2025, the trend has been steadily rising up to $82 per share even breaking the highs from late February and March.
Price projected onto both (A and B) Inside pitchforks is well above the median line. In the pitchfork A the price is even directly touching the upper parallel line.
Reversal near the highest achieved price this year on 21st February is probable
Based on these indications, we can expect a fall to around $70 somewhere in the middle of May.
Key details:
RSI over "overbought" level
Price in both Inside pitchforks near the upper parallel line
Longer uptrend = breakdown necessary

Bitcoin / Euro Pitchfork experimental ideaDoes Bitcoin / Euro give a new perspective compared to the usual Bitcoin / USD chart?
I drew a Modified Schiff Pitchfork with anchor-points December 2018, November 2021 and November 2022.
It seems to respect the Fib levels and 0.25, 0.5, 0.75, 1.0 levels well. Let´s see how it plays out.

NQ - Nasdaq's potential to reboundThe Median or Centerline:
The Median (Centerline) Line is the central element of the Pitchfork and acts as the equilibrium point. Price tends to oscillate around this line, and it often serves as a strong reference for potential reversals or price targets. A price move back toward the Median Line is common after significant moves away from it.
Pitchfork (Red):
The red Pitchfork, drawn through significant price points, provides the overall trend direction and shows the potential path to the downside. The red line indicates a bearish bias in the current setup, as it has been guiding the price lower.
Green Circles and Arrows:
These represent key areas of support.
The lower green circle and green arrows indicate price has found solid support in this region. The price has been bouncing from this support level, showing that it is reacting to the [ower boundary of the Pitchfork. This behavior aligns with the rule that the price tends to respect these boundaries, creating a foundation for a potential move back toward the Median Line.
Price Action Analysis:
The price recently tested the lower green circle and green arrows, bouncing off this support level, which is a typical reaction in a Pitchfork setup.
According to the Median Line theory , when the price moves too far away from the Median Line, it often returns toward it. Therefore, the bounce off the lower boundary suggests that price may now be setting up for a bullish reversal toward the RED Median Line .
Bottom Line:
The price action is following the general Pitchfork playbook . The bounce from the lower green circle suggests that the price is setting up for a potential bullish reversal toward the RED Median Line .
The next major test will be the upper resistance in the red Pitchfork , after the break of the Centerline. If the price can break through this resistance, a strong move higher is likely.
Keep an eye on this critical point!
