PLATINUM winrate 87% close day above open priceBasic rules:
If we have a high probability of a BUY, this means that the asset will close above the current day's opening price by the end of the day.
If we have a high probability of a SELL, this means that the asset will close below the current day's opening price by the end of the day.
The probabilities for other assets are lower:
No Ticker TREND WIN %
1 AUDCAD BUY 53
2 AUDCHF SELL 53
3 AUDJPY BUY 53
4 AUDNZD SELL 60
5 AUDUSD SELL 53
6 CADCHF BUY 53
7 CADJPY SELL 53
8 CHFJPY SELL 60
9 EURAUD SELL 53
10 EURCAD BUY 67
11 EURCHF BUY 67
12 EURGBP BUY 80
13 EURJPY BUY 53
14 EURNZD BUY 53
15 EURRUB SELL 80
16 EURUSD SELL 53
17 GBPAUD SELL 67
18 GBPCAD SELL 80
19 GBPCHF SELL 67
20 GBPJPY SELL 53
21 GBPNZD SELL 60
22 GBPUSD SELL 73
23 NZDCAD SELL 60
24 NZDCHF BUY 60
25 NZDJPY SELL 53
26 NZDUSD SELL 53
27 USDCAD BUY 53
28 USDCHF SELL 53
29 USDJPY BUY 67
30 USDRUB SELL 73
31 XAGUSD BUY 53
32 XAUUSD BUY 60
33 NASDAQ100 BUY 67
34 S&P500 BUY 60
35 DOW30 BUY 67
36 RTSI BUY 80
37 AFLT BUY 87
38 BRENT BUY 60
39 BTCUSD FLAT 50
40 COPPER BUY 60
41 WTI BUY 53
42 DAX BUY 60
43 GAZP BUY 87
44 GMKN BUY 67
45 HEATINGOIL BUY 60
46 LKOH BUY 67
47 MTSS BUY 60
48 NATURALGAS SELL 73
49 NVTK BUY 73
50 PALLADIUM BUY 53
51 PLATINUM BUY 87
52 ROSN BUY 80
53 SBER BUY 80
54 COCOA BUY 60
55 COFFEE SELL 67
56 CORN BUY 60
57 SOYBEANS BUY 53
58 SUGAR BUY 67
59 WHEAT SELL 60
60 USD Index BUY 60
61 NIKKEI225 BUY 53
62 USDPLN SELL 60
Now, a news feed of analytical agencies' expectations and an analysis of individual indicators for today, along with what to expect during the main trading sessions. We'll also highlight the current strength or weakness of the US dollar. The direction of the pair itself will depend on the US dollar's underlying conditions.
NEWS today:
The US dollar is strong (watch for possible changes)
10:00 MSK - Expectations of partial weakening of the EUR
12:30 - Expectations of partial strengthening of the GBP
15:00 - Expectations of partial strengthening of the GBP
16:15 - Expectations of partial strengthening of the EUR
16:30 - Expectations of a weakening of the US dollar
Key events this week:
Friday: Canadian labor market data. US labor market data (non-farm payrolls).
I wish everyone profits and a great day!
Platinum

Fundamental Note: XAUUSD (Gold) 02 Feb 2026Gold is extending a sharp metals selloff that started late last week, with forced liquidations and margin-driven deleveraging still spilling over across precious metals. The trigger was a sudden repricing in US rates and the USD after Kevin Warsh was named as the next Fed Chair, which pushed markets to reassess the medium-term policy path and term-premium risks. The move then accelerated as CME margin requirements were raised for metal futures, amplifying margin calls and “sell-what-you-can” behavior. Geopolitics remains a key swing factor: any easing in major flashpoints can quickly drain the safe-haven premium, while renewed escalation can stabilize bids even in a risk-off liquidation tape. This week’s main macro catalyst is US Non-Farm Payrolls on Friday (06 Feb), which matters because it can either validate a cooling labor market (USD-negative, gold-supportive) or revive “higher-for-longer” pricing (USD-positive, gold-negative). Markets will be laser-focused not just on headline payrolls, but also unemployment and wage growth, plus any revisions that could change the narrative. In the very short term, gold is trading more like a leveraged positioning unwind than a pure macro hedge—so volatility remains elevated and rebounds can be sharp but fragile.
Bottom line: fundamentals are mixed, but price action is dominated by deleveraging and USD/yields until NFP resets expectations.
🟢 Bullish factors:
Any NFP downside surprise or softer wages → lower US yields / weaker USD support gold.
Geopolitical escalation risk can quickly restore safe-haven demand.
Oversold conditions after liquidation waves can trigger sharp short-covering rallies.
🔴 Bearish factors:
Ongoing margin-call deleveraging across metals keeps downside pressure active.
Firmer USD / higher real yields after Fed repricing is a direct headwind for gold.
Any geopolitical de-escalation removes part of the risk-premium that supported the prior rally.
🎯 Expected targets: Bearish-to-volatile while below 4,800–4,900, with near-term downside risk toward 4,600–4,500 if liquidation persists. If gold stabilizes and NFP comes in soft, a rebound toward 4,850–4,950 is likely; a clean recovery above 5,000 would signal the unwind is largely done and opens 5,200–5,350 again.

Commodities Don’t Move Together… They Take TurnsOne mistake I see a lot of traders make
they treat commodities like one big trade.
Gold, silver, oil, copper… same button, same mindset.
But commodities don’t move together.
They rotate.
Gold usually speaks first.
Not because growth is strong, but because confidence is changing. Liquidity shifts, risk perception shifts, and gold quietly reacts.
Silver comes next.
That’s when protection starts turning into opportunity. Volatility increases. Participation increases.
Then you see it in the industrial metals.
Copper, platinum, palladium. This is where demand stops being a theory and starts showing up on the chart.
Energy tends to move later.
By then, growth is obvious and inflation is no longer a surprise. Oil isn’t early. It’s confirmation.
Most traders wait for confirmation.
Few pay attention to the sequence.
The goal isn’t to predict the entire cycle.
It’s to recognize where we are inside it… and stop trading the wrong phase.
That alone filters out a lot of bad decisions.
⚠️ Disclaimer: This is not financial advice. Always do your own research and manage risk properly.
📚 Stick to your trading plan regarding entries, risk, and management.
Good luck! 🍀
All Strategies Are Good; If Managed Properly!
~Richard Nasr

Platinum catch up trade shows +33% upside.AI says:
1. The Great Supply Vanishing Act
South African Grid Collapse: Mining in the Bushveld Complex (75% of global reserves) is crippled by ongoing energy instability. Deep-level mines cannot operate without consistent power, creating a permanent floor under the price.
The Russian Deficit: Geopolitical friction and US tariffs (with dumping margins estimated at 828%) have effectively "locked out" a massive portion of global supply.
Depleted Buffers: Above-ground inventories that buffered the market for years have been eroded by three consecutive years of deep deficits.
2. The "Rich Man's Gold" Re-Rating
The Catch-Up Trade: Historically, platinum traded at a 1.2x premium to gold. With gold sitting at record highs near $4,400, a "normalization" of this ratio would put platinum well above $5,000.
Investment Surge: In 2025, Chinese investment demand for platinum grew by 47% as it shifted from an industrial metal to a "store of value" and hedge against currency devaluation.
3. The $4K Technical Trigger
The Breakout: Bank of America recently "panic-raised" its 2026 forecast to $2,450, a target that was almost immediately blown away by the current spot price of ~$2,658 - $2,900.
The Extension: Analysts are now eyeing the $3,400 - $4,000 zone as the next major Fibonacci extension if the current "volatility coil" breaks to the upside.

$PLG: The 'Waterberg' Giant is Waking Up!⛏️🇿🇦⛏️
Don't let the 'No Production' tag fool you. Institutional accumulation is hitting 5-year highs as #PLG increases its stake in the massive Waterberg Project.
The Play: We just cleared the 52-week high of $3.49. Volume is supporting the move.
The Catalyst: Funding news or a formal 'Concentrate Offtake' agreement could re-rate this from a $3 'penny' play to a $7+ institutional favorite.
Risk: It's high-beta and overbought on the RSI (77), so expect some volatility at the open.
Target: $3.87 (Next Resistance) -> $6.96 (Institutional Consensus).
#PLG #Mining #Platinum #Palladium #SouthAfrica #Waterberg #Breakout"
🐂 The Fundamental Bull Thesis
While AMEX:PLG isn't pulling metal out of the ground yet, the "smart money" is betting on the Waterberg Project being the most strategic PGM (Platinum Group Metals) asset of the decade.
World-Class Scale: Waterberg is projected to be one of the largest and lowest-cost underground PGM mines globally, targeting platinum, palladium, rhodium, and gold ("4E").
The "Implats" Opportunity: Major partner Impala Platinum (Implats) recently diluted its stake to 14.6% after pausing capital calls. AMEX:PLG stepped in to fund the gap, increasing its direct ownership and leverage to the project's success.
Stage Six Greenlight: The JV recently approved a Rand 92.1 million (~$5.1M) budget to keep pre-construction and infrastructure work moving through August 2026.
Saudi Refinery MOU: AMEX:PLG is exploring a game-changing MOU with Saudi Arabia for a potential smelter and refinery, which could bypass traditional South African processing bottlenecks.

#XPTUSD PLATINUM - Price Currently In Bullish Trend The overall structure is characterized by a series of higher highs and higher lows, moving within a well-defined ascending channel.
Major Breakout: Price has recently broken above a long-term psychological resistance zone at $2,500 (highlighted by the blue box and red arrows).
Support Flip: That $2,500 level, which previously capped price action, is now acting as support. The blue arrow indicates a successful "retest" where buyers stepped back in.
Trend Alignment: Both the inner (orange) and outer (purple) trendlines are sloping upward, confirming strong momentum.
Action: "Look for Longs." The chart suggests buying on dips toward the support zone.
Target: The primary upside objective is the $3,000 level (indicated by the red dashed line).
Confirmation: The recent bounce from the lower boundary of the inner orange channel suggests the bullish trend is accelerating.

Platinum vs. Silver at lowest in 46 yearsShort-term trend favors silver, but with the ratio that low, platinum becomes extremely interesting.

Everyone is staring at silver 🤯 Everyone is staring at silver. As if silver just woke up one morning and decided to go vertical.
Nope.
This isn’t just silver.
🥇 Gold
🥈 Silver
🥉 Platinum
All three started moving together back in May 2025 and in the first weeks of 2026, they didn’t trend. They snapped vertical.
Here’s the illusion that needs to die first ☠️
This is not calm long-term investing.
This is not pension money patiently buying for the next 20 years.
If it were, the charts wouldn’t look like they were drawn after three espressos and zero sleep ☕️📈
When an entire metals complex goes vertical at once, it’s rarely about “confidence.”
It’s about pressure 🔥
Positioning.
Crowding.
And someone stuck on the wrong side, watching exits disappear.
The daily and weekly candles look… beautiful. Almost too beautiful 👀
And that’s usually where risk hides, not where it disappears.
Moves like this don’t fade gently.
They end one of two ways ⬇️⬆️
Either a final blow-off where everyone suddenly believes this is the new normal…
Or a sharp deflation, where weeks of progress vanish in one or two sessions 💨
This isn’t bearish.
It’s not bullish.
It’s just how markets behave.
Metals aren’t meme stocks 🤡
They don’t need hype.
But when they start acting like meme stocks, something is being squeezed hard 🧨
So the real question isn’t:
“Where is silver tomorrow?” ❌
It’s:
What happens when this pressure releases? ⚠️
Because vertical charts aren’t gifts 🎁
They’re stress tests.
And markets reward those who know when not to fall in love with a chart ❤️🔥📉

Can XPT/USD Extend Its Uptrend After Multiple Pullback Tests?⚡ XPT/USD Platinum vs U.S. Dollar Bullish Breakout Blueprint 🎯 – Day & Swing Setups 🚀
🔥 Live Price Snapshot (XPT/USD):
Platinum Spot Price continues strong above ~$2,270 / oz & near multi-year highs — up sharply this year on persistent supply tightness and industrial demand strength.
📈 Trade Plan (Bullish Bias):
Setup: Confirmed bullish structure with price holding above rising trend support / major moving averages (triangle formation + multi-pullback retest yet to complete).
Bias: Bullish continuation if price maintains zone and re-tests support clusters — ideal for both day and swing traders.
Utilising Thief Layering Strategy: deploy multiple buy limit orders as price retraces into value zones (suggested layering):
🟢 Layers: 2200 → 2250 → 2300 → 2350 USD (extend further per personal risk preference)
📌 Your entries should be spaced strategically based on pullbacks to support/VA levels — this improves avg price and risk management.
🎯 Targets & Resistance:
Primary Target: 2650 USD / oz — key resistance cluster & overbought confluence zone (psychological zone + historical supply resistance).
Profit Taking: Scale partial profits as price approaches this zone — avoid holding full size into heavy resistance.
🛑 Stop Loss Guidance:
Core Stop: ~2100 USD
This protects the structure below key demand zone. Always customize based on preferred risk per share / asset exposure.
📌 Trader Notes:
Dear Thief OG’s — YOU decide your own profit exits & stop placements. My suggested zones are guides — your discipline manages real profits.
🔁 Correlated Pairs / Watchlist:
Track these alongside XPT for broader precious metals and USD strength insights:
XAU/USD (Gold) – often shows lead/confirmation moves in metals space.
XAG/USD (Silver) – sensitive to industrial demand shifts.
PALL/USD (Palladium) – cyclical pair with PGM demand overlap.
USD Index (DXY) – strong USD can dampen precious metal rallies.
Correlations help confirm trend strength or divergence setups.
📊 Fundamentals & Macro Drivers:
Bullish Macro Tailwinds for Platinum:
Supply Deficits Persist: Ongoing structural shortfalls due to concentrated mining supply issues & logistical constraints drive scarcity premium.
Industrial Demand: Automotive catalytic converters remain major demand drivers amid emissions regulation and industrial recovery trends.
Investment Flow: A shift to hard assets in uncertain markets supports precious metals — platinum gains outperforming peers.
Potential Headwinds / Risk Factors:
Analyst forecasts sometimes warn of robust drawdowns if supply/demand rebalances unexpectedly or if broader risk-off USD strength intensifies.
Geopolitical & mining-region risks can trigger sudden volatility.
📅 Key Economic Calendars to Watch (Market Impact):
U.S. CPI & PPI releases → influence real rates & precious metal valuations
Federal Reserve commentary / rate decisions → impacts USD direction & risk sentiment
Auto industry data (ISM, auto sales) → indirect drivers of platinum industrial demand
(Add precise London-time dates when available on your calendar)
💬 Trade Psychology / Notes:
Manage position sizing & layering risk systematically — avoid all-in at a single level.
Respect structural breaks — a clean break below major S/R invalidates bullish thesis.

Continuation of the platinum uptrend. #Platinum NYSE:PL ➖ Continuation of the platinum uptrend.
With a pretty wide stop loss around $2,173, you could try going long with the trend, targeting a potential +40% move up into the $3,300-$3,400 zone.
➖ The metals trend is still going strong, and right now platinum and aluminum look especially interesting for playing the upside.

PL: Platinum at an Inflection PointWhy Platinum Is Moving
Platinum is a unique metal that sits at the intersection of precious and industrial markets. Unlike gold, which is primarily viewed as a monetary or store of value asset, platinum derives a larger share of its demand from industrial uses. Silver sits between the two, with meaningful industrial demand alongside its role as a monetary metal. These include catalytic converters, chemical processing, hydrogen related technologies, and jewelry. Because of this dual role, platinum tends to be more sensitive to shifts in global growth expectations than gold, while still reacting to macro forces such as inflation, real rates, and currency trends.
From a correlation standpoint, platinum often trades in sympathy with gold and silver during periods of broad commodity strength, but the relationship is not constant. Gold typically leads during risk off environments, while platinum performs best when growth expectations improve and industrial demand increases. In recent months, platinum has begun to decouple from gold, showing relative strength as investors price in tighter physical supply and improving demand narratives. Silver has also participated in this move, but platinum’s advance has been more structurally driven rather than purely momentum based.
Recent sentiment has shifted materially since December 2025. After spending years trapped in a large consolidation range, platinum finally attracted sustained institutional interest. Supply constraints from major producing regions, rising costs of extraction, and renewed interest in platinum as a substitute metal in industrial applications have all contributed to the move higher. The breakout since December 2025 reflects a repricing of long term value rather than a short term speculative spike, which helps explain the persistence of the trend despite periods of volatility.
What the Market has done
• The market has been on a bullish uptrend since markets broke out of a multi year consolidation and accumulation range that lasted from December 2021 to June 2025.
• Markets formed two clear accumulation ranges during the advance, suggesting strong two way trade before higher prices were accepted.
• At the start of December 2025, market compressed against daily level 1, forming bid block 1 as buyers continued to absorb supply.
• Buyers initiated higher from this compression and pushed price to new ATHs in the spot market.
• Sellers responded aggressively at the end of December 2025, resulting in a volatile two way whipsaw and expanded range.
• Over the past two weeks, market volatility has contracted and the overall range has narrowed as the market works to establish a new value area at higher prices.
What to expect in the coming week
Key reference levels remain 2500, which marks the CVAH, and 2330, defined by the 5 Jan wVAH and the 12 Jan wVAL. These levels frame the current auction and provide clarity for upcoming scenarios.
Neutral scenario
• Continued two way balanced rotation between 2500 and 2330 would suggest acceptance of higher prices.
• This behavior would indicate responsive participation from both buyers and sellers rather than initiative control.
• Value may continue to build above prior ranges, reinforcing the broader bullish structure without requiring immediate continuation.
Bearish scenario
• If buyers are unable to defend the 2330 area, the auction is likely to rotate lower in search of demand.
• A move toward 2136.9, which aligns with the 5 Jan wVPOC, would be the first downside repair target.
• Continued acceptance below that level could expose the 2069 area, where the CLVN remains untested.
Bullish scenario
• If the market is able to break and accept above 2500, buyers may regain initiative control.
• Acceptance above the CVAH would signal strength and continuation of price discovery.
• This scenario increases the probability of a move toward new ATHs, particularly if value begins to migrate higher.
Conclusion
Platinum’s breakout is occurring against a backdrop of tightening supply, improving industrial demand expectations, and a broader commodity bid as inflation and growth dynamics remain in focus. While the structural shift higher is notable, history offers an important reminder. The last time platinum entered a parabolic phase in 2008, the move was followed by a 67% drawdown that erased four years of gains in just four months. As price continues to build value at higher levels, respecting both macro drivers and auction behavior will be critical in navigating the weeks ahead.
If you found this analysis useful, feel free to give a boost, comment, or share your own levels and scenarios below.
Disclaimer: This is not financial advice. Analysis is for educational purposes only; trade your own plan and manage risk.
Acronyms:
C - Composite
w - Weekly
VAH - Value Area High
VAL - Value Area Low
VPOC - Volume Point of Control
LVN - Low Value Node
HVN - High Value Node
LVA - Low Value Area
SP - Single print

XAUUSD: closing the gap🛠 Technical Analysis: On the H4 chart, Gold (XAUUSD) printed a sharp impulse and a visible gap, and price is now hovering around the gap area near 4,660—a zone that often invites mean-reversion. While the broader structure still shows a prior bullish trend, the current setup favors a corrective sell if the gap area is rejected and momentum rolls over. The first bearish confirmation would be weakness back below the local pivot and a slide toward the SMA50 region, with the main objective at the next major support. The projected downside target is the marked support at 4,352.
———————————————
❗️ Trade Parameters (SELL)
———————————————
➡️ Entry Point: Sell near the gap area (approx. 4,600 – 4,640)
🎯 Take Profit: 4,352.24
🔴 Stop Loss: 4,778.56
⚠️ Disclaimer: This is a potential trade idea based on current analysis; market conditions and price direction are subject to change based on news factors and volatility.

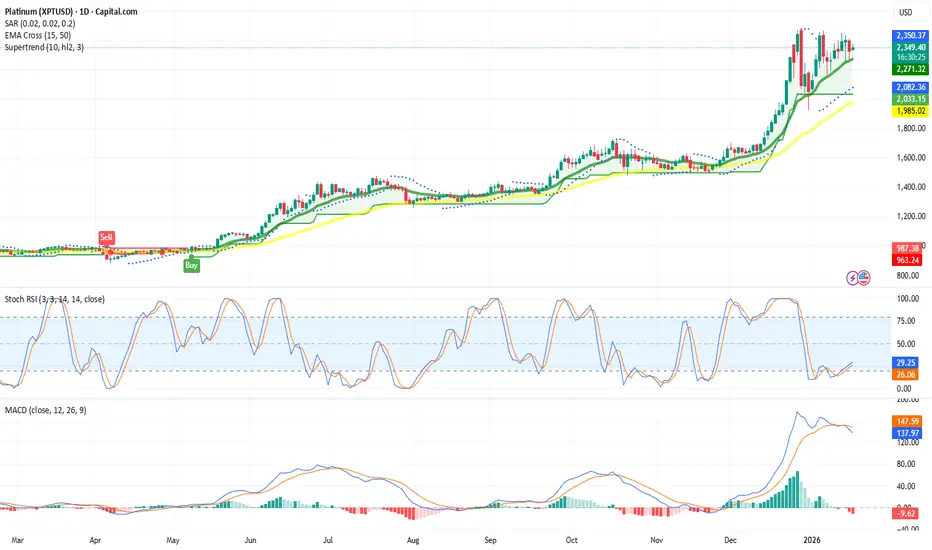
Platinum short term bullish 260119Platinum (XPT) going strong on the daily chart.
Short term indicators:
Par SAR: buy
EMA cross: buy
Supertrend: buy
Stoch RSI: buy
MACD: sell
Short term support at $2,002
Fundamentals are strong.
Long term (weekly, monthly charts) are also bullish.
Just like silver and gold:
Is the Metals Market Signaling a New Platinum Upswing?🏆 PLATINUM VS U.S. DOLLAR 📊 Metals Market Swing Trade Blueprint
━━━━━━━━━━━━━━━━━━━━━━━━━━━━━━━━━━━━━━━
📈 BULLISH SWING TRADE SETUP ⚡
Asset: XPT/USD (Platinum Futures)
Timeframe: Swing Trade (4H-Daily)
Strategy: Breakout Reversal
Risk/Reward Ratio: 1:2.85 ✓
━━━━━━━━━━━━━━━━━━━━━━━━━━━━━━━━━━━━━━━
🎯 TRADE SETUP PARAMETERS
💰 ENTRY ZONE
Primary Level: @1,620 (Post-Resistance Breakout Confirmation)
Trigger: Clear breakout above key resistance
Strategy Note: Enter ANY price level AFTER confirmed breakout candle closes above 1,620
🛑 STOP LOSS
Hard SL: @1,530 (Risk Buffer: $90 per contract)
⚠️ CRITICAL: Place SL ONLY AFTER breakout confirmation
📌 This is YOUR risk management choice - adjust per your position sizing & strategy
🎪 TARGET LEVELS
Primary TP: @1,720 (Resistance Trap + Overbought Zone)
Profit Taking: Strong resistance cluster + momentum divergence
📌 Exit strategy is YOUR choice - capture profits when conditions align
━━━━━━━━━━━━━━━━━━━━━━━━━━━━━━━━━━━━━━━
🔗 RELATED PAIRS TO MONITOR 📊
1️⃣ GC/USD (GOLD vs USD) 🥇
Correlation: POSITIVE (0.85+) - Precious metals move together
Key Point: If gold breaks above 2,050, XPT bullish bias strengthens
Watch: USD weakness = simultaneous gold/platinum rallies
2️⃣ SI/USD (SILVER vs USD) 🔶
Correlation: POSITIVE (0.78+) - Precious metals complex
Key Point: Silver acts as leading indicator; watch for breakout first
Watch: Industrial demand driver for platinum alternatives
3️⃣ DXY (US DOLLAR INDEX) 💵
Correlation: NEGATIVE (-0.82) - Inverse relationship
Key Point: Weaker dollar = stronger commodity prices
Watch: If DXY drops below 104.50, XPT uptrend likely accelerates
4️⃣ PALLADIUM/USD (PA/USD) 🔹
Correlation: POSITIVE (0.72+) - Autocatalyst/industrial metals
Key Point: Similar industrial demand patterns
Watch: Pd strength validates industrial commodity rally
5️⃣ CRB INDEX (Commodity Index) 📉
Correlation: POSITIVE (0.68+) - Broad commodity sentiment
Key Point: General risk-on environment supports metals
Watch: If CRB breaks resistance, XPT momentum likely continues
━━━━━━━━━━━━━━━━━━━━━━━━━━━━━━━━━━━━━━━
📋 TRADE MANAGEMENT CHECKLIST
✅ Wait for CONFIRMED breakout candle above 1,620
✅ Risk only what you can afford to lose
✅ Monitor USD weakness as bullish catalyst
✅ Watch gold (GC) for correlation confirmation
✅ Set alerts at key resistance levels
✅ Take partial profits at 1,720 resistance
✅ Trail stop after 50+ pips profit
✅ Review position during FOMC/economic data
━━━━━━━━━━━━━━━━━━━━━━━━━━━━━━━━━━━━━━━
🎓 KEY TAKEAWAYS
→ Platinum bullish bias on breakout above 1,620
→ Multiple precious metals correlations support uptrend
→ USD weakness = primary tailwind
→ Gold confirmation = higher probability setup
→ Target 1,720 resistance with proper risk management
Trade Smart. Trade Safe. Trade Responsibly. 🎯

XPT stands at the cusp of a multi-year bull cycleXPT stands at the cusp of a multi-year bull cycle
We all saw what the shiny boomer rocks did in 2025. Gold and silver massively outperformed crypto, driven by inflation hedging, macro uncertainty and positioning resets.
Whether that exact dynamic repeats in 2026 is less clear. Gold is already up ~80% from the prev YTD levels, silver nearly 190%, so a lot of the easy upside has likely been pulled forward. But when you move down the beta curve of precious metals, one thing stands out clearly: platinum (XPT) still hasn’t broken out of its multi-decade accumulation range.
Price opened 2026 just below all-time highs, after spending years compressing beneath them. We're talking about almost two decades since the 2008 highs. From a technical perspective, this structure looks like classic long-term absorption resolving to the upside.
Fundamentally, the setup is equally compelling. Platinum sits at the intersection of a deepening structural supply-demand imbalance, accelerating industrial demand tied to clean energy and emissions technologies plus some supportive macro tailwinds. Short-term volatility from policy shifts or inventory adjustments could still produce pullbacks, including potential retests of yearly open or prior acceptance zones, but those would likely be corrective (absorped quickly) rather than trend-breaking.
The core driver is supply
The platinum market has now run persistent deficits for three consecutive years, with global demand exceeding supply by roughly 850k to 1M ounces annually. According to the World Platinum Investment Council (WPIC), these deficits are expected to persist or even widen into 2026, pushing above-ground inventories toward levels not seen since 2015.
This supply rigidity creates sustained upward pressure over time. Unlike gold, where central bank flows can absorb shocks, platinum’s industrial-heavy demand profile magnifies the impact of shortages. Deficits compound. Inventories drain. Price eventually responds.
If this regime plays out, XPT does not need speculative excess to reprice. Even a normalization toward prior ATHs from 2008 implies meaningful upside, with the potential for 50%+ appreciation, and more if deficits persist longer than expected.
This feels like the early innings of a structural breakout. Buckle tf UP.

XPTUSD (Platinum) — 1H Trade Plan | Multi-TF ConfluenceXPTUSD (Platinum) — 1H Trade Plan | Multi-TF Confluence
Multi-Timeframe Bias
• Daily: Strong bullish trend intact; price holding above 0.786 Fib → continuation structure
• 4H: Higher highs & higher lows; pullbacks respected Alligator support; no trend breakdown
• 1H (Execution): Bullish structure, higher lows, price accepted above key Fib & demand zone
➡️ Overall Bias: BULLISH CONTINUATION
⸻
Candle & Momentum Read
• 1H Candles: Bullish engulfing + strong continuation candles from demand
• RSI (1H): Holding above 50 (bullish regime)
• Divergence: ❌ No bearish divergence detected across H1 / H4
⸻
Key Levels
Resistance
• 2465–2485 (Daily high)
• 2500 (Psychological)
Support
• 2350–2340 (0.786 Fib + H1 structure)
• 2320–2300 (H4 demand zone)
⸻
🎯 Trade Plan (1H Execution)
🟢 Buy Setup – Trend Continuation
Entry (EP):
• Buy pullback 2350–2360
• OR buy H1 bullish confirmation above 2350 or aggressive entry at current level
Stop Loss (SL):
• Below 2320
• Conservative: 2290
Take Profits (TPs):
• TP1: 2415 if entering on pullback
• TP2: 2465–2485 from current level
• TP3 (Runner): 2500+
⸻
❌ Invalidation
• H1 close below 2320
• RSI breaks below 45
• Strong bearish engulfing with follow-through from resistance
⸻
✅ Checklist Scoring (Lecture Framework)
Daily Trend BULLISH
H4 Structure BULLISH
RSI Regime BULLISH
Candle Pattern BULLISH
Location (Fib + S/R) BULLISH
Divergence NIL
Score:
Bulls 5 / 6
Bears 0 / 6

XAUUSD: short-term opportunities🛠 Technical Analysis: On the H4 chart, Gold (XAUUSD) remains in a broader uptrend, but the latest swing shows a rejection from the rising resistance line, followed by a sharp pullback and consolidation. Price is now rotating back toward the key horizontal support zone around 4,350–4,365, where another test could trigger a bearish continuation move. The SMA50 and SMA100 are acting as dynamic “decision” levels, while the SMA200 aligns closely with the first downside objective. A confirmed breakdown below the 4,350 area opens the path toward 4,246.67, with the marked medium-term support area near 3,900 as an extended target.
———————————————
❗️ Trade Parameters (SELL)
———————————————
➡️ Entry Point: Sell on a confirmed breakdown 4,350–4,365 support zone (approx. 4,365.78)
🎯 Take Profit: 4,246.67 (the first target), medium-term extension toward the support area near 3,900
🔴 Stop Loss: 4,484.90
⚠️ Disclaimer: This is a potential trade idea based on current analysis; market conditions and price direction are subject to change based on news factors and volatility.

Commodity Supercycles Don’t Start Where Most People LookOne thing I have learned over the years:
🥇Gold is usually first. (already done)
Not because the economy is booming, but because something feels off. Wars... Inflation... you name it. Gold reacts before the story is clear.
🥈Then silver starts waking up. (happening)
That’s usually when attention shifts from protection to opportunity. Silver doesn’t just follow gold, it magnifies it. It is cheaper and more convenient especially for those who missed gold's move!
🥉After that, the industrial metals come into play.
Copper, palladium, platinum. This is where the cycle starts to feel real. Demand is no longer theoretical. Growth shows up on the charts. (this feels just like altcoin season in crypto lol)
🛢Oil and gas tend to move later.
Not last by accident. By then, expansion is obvious and inflation pressures are already building.
🔄Most traders get this backwards.
They chase what’s already moving instead of asking why it’s moving.
The edge isn’t guessing the top or bottom.
It’s understanding what stage the market is in and positioning accordingly.
Honest question...⁉️
Are you reacting to what already moved… or paying attention to what’s just starting?
⚠️ Disclaimer: This is not financial advice. Always do your own research and manage risk properly.
📚 Stick to your trading plan regarding entries, risk, and management.
Good luck! 🍀
All Strategies Are Good; If Managed Properly!
~Richard Nasr

XAUUSD: bullish exhaustion🛠 Technical Analysis: On the 4-hour (H4) timeframe, Gold (XAUUSD) has encountered significant selling pressure after testing the major psychological and technical resistance zone between 4,520 and 4,550. While the pair previously maintained a "Global bullish signal" throughout December, the current price action indicates a structural shift.
The price has decisively broken below the steep diagonal resistance line that guided the recent impulse move higher. Currently, Gold is trading at 4,370, struggling to hold above its immediate support level. Further price pressure on support will lead to a breakout, a scenario that should be expected after the New Year holidays.
———————————————
❗️ Trade Parameters (SELL)
———————————————
➡️ Entry Point: Sell on breakdown of current support (approx. 4,336.58)
🎯 Take Profit: 4224.40 (Support)
🔴 Stop Loss: 4,411.82
⚠️ Disclaimer: This is a potential trade idea based on current analysis; market conditions and price direction are subject to change based on news factors and volatility.

Investment Logic: Why Gold Leads This Market CycleInvestment Logic Explained: Metals as the Preferred Asset in This Cycle
The performance gap shown in the table is not accidental. It reflects a clear capital rotation driven by macroeconomic realities in 2025. While equities and Bitcoin struggled to generate real returns, precious metals led by gold emerged as the dominant beneficiaries of this cycle. This shift is rooted in monetary policy, geopolitical risk, and the market’s renewed focus on capital preservation rather than speculation.
Gold: The Core Beneficiary of the 2025 Macro Environment
Gold’s +67.3% appreciation this year is a direct response to persistent global uncertainty and a structural shift in monetary expectations. Central banks maintained a cautious stance as inflation remained sticky, while real yields compressed amid expectations of policy easing into 2026. In this environment, gold regained its role as the primary store of value offering protection against currency debasement, sovereign risk, and declining confidence in fiat systems.
Importantly, gold’s rise was not driven by hype or leverage. It was supported by sustained institutional demand, central bank accumulation, and a steady increase in long-term holdings. This is the hallmark of a healthy, macro driven trend rather than a speculative rally.
Silver and Platinum: Beta Plays on the Same Thesis
Silver and platinum significantly outperformed gold, but their gains should be viewed as extensions of the same macro logic. As confidence in hard assets strengthened, capital flowed into metals with tighter supply dynamics and industrial demand exposure. These moves typically follow gold’s lead in the later stages of a precious metals cycle amplifying returns but also volatility.
For professional traders, gold remains the anchor. Silver and platinum offer upside asymmetry, but gold defines the directional bias of the entire metals complex.
Why Equities and Bitcoin Lagged
The S&P’s modest +17.7% gain underscores a year dominated by valuation compression rather than expansion. Elevated rates, earnings uncertainty, and geopolitical risk limited upside. Bitcoin’s −9.3% decline further highlights the difference between speculative assets and defensive capital. As liquidity tightened and risk appetite normalized, capital favored assets with intrinsic value and macro credibility areas where gold excels and Bitcoin currently does not.
Professional Takeaway: This Is a Capital Preservation Cycle
This cycle is not about chasing exponential upside. It is about protecting purchasing power, managing risk, and aligning with macro flows. Gold sits at the center of this framework. Its performance reflects disciplined capital allocation by institutions, not retail enthusiasm. Until global monetary stability is restored and real yields turn decisively positive, gold is likely to remain a preferred asset.
For traders, the message is clear: follow structure, follow liquidity, and respect macro regimes. In 2025, gold was not just a trade it was the benchmark for intelligent capital positioning.

PPLT: macro-trend structure Price has reached the first key mid-term resistance zone at 230–278, where a new corrective and consolidation phase may begin to unfold.
The mid-term structure still allows for further upside in the coming weeks, as long as price holds above the 200–185 support area.
On a macro basis, the trend remains constructive, with higher resistance targets at 312–377 in the coming months, provided price stays above the 170 support.
Weekly chart:

Platinum’s Nuclear Breakout Is Loading | The Chart Doesn’t LiePlatinum (XPTUSD) — Long-Term Structural Analysis Integrating Elliott Framework, Institutional Order Flow, and Macro Cycles
Platinum’s multi-decade price behavior continues to display a well-ordered impulsive structure consistent with classical Elliott Wave theory, supported by recurring institutional accumulation patterns and strict adherence to Fibonacci geometry. The asset has progressed through a full secular cycle, characterized by deep corrective retracements into high-probability value zones and expansions that consistently terminate at key Fibonacci extension thresholds—behavior typical of markets driven by institutional liquidity flows rather than retail speculation.
Elliott Structure & Fibonacci Alignment
The historical impulse demonstrates strong proportionality across waves.
The initial secular Wave 1 advanced precisely into the 1.618 extension , confirming a minimum impulse threshold.
Wave 2 retraced cleanly to the 0.618 retracement , an area frequently associated with long-horizon institutional repositioning.
The subsequent Wave 3 extended toward the 2.618 level , consistent with the most statistically probable long-cycle expansion target.
Wave 4 repeated the symmetrical 0.618 retracement , reflecting renewed accumulation in a structurally discounted region .
The current multi-year breakout sequence is consistent with an emerging Wave 5 , with a macro-projection aligning toward the 3.618 extension , a historically validated termination zone for commodities in late-cycle impulsive phases.
Macro Market Structure
Platinum has spent an extended period in re-accumulation following a prolonged distribution phase that began after the prior secular peak. Internal structure has now transitioned from compression to early expansion, evidenced by successive breaks of multi-year structural highs and sustained acceptance above formerly capped liquidity zones. This structural shift suggests the market is transitioning from long-term value consolidation into a new secular markup phase.
Institutional Order Flow & Smart Money Dynamics (ICT/SMC Framework)
Price behavior across multiple cycles reveals consistent liquidity targeting:
Corrective waves repeatedly returned to deep discount regions within the 0.618–0.786 “golden pocket,” an area historically associated with institutional accumulation and mitigation of long-horizon order blocks.
Liquidity sweeps above major multi-year highs followed by sustained displacement signal a structural shift in institutional intent.
Current price action demonstrates displacement from an extended accumulation base, confirming that the dominant flow is now upward, with liquidity pools above the historical consolidation range serving as primary targets.
Price Action Context
The market has decisively exited its multi-year equilibrium, printing higher-high/higher-low structures consistent with early-stage impulsive behavior. Breaks of internal liquidity layers reinforce the expectation of continued expansion toward higher-order liquidity pools, aligning with the projected Wave 5 trajectory.
Fundamental Alignment
Underlying fundamentals - including tight supply dynamics, structural deficits within the PGM basket, and tailwinds tied to hydrogen economy applications - reinforce the technical outlook. The confluence of cyclical tightening, inventory compression, and strategic industrial demand supports a durable long-term appreciation phase.
What do YOU think happens next?
Breakout or fake-out? Drop your prediction below!
👇 We are replying to every comment - let’s talk charts .
Smash the 👍 if this helped, hit 🔔 to catch the next setup,
and FOLLOW for more high-probability wave + SMC plays.
⚠️ Disclaimer
This content is for educational and informational purposes only and does not constitute financial, investment, or trading advice. All analyses reflect personal opinions based on publicly available data and chart structures. Markets involve risk, and you should always perform your own research or consult a licensed financial professional before making any trading decisions. Past performance does not guarantee future results.
#Platinum #XPTUSD #CommodityTrading #Breakout #Wave5 #ElliottWave #SmartMoney #SMC #ICT #PriceAction #ParabolicMove #BullishSetup #MarketCycle #Fibonacci #Metals #Macro #TechnicalAnalysis #ChartAnalysis #TradingSignals #TraderCommunity #Investing

Why Are Precious Metals Rallying?All precious metals have performed exceptionally well, especially in 2025.
From this illustration, we can see that in 2025 alone, from their yearly troughs to their recent highs, gold rose by 73%, silver by 164%, and platinum by 172%.
In today’s tutorial, we will discuss whether the precious metals rally is likely to persist into 2026, and why platinum looks particularly interesting to me. As we can see, over just the last two weeks, platinum has rallied significantly more than both gold and silver.
Platinum Futures & Options
Ticker: PL
Minimum fluctuation:
0.10 per troy ounce = $5.00
Disclaimer:
• What presented here is not a recommendation, please consult your licensed broker.
• Our mission is to create lateral thinking skills for every investor and trader, knowing when to take a calculated risk with market uncertainty and a bolder risk when opportunity arises.
CME Real-time Market Data help identify trading set-ups in real-time and express my market views. If you have futures in your trading portfolio, you can check out on CME Group data plans available that suit your trading needs www.tradingview.com
