Gold next week: Key S/R Levels and Outlook for Traders🏆 Friday’s Close & Recent ATH:
Gold XAUUSD closed Friday around ~$3,990–$4,020/oz depending on venue most consolidated feeds show prints near $3.99–$4.02k at Friday close. The nearest recent intraday highs printed in the $4,030–$4,060 area across data providers this week, putting $4,000 as the immediate psychological battleground and $4,050–$4,060 as the latest short-term ATH band. YTD performance remains extraordinary 2025 YTD still showing a very large gain.
📈 Trend Structure:
Price continues to track a well-defined ascending channel on 1H/4H with clear impulsive legs out of recent consolidations. Market character = higher highs / higher lows, persistent dip-buying, and strong trend adherence into quarter-turn 25/50 handles near round thousands. Momentum has been resilient into week-end despite tariff headlines, suggesting structural demand and participation from official buyers.
🔑 Key Resistance Levels:
The most critical resistances to watch updated from Friday close ≈ $4,000:
• 4000 — immediate psychological round-number battleground.
• 4,030–4,060 — recent intraday ATH band / short-term supply recent highs printed here across venues.
• 4,075 → 4,100 — measured move / extension band if acceptance above the ATH zone occurs.
• 4,150–4,200 — stretch momentum targets on sustained risk-off and break/acceptance above 4,100 structural extension.
Quick note: different data vendors quote small differences in ticks — I used consolidated high prints to identify the ATH band.
🛡️ Support Zones:
Immediate supports step down as follows
• 3,980–3,960 intraday pivot just under Friday close.
• 3,950–3,930 multi-day base / near-week lows.
• 3,900–3,888 round-number shelf and the prior week’s consolidation band.
• Deeper structural shelves: 3,860–3,840, 3,825, 3,800 → 3,775.
A sustained break below ~3,900–3,888 would signal increasing corrective risk; daily close under ~3,825 would more clearly shift the regime.
⚖️ Likely Scenarios:
• Scenario 1 Base Case – Controlled dip toward 3,950–3,930 or the 3,900 area to reload bids, then rotation higher toward 4,030–4,060 as buyers re-engage.
• Scenario 2 Momentum Break – Quick clearance of the 4,030–4,060 ATH band → sustained acceptance above 4,075–4,100, unleashing momentum into 4,150–4,200. Overbought readings exist intraday, but structural demand has kept pullbacks shallow.
📊 Short-Term Targets:
On continuation: 4,020 → 4,030–4,060 → 4,075 → 4,100, with 4,150–4,200 as higher extensions if acceptance holds.
On retrace: 3,980 → 3,950 → 3,930 → 3,900 as the key retrace ladder.
💡 Market Sentiment Drivers updated:
• Tariff shock / geopolitical risk: President Trump announced proposals for large new tariffs reports of a 100% tariff threat and expanded export controls on Chinese imports this week, escalating trade-war risk and knocking risk sentiment — that increases safe-haven demand for gold. News outlets Reuters, AP, WaPo and market reactions were visible Friday.
• Rate & policy expectations: Markets continue to price material odds of rate easing/softer Fed path relative to earlier in the year; that reduces real yields and supports gold. Feeds and FedWatch implied pricing show elevated cut odds that underpin lower opportunity cost for gold.
• Official demand: Central bank buying has remained constructive — WGC/official stats show continued net purchases in recent months monthly buying rebounded in August. This adds structural support to dips.
• Macro/flow: Risk-off from tariff headlines, rare-earth export controls, and supply-chain concerns are the immediate drivers that could catalyze pushes toward the ATH band.
🔄 Retracement Outlook:
A tag of 3,950–3,930 or a short stop-run into 3,900–3,888 would be a typical healthy pullback inside the trend. Fast reclaim of the first support band after a liquidity flush often precedes fresh ATH tests. Breaks under 3,900 that fail to reclaim quickly increase the probability of a deeper slide into the 3,860–3,825 shelf.
🧭 Risk Levels to Watch:
• Bullish structure intact: holding above ~3,950–3,930 or more conservatively, above 3,900 keeps the bull case intact.
• Bearish line-in-sand: daily close < 3,825 weakens trend; daily close < 3,775–3,750 signals a bigger corrective phase and opens lower targets.
🚀 Overall Weekly Outlook:
Gold remains in a strong uptrend with $4,020–$4,030/ATH band $4,030–$4,060 → $4,000 as the immediate battleground after Friday’s close. Expect buyable dips while supports hold; the topside roadmap favors 4,075–4,100 and 4,150–4,200 as measured extensions if the market digests tariff news into a longer-running risk-off regime.
Platinum
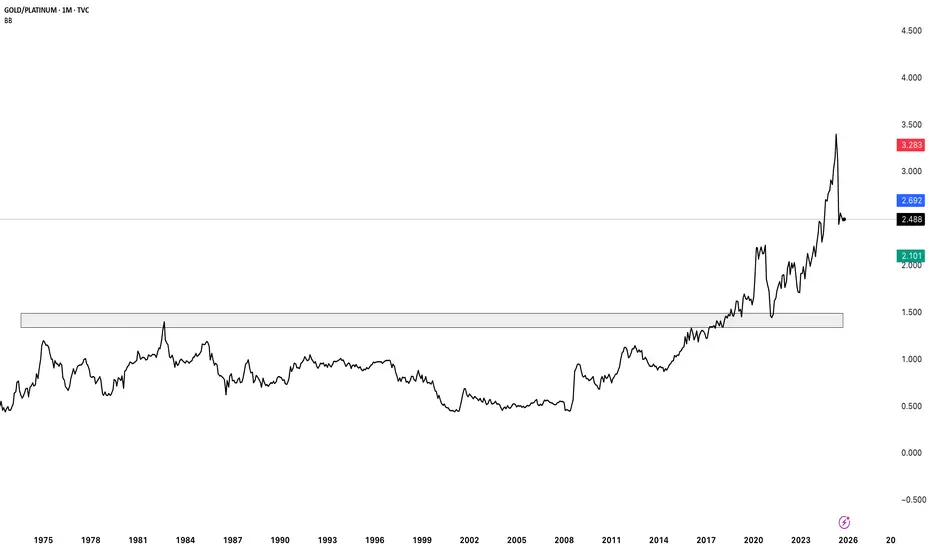
gold vs platinum ratio chart month scale gold strongly outperformed platinum on higher frame chart
Gold vs Platinum — A Tale of Two Precious Metals
Gold has always been the global store of value — a hedge against inflation, currency debasement, and geopolitical fear. Central banks hoard it, investors flock to it during crises. It’s less about industrial demand, more about trust.
Platinum, on the other hand, is the workhorse metal — crucial for automobile catalytic converters, hydrogen fuel cells, aerospace, and even medical implants. Unlike gold, its price is deeply tied to industrial cycles and EV transition trends.
🔎 Price Action Check (Gold/Platinum Ratio)
The chart shows the Gold-to-Platinum ratio stabilising after a steep fall, suggesting that platinum has been catching up after years of underperformance. Historically, whenever gold trades too far above platinum, it signals either platinum undervaluation... or gold over-enthusiasm.
With the renewable wave kicking in and auto demand reviving — is platinum gearing up for a comeback against gold?
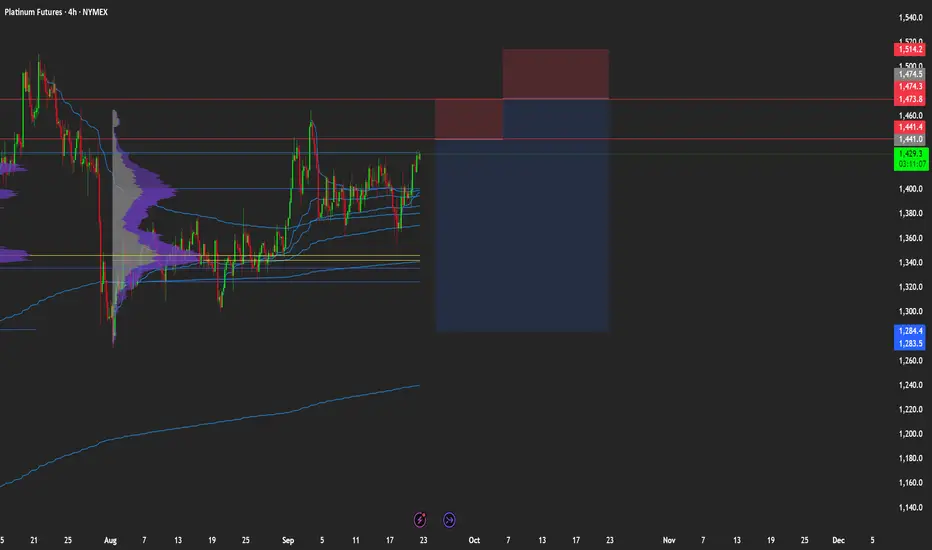
Platinum Futures Update Platinum Futures Update
This video is a quick update after hitting the 1-1 extension given in Julys video .
I look at what we can expect looking forward using higher time frames .
Tools used TR Pocket/ fibs

Stop!Loss|Market View: GOLD🙌 Stop!Loss team welcomes you❗️
In this post, we're going to talk about the near-term outlook for GOLD ☝️
Potential trade setup:
🔔Entry level: 3938.967
💰TP: 3866.522
⛔️SL: 4006.583
"Market View" - a brief analysis of trading instruments, covering the most important aspects of the FOREX market.
👇 In the comments 👇 you can type the trading instrument you'd like to analyze, and we'll talk about it in our next posts.
💬 Description: After rebounding from the all-time high near 4058, the price is likely forming an accumulation near the current level in the area of the previous accumulation. This situation will likely lead to further short-term decline towards 3868. Additional targets can be looked for near 3640.
Thanks for your support 🚀
Profits for all ✅
❗️ Updates on this idea can be found below 👇

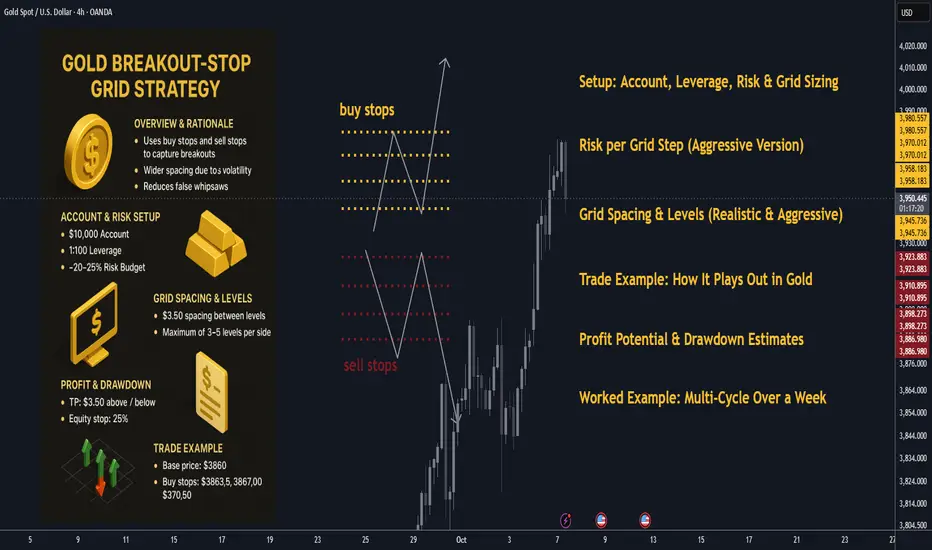
Gold Grid Trading Overview: Effective Strategy for 20% gains🪙 Gold Breakout-Stop Grid Strategy: Overview & Rationale
Grid trading is often built using limit orders above and below a base price, expecting the market to oscillate and capture many small profits. But in a strongly trending or volatile asset like gold, there is often breakout momentum that drives price through grid zones rather than bouncing.
By instead using buy stops above and sell stops below (i.e. breakout triggers), you capture directional thrusts, while still retaining a grid structure (i.e. multiple layers). Think of it as a hybrid between a breakout strategy and a grid.
Key advantages in gold:
• ✨ Gold often exhibits strong trending phases, with momentum after breakouts of supply/demand zones.
• 📊 Volatility is higher than many forex pairs, so you can space your grid more widely, reducing overcrowding.
• 🎯 With breakout stops, you reduce “false bounce” whipsaws inside the range; only when momentum validates do you trigger entries.
Risks / caveats:
• ⚠️ If price doesn’t break strongly and whipsaws, you could trigger and then reverse, creating drawdown.
• 📉 In a sideways gold market, fewer breakouts may be triggered, lowering trade frequency.
• 🛡 You must carefully size exposure and use drawdown controls, especially with leverage.
I’ll now walk through how to set this up, with gold-tailored specifics and sample trades (with increased aggressiveness), using realistic current spot prices (≈ $3,862) Investing.com.
________________________________________
🧮 Setup: Account, Leverage, Risk & Grid Sizing
📋 Account & Leverage
• Account size: $10,000
• Leverage: 1:100
• This means your maximum notional exposure is huge but margin and maintenance rules will limit you.
• We’ll now risk ~20–25%+ of equity in an aggressive version of this system (in order to aim for 20-30% weekly), i.e. $2,000–$2,500 at most drawdown limit for a grid run.
Note: This is very aggressive and only for demonstration. Many traders would never risk this much per grid.
💰 Risk per Grid Step (Aggressive Version)
• Let’s target $50 risk per triggered order (instead of $10) so that each step is meaningful.
• That means if a triggered order goes adverse by its maximum “stop zone,” your loss is $50.
• If you trigger, say, 5 steps, that’s $250 worst case on that direction (if all hit adverse).
• You must still cap total drawdown (e.g. 25% or $2,500) and limit exposures.
📈 Gold Contract & Price Movements
• Spot gold (XAU/USD) currently trades about $3,862.74 Investing.com.
• Let’s assume a contract specification such that 1 standard lot gives $100 per $1 move (so $1.00 move = $100) — a common ballpark in retail gold CFDs.
• Then:
• A move of $0.01 = $1 (for 1 lot).
• Therefore, if you trade 0.50 lots, a $1 move = $50.
So with this, to get ~$50 risk per $1 adverse move, 0.50 lots is a candidate (because $1 adverse × 0.50 lots × $100/lot = $50).
You can scale lot sizes accordingly.
📏 Grid Spacing & Levels (Realistic & Aggressive)
Given gold’s volatility, use wider spacing. Let’s choose:
• Grid spacing = $3.50 between successive triggers (a robust distance).
• We’ll place buy stops and sell stops relative to a base zone around current spot.
Let’s pick base ~ $3,860 as our pivot.
So:
• Buy stops: $3,863.50, $3,867.00, $3,870.50, $3,874.00, $3,877.50
• Sell stops: $3,856.50, $3,853.00, $3,849.50, $3,846.00, $3,842.50
(Max 5 levels each side, but you may cap to 3–5.)
Take Profit / Exit Logic:
• Target profit per trade = $3.50 (same as spacing).
• Thus one successful step = $3.50 × lot_size × $100.
• If lot_size = 0.50 lots, $3.50 × 0.50 × $100 = $175 profit per triggered trade.
• If you get 3 successful triggers in a run: 3 × $175 = $525 gross.
• That’s 5.25% on $10,000 in one clean directional run (before commissions/slippage).
You see the scaling is now aggressive — you risk more per step, but also gain more per successful trade. Limit how many triggers you allow (e.g. max 3–4 per side) to cap exposure.
Define a hard equity stop: e.g. if floating drawdown > 25% ($2,500), close all and reset.
________________________________________
🧭 Trade Example: How It Plays Out in Gold (Realistic Prices & Aggression)
We’ll do two detailed scenarios. This time we target higher returns, with real price zones.
________________________________________
🎯 Scenario A: Bullish Breakout
Base price: ~$3,860 (spot)
Buy stops: $3,863.50, $3,867.00, $3,870.50
Sell stops: $3,856.50, $3,853.00, $3,849.50
Lot sizing: 0.50 lots per order (so $3.50 adverse = $175 risk).
TP per trade: +$3.50
Sequence:
1. Gold climbs and breaks $3,863.50 → triggers Buy #1 at 3,863.50
o TP at 3,867.00 → profit if reached = ($3.50 × 0.50 × $100) = $175
2. Momentum continues, price breaks 3,867.00 → triggers Buy #2 there
o TP at 3,870.50 → another $175
3. Price surges, breaks 3,870.50 → triggers Buy #3 → TP = 3,874.00 → +$175
If all three succeed: Gross = $525 (5.25% gain) in one directional move.
If you allow up to 4 or 5 levels, total can scale to ~$700–900 (7–9%) in a strong move — if all hits. If reversal? If price reverses after buy #2, or before buy #3, you can:
• Close open longs immediately when opposite side’s sell stop triggers.
• Or cancel further buy stops once a reversal signal appears.
• Or net positions (if your broker supports hedging) — but that adds complexity.
Better to disable opposite side (sell stops) after the first buy triggers, to avoid collision exposures.
________________________________________
🔻 Scenario B: Bearish Breakout
Same base zone. Now price breaks downward.
• Sell stops at: 3,856.50, 3,853.00, 3,849.50
• TP each = –$3.50 from entry.
Sequence:
1. Gold breaks 3,856.50 → Sell #1 → target 3,853.00 → profit $175
2. Continues down, breaks 3,853.00 → Sell #2 → target 3,849.50 → +$175
3. Breaks 3,849.50 → Sell #3 → target 3,846.00 → +$175
If all three succeed: $525 profit.
If you allowed 4 levels: e.g. break 3,846.00 next → target 3,842.50 → +$175 more → total $700. Again, reversal risk must be managed.
________________________________________
📊 Mixed / Whipsaw Scenario
Suppose price crosses above $3,863.50 → triggers Buy #1, moves a bit, then reverses and crosses down through 3,856.50, triggering Sell #1.
You now hold:
• Long from $3,863.50 (losing)
• Short from $3,856.50 (potential profit)
This is a collision. To avoid chaotic risk:
• Cancel all opposite-side stops when first side triggers.
• Or immediately close all on first collision signal.
• Or lock in partial profit/loss and pause grid until trend clarity returns.
That’s why many breakout-grid strategies disable the opposite direction after first breakout.
________________________________________
📈 Profit Potential & Drawdown Estimates (Aggressive Model)
Let’s simulate one clean grid run (bullish) where 3 steps succeed fully:
• Gross profit = $525
• If you risked 3 steps * $175 = $525, worst-case these same 3 steps lose you $525 (if all adverse)
• Net = +5.25% in one run
• If you manage 2–3 such runs per week (if market allows), theoretically 10–15%+ weekly is possible — but that is optimistic.
However, in real life, not all runs will hit all targets — sometimes partial, sometimes losses. A drawdown of 25% ($2,500) is your cap boundary.
With that, if you undergo 5 bad runs in a row, you’d hit your equity stop.
If average win per run is $400 and average loss per bad run is $500, you need a favorable win-loss ratio to hit ~20–30% weekly. This is extremely aggressive.
________________________________________
🔁 Adaptive Mechanics & Enhancements (for robustness)
To improve consistency and manage risk, add:
• 📐 ATR-based spacing: Use a 14-period ATR on H4 or D1 to set grid spacing. If ATR = $4, spacing = $4 or $5.
• 📈 Trend filter: Only open buy-side grids when price > 200-period MA (H4 or D1), or only open sell-side when price < MA. Prevent fighting trend.
• 🚫 Volatility filter / news blocks: Do not place or trigger near major gold-related news (Fed, CPI, central bank announcements).
• 🔄 Grid rebase / reset: After a winning cycle, re-center grid around new price and restart stop orders.
• 📈 Scaling rules:
– Aggressive scaling: after n consecutive wins, increase lot size (within risk caps).
– Defensive scaling: after a loss, reduce lot size or skip grid.
• 🛑 Equity-stop / margin cap: If floating drawdown > 25% or margin usage > 80%, close all and reset.
• 🧊 Cooldown periods: After a loss or big run, pause grid orders for some hours/days to let market settle.
________________________________________
🧮 Worked Example: Multi-Cycle Over a Week (Aggressive)
Say you run 3 grid cycles in a week under trending conditions:
Cycle Direction Steps hit Gross profit Net (after one partial loss)
1 Up 3 out of 4 levels hit fully +$525 +$490 (small drawdown on partial)
2 Down 2 of 3 hit, 1 reversed +$350 +$320
3 Up 4 levels hit fully +$700 +$700
Total gross = $525 + $350 + $700 = $1,575
Net after adjustments/slippage ~ $1,450–$1,500
That’s ~ 14.5% gain in one week.
If the market is more favorable, you may hit ~20–30%, but the risk is commensurate.
Over multiple weeks the compounding is powerful — but a few big losses can wipe gains.
________________________________________
✅ Summary & Implementation Tips
• Use breakout stops (buy stops above, sell stops below) instead of limits to catch directional thrusts in gold.
• Wider grid spacing (e.g. $3–$5) is essential to survive volatility.
• Lot sizing must match your desired risk per step (here $50).
• Limit max triggers per direction and enforce a hard equity stop (e.g. 25%) to avoid blow-ups.
• Employ trend / volatility filters to filter low-probability entries.
• After a net winning run, rebase grid to current price.
• Use scaling and cooldown mechanics to moderate aggression.
• On collision signals, cancel opp side stops or close everything to avoid contradictory exposures.
Gold next week: Key S/R Levels and Outlook for Traders🏆 Friday’s Close & Recent ATH:
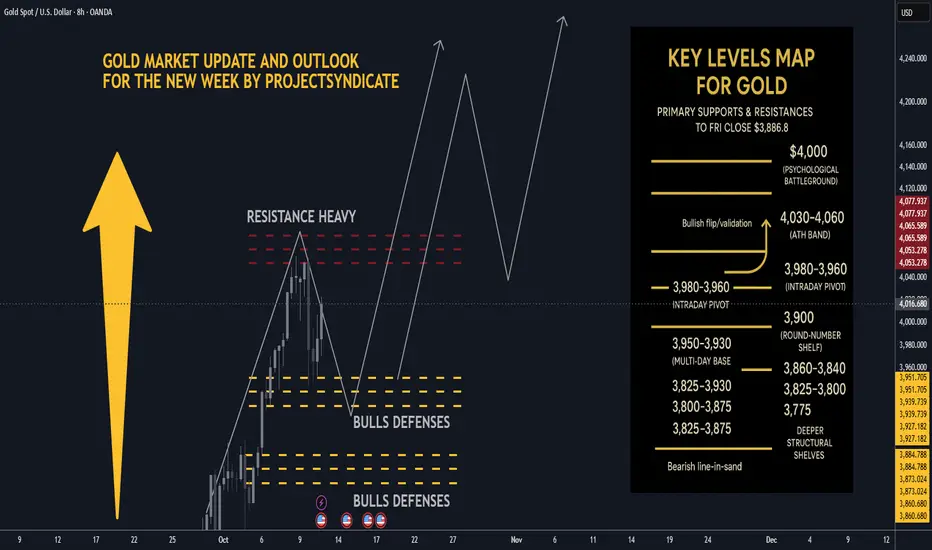
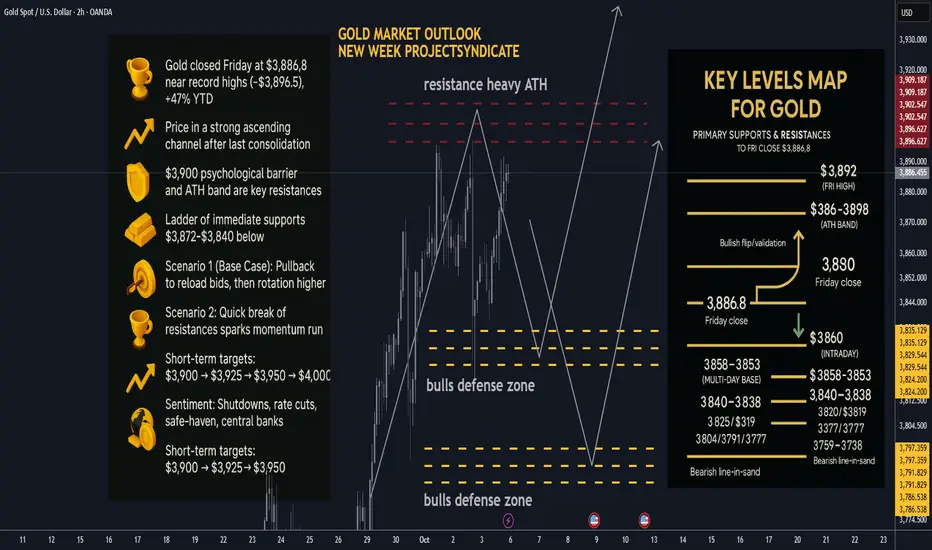
Gold (XAUUSD) closed Friday at $3,886.8, after printing a session high near $3,891.9. The latest all-time high is ~$3,896.5 (Thu), putting $3,900 squarely in play as the next psychological milestone. YTD performance remains extraordinary (≈+47% in 2025).
📈 Trend Structure:
Price continues to track a well-defined ascending channel on 1H/4H with a clean impulsive leg out of the last consolidation. Market character = higher highs / higher lows, persistent dip-buying, and strong trend adherence into quarter-turn levels (25/50 handles).
🔑 Key Resistance Levels:
The most critical resistance now sits at $3,900 (psychological + round-number supply). Beyond that, watch the ATH band $3,896–$3,898 and Friday’s spike high $3,892. Break/acceptance above opens $3,925–$3,950 as measured-move extensions, with $4,000 as a probable magnet on momentum follow-through.
🛡️ Support Zones:
Immediate supports step down as follows: $3,872–$3,860 (intraday pivot), $3,858–$3,853 (multi-day base), $3,840–$3,838 (Fri low). Deeper structural shelves: $3,825–$3,820, $3,804, $3,791, $3,777. A sustained break below $3,838–$3,825 would signal a more meaningful corrective phase.
⚖️ Likely Scenarios:
• Scenario 1 (Base Case) – Pullback then push: Controlled dip into $3,858–$3,838 to reload bids, then rotation higher toward $3,900+.
• Scenario 2 – Straight break: Quick clearance of $3,892/ATH $3,896–$3,898 → $3,900, unleashing a momentum run into $3,925–$3,950.
(Overbought signals persist, but structural demand keeps dips shallow.)
📊 Short-Term Targets:
On continuation: $3,892 → $3,900 → $3,925 → $3,950, with $4,000 as stretch if acceptance holds above $3,900. On retrace: $3,858 → $3,840 → $3,825.
💡 Market Sentiment Drivers:
• Shutdown-driven data delays & uncertainty are boosting safe-haven bids; Friday’s NFP was delayed, reinforcing cut expectations.
• Rate-cut odds remain elevated into October, keeping the opportunity cost of holding gold low (FedWatch/BofA commentary).
• Official-sector demand stays constructive (central banks resumed net +15t buying in August per WGC), underpinning dips.
• Macro/geopolitical risk + tariff chatter continue to provide a tailwind; 2025’s ~47% surge underscores the regime shift.
🔄 Retracement Outlook:
A tag of $3,858–$3,853 (multi-day pivot) or a stop-run to $3,840–$3,838 is a typical “healthy” pullback zone inside trend. Swift reclaim of $3,858/53 after a liquidity flush often precedes fresh ATHs.
🧭 Risk Levels to Watch:
Holding above $3,858–$3,838 keeps the bullish structure intact. Failure/acceptance below $3,825 shifts risk toward $3,804 → $3,791 → $3,777 and opens the door to $3,759–$3,738.
🚀 Overall Weekly Outlook:
Gold remains in a power-trend with $3,892/ATH $3,896–$3,898 → $3,900 as the immediate battleground. Expect orderly, buyable dips while those supports hold; topside roadmap favors $3,925–$3,950 with $4,000 viable on a decisive breakout/acceptance.
________________________________________
🗺️ Key Gold Levels Map — Primary Supports & Resistances (Updated to Fri Close $3,886.8):
Primary Resistances: 3892 (Fri high) → 3896–3898 (ATH band) → 3900 → 3925 → 3950 → 4000.
Primary Supports: 3872–3860 (intraday) → 3858–3853 (multi-day base) → 3840–3838 (Fri low) → 3825 / 3819 → 3804 / 3791 / 3777 → 3759–3738 (deeper control).
Bullish flip/validation: Sustained acceptance ≥3900 turns dips into buys toward 3925–3950.
Bearish line-in-sand: Daily close <3825 weakens the trend; <3791 confirms a broader corrective swing.
XPT/USD BULL HEIST ALERT! Breakout & Layering Strategy!🌟 XPT/USD "THE PLATINUM HEIST" - BULL MARKET SWING PLAN 🌟
Greetings, Fellow Thieves & Market Robbers! 🤑💎✂️
The vault on XPT/USD (Platinum) is primed for a major bull heist. Our intel suggests a massive breakout is imminent. This is not a drill! Time to execute the plan and fill our bags with shiny loot. 🚨💣🚔
🏦 THE MASTER HEIST PLAN (BULLISH SWING) 🏦
📍 ENTRY PROTOCOL: THE BREAKOUT TRIGGER ⚡
The main vault door is at 1380.00. We do not enter until this level is CONFIRMED BROKEN. 🚨 SET YOUR TRADINGVIEW ALARMS! 🚨 Do not miss the signal! This is crucial!
🤵♂️ THE "LAYERING" STRATEGY: (Thief's Signature Move)
Once the breakout is confirmed, we deploy multiple limit orders to maximize our haul. The classic thief method:
LAYER 1 BUY LIMIT: 1370.00
LAYER 2 BUY LIMIT: 1360.00
LAYER 3 BUY LIMIT: 1350.00
LAYER 4 BUY LIMIT: 1340.00
(Add more layers based on your own risk appetite, you cunning criminals!)
🛑 STOP LOSS: THIEF'S ESCAPE ROUTE
This is a HEIST, not a holiday. Our emergency exit is far below at 12400.0 to avoid any market whipsaw traps.
⚠️ Dear Ladies & Gentleman (Thief OG's), adjust your SL based on your own strategy & risk tolerance! Protect your capital!⚠️
🎯 TARGET: CASH OUT & VANISH!
The police have set a barricade at 25500.0. Our mission is to escape with the stolen money BEFORE we get there! Take your profits at 25400.0 and disappear into the night! 🚓💨💰
⚠️ HEIST SAFETY BRIEFING ⚠️
NEWS CANCEL HEISTS: Economic data can cause chaos. Avoid opening new positions during high-impact news events. 🗞️🔍
MANAGE YOUR LOOT: This is a SWING/DAY plan. Size your positions wisely. Greedy thieves get caught! 🚓👮♂️
THE MARKET IS A TRAP: Stay vigilant. Price can fake out at any moment. Trust the plan, not your emotions.
💖 SUPPORT THE CREW!
Smash that 👍 LIKE button and 🔔 FOLLOW to boost the signal! Your support funds our next market robbery and keeps the heist plans coming! Let's get this platinum! 🏆💎🚀
I'll see you on the next job. Stay sharp, thieves! 🤑🐱👤

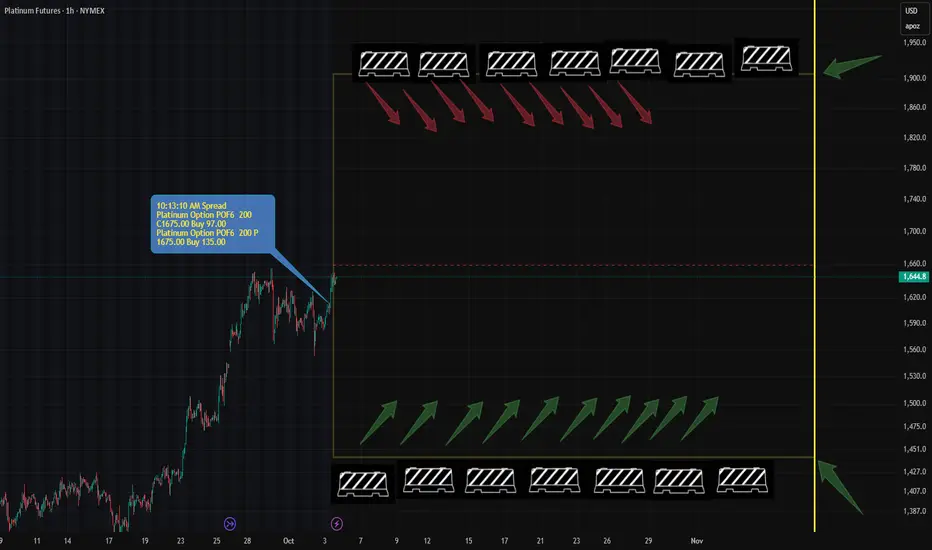
A Major New Straddle Just Hit Platinum — Here’s What It MeansAfter yesterday’s CME session, a significant options portfolio appeared in platinum (PL) with expiry in 75 days.
Structure: A classic Straddle, opened at the central strike
Cost: A hefty $2 million
Break-even points:
Lower: 1443
Upper: 1907
(Marked on the futures chart)
At first glance, this looks like a bet on massive volatility — profit only kicks in after price moves beyond either break-even level.
But here’s the catch:
If you’re thinking "How can anyone profit from such wide boundaries?" —
👉 You're thinking in the right direction.
The owner likely doesn’t need price to go beyond these levels.
Instead, they’re positioning for a smarter play.
Once price approaches either boundary closely, the straddle can be transformed using synthetic logic:
Near 1443 → convert into a risk-free Сall
Near 1907 → convert into a risk-free Put
These synthetics would be immediately at breakeven — no losing leg.
Just pure directional exposure, funded by the original premium.
Given the size, this is not retail.
This is someone who knows exactly what they’re doing — and will act rationally near these extremes.
📌 So what does it mean for us?
These break-even levels aren’t just technicals —
They become high-probability zones for trade entries:
Short setup near 1907
Long setup near 1443
I’d recommend watching both closely.
I certainly will planning my trades around them.
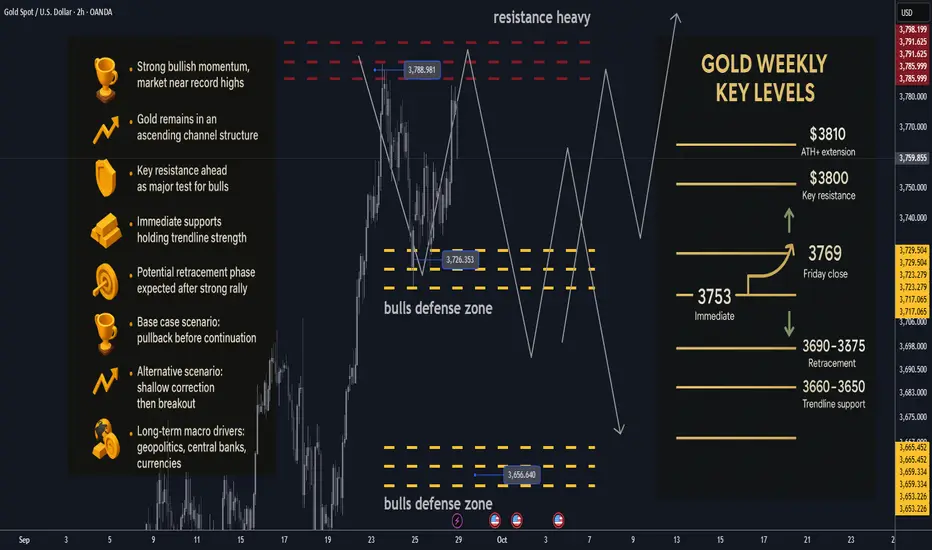
Gold next week: Key S/R Levels and Outlook for Traders🏆 Friday’s Close & Recent ATH: Gold closed the week near $3,769, not far from its latest all-time high ($3,734) as bullish momentum continues to dominate. Every dip is being met with strong buying interest, reinforcing the uptrend.
📈 Trend Structure: The market remains firmly inside an ascending channel on both 1H and 4H charts. The broader structure is bullish, with corrections appearing as healthy consolidations rather than reversals.
🔑 Key Resistance Levels: T he most critical resistance sits at $3,800, a psychological and technical barrier. Beyond that, $3,810–3,820 represents potential breakout extension targets if bulls push through.
🛡️ Support Zones: Immediate support rests at $3,753–3,755, aligned with a rising trendline. Deeper supports lie at $3,690–3,675, with stronger downside protection at $3,660–3,650. A sustained break below $3,650 would signal deeper correction risk.
⚖️ Likely Scenarios:
o Scenario 1 (Base Case) – A short-term pullback toward support before continuation higher.
o Scenario 2 – A shallow correction, followed by a direct breakout above $3,800.
Probabilities currently favor Scenario 1 due to overbought conditions.
📊 Short-Term Targets: On continuation, upside levels to monitor are $3,740 → $3,780 → $3,800, with a possible push toward $3,810 ATH+ extension.
💡 Market Sentiment Drivers: Geopolitical tensions, central bank accumulation, and persistent currency debasement concerns remain key macro tailwinds. These factors underpin the long-term bullish bias, despite near-term choppiness.
🔄 Retracement Outlook: Analysts suggest a retracement is due after the strong run-up. A controlled dip into the $3,660–3,640 zone could offer buying opportunities for swing traders targeting another leg higher.
🧭 Risk Levels to Watch: Holding above the ascending trendline (around $3,630–3,640) keeps the bullish structure intact. A decisive break below this area could trigger a deeper correction toward channel midpoints.
🚀 Overall Weekly Outlook: Gold remains in a strong bullish trajectory with $3,800 as the major battleground. Expect short-term pullbacks, but the path of least resistance is still higher, with long-term prospects pointing toward $4,000.
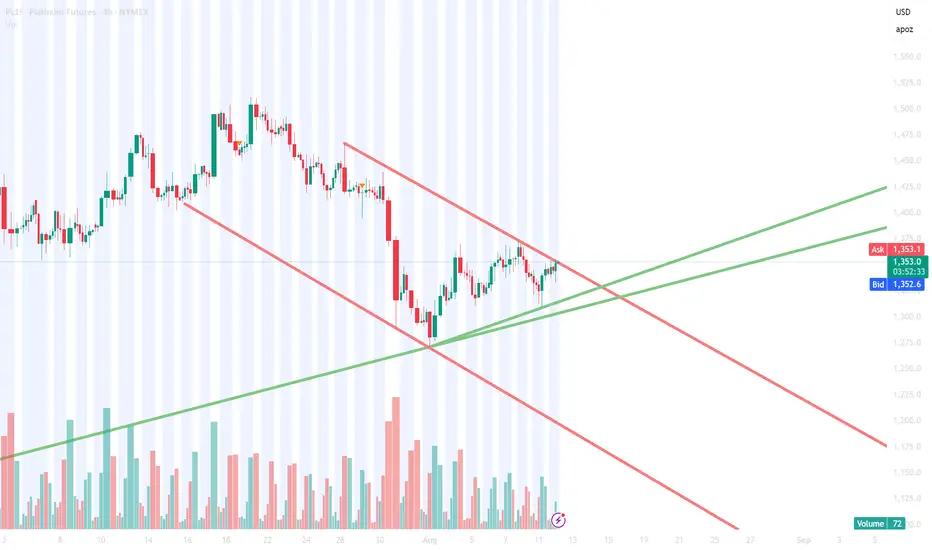
Short Idea on Platinum (PL1!)Based on :
- High Probability of a dxy rally and zb1! short could make precious metals drop
- VP and Avwap levels
- 2 Potential supply zones
Is this a platinum breakout?Using a weekly chart of a platinum ETF.
Breaking out above it's triangle pattern. Needs confirmation though or retrace in the next coming months

PLATINUM IS COMPLETELY UNDERVALUED, BUY NOW!TVC:PLATINUM CAPITALCOM:PLATINUM
Platinum is absolutely undervalued and is currently trading at only $975 USD.
The Gold to Platinum Ratio just hit a new all time high with the Current Ratio being 3,09 even though Platinum has traded since the 1970s till 2016 at a consistent average of 1:1. Gold's all time low against Platinum was at 0,42 in June 2008; AKA the 'Great Financial Crisis'.
Every single indicator shows that right now is the perfect time to buy Platinum especially because the 'Gold rush' is in its absolute final stages.
Keep in mind that Platinum is around 15 times rarer than Gold on Planet Earth.
May fortune favor the bold, and as always - DYOR NFA ! ;)
CYANE

Platinum This is a continuation of my previous post on platinum for technical analysis and data output, as I could not attach my four-hour chart. Please feel free to comment I love advice and knowledge.

Platinum fundamental and technical analysis reportPlatinum: Data Overview.
1. Supply–Demand Imbalance
- 2025 mine supply: 7,000,000 oz
- 2025 total demand: 7,900,000 oz
- Annual deficit: 900,000 oz
- Q2 price change: +35 %
2. Price & Ratio
- Spot price: 1,402.00 current USD/oz
- Gold–Platinum ratio: ~2.0× (long-term norm: 1.2×)
3. Technical Analysis
Daily Timeframe
- Support at 1,360 USD
- Resistance at 1,420 USD
- Confirmed triple-bottom pattern
- Scenario 1 target: 1,460 USD (Fibonacci extension)
- Scenario 2 downside risk: 1,360 USD
Four-Hour Timeframe
- Local support at 1,380 USD
- Immediate resistance between 1,390–1,400 USD
- Scenario 1 target zone: 1,440–1,460 USD
- Scenario 2 retest level: 1,380 USD
4. Elliott Wave Projection
- Current count: Wave 3 of 5
- Wave 3 completion target: 1,480 USD
- Wave 4 corrective zone: 1,420–1,440 USD
5. COT & CFTC Positioning (NYMEX Platinum)
- Non-Commercial (speculators):
- Long: 53,057 contracts
- Short: 38,701 contracts
- Net: +14,356 contracts
- Commercial (hedgers/producers):
- Long: 20,511 contracts
- Short: 40,721 contracts
- Net: −20,210 contracts
- Non-Reportable (small traders):
- Long: 84,081 contracts
- Short: 89,935 contracts
- Net: −5,854 contracts
- Total open interest: 94,804 contracts
6. NYMEX On-Warrant Warehouse Inventory
- Platinum inventory: 42,500 oz
- Month-over-month change: −3.2 %
7. Key Watchpoints
- US Federal Reserve policy developments
- Chinese automotive demand and emissions regulations
- PGM lease rates and futures curve dynamics
- ETF flows and physical investment into platinum

Gold Market Technical Outlook and Key Levels BULLS/BEARS📊 Technical Outlook Update — Gold (H4)
As of 15 Sep 2025
• Spot is holding ~$3,640–3,650/oz after last week’s record spike; price is consolidating since.
• On futures, settlement came in $3,686.40 (Sep 12) with a short-term “bullish breakout” narrative into today’s session.
🏆 Bull Market Overview
▪️ Massive rally now pausing below $3,700; momentum stalling under headline resistance.
▪️ Overhead resistances will limit upside:
— $3,700 (first major cap) • $3,750 (stretch/overshoot)
▪️ Key S/R zones (now):
— Resistance: $3,700 / $3,750
— Support: $3,600 / $3,500 / $3,400 (step-downs)
▪️ Bias: short-term limited upside after the run; risk of liquidity sweep lower before trend resumes.
▪️ October roadmap: looking for a re-test near $3,500 later in the month to reload bullish flow/liquidity.
▪️ Volatility: elevated vs. summer; headline-sensitive into the Fed this week.
⭐️ Recommended Strategy (H4 game plan)
▪️ Sell the first tests into $3,700 / $3,750 with tight risk; fade wicks.
▪️ Buy the dip into $3,600 → $3,500 → $3,400 zones; scale entries, keep stops beyond structure.
▪️ Momentum traders: wait for clean H4 close above $3,700 to target $3,730–$3,750; otherwise fade spikes.
▪️ Position traders: patient bids $3,520–$3,480 zone preferred for October reload.
▪️ If flat right now: no chase—let price come to your levels.
Latest gold market updates
📈 Post-CPI pop kept spot above $3,640, reinforcing dip-buying interest even as the dollar firmed.
📰 Technicians flag bullish breakout dynamics despite intraday chop; futures settled $3,686.40 (Sep 12) ahead of fresh catalysts.
🧭 Context: market is consolidating beneath record highs set last week; pullbacks seen as tactical within a larger uptrend.
Level map
R2: $3,750 (bulls’ stretch / likely exhaust on first touch)
R1: $3,700 (primary cap; fade unless impulsively reclaimed)
S1: $3,600 (first bounce zone; liquidity magnet)
S2: $3,500 (October re-test area to accumulate)
S3: $3,400 (deeper flush / high-conviction buy zone)

DON'T MISS a potential CRAZY RUN!!! Unfolding RIGHT NOW!!!When I m opening this chart I m always seeing hudge potential and upside.
This, right here, is a key moment in it's development: it either goes crazy or starts ranging some more.
Let's see!
Let me know if, and why, you agree or disagree with this!

PLATINUM Sell Signal triggered.We couldn't have had a more timely signal on Platinum (XPTUSD) last time we looked at it (April 08, see chart below) as we made a buy call exactly at the bottom of the Descending Triangle with the immediate rebound that followed, quickly hitting our $985.00 Target:
This time, the price has triggered a Sell Signal as the 1D MA50 (blue trend-line) broke and a Lower High potentially initiates a Channel Down similar to those of 2024. Both declined to their 1.236 Fibonacci extensions before breaking upwards.
As a result, we treat this as a sell opportunity, targeting 1220.
-------------------------------------------------------------------------------
** Please LIKE 👍, FOLLOW ✅, SHARE 🙌 and COMMENT ✍ if you enjoy this idea! Also share your ideas and charts in the comments section below! This is best way to keep it relevant, support us, keep the content here free and allow the idea to reach as many people as possible. **
-------------------------------------------------------------------------------
💸💸💸💸💸💸
👇 👇 👇 👇 👇 👇

Is there any shine left on Platinum?Platinum is looking extremely bullish to me. 1700 could be the next target after a breakout here.

The GOLD RALLY is happening AGAIN... BUT this time on PLATINUMBig time momentum for platinum on daily. It seems to be so powerful at the moment. At this moment, I m expecting either an aggressive up continuation move, or some more consolidation.
If my set-up condition will be meet I'll take a trade instantly.
What you think about this market?

How and why Silver May Overshoot Well Beyond 50 by 2026A description of silver price anomalies. Info is in video-only thing to add is we are going onour 6th consecutive year of silver structural demand deficits. The odds of a massive upside move intensify exponentially day to day at this point.
Do your own research

Platinum (PL)Tight stop hoping fo a real break out -Taking a long position in Platinum, anticipating a breakout to the upside from the current channel. Managing the position with a tight stop loss.
Platinum Breakout Stalk: Thief Entry Only After Confirmed🧠 Thief's Heist Plan Activated!
Asset: XTI/USD (PLATINUM) 💎
Strategy: Bullish Pullback + Breakout Play 💥
🔍 We stalking platinum's neutral zone… waiting for that clean breakout!
No early entries, no premature SLs. Discipline = Profits. 🎯
🎯 Entry: After breakout confirmed. Use multiple DCA limit orders to layer in like a ghost.
🔐 Stop Loss: ONLY after breakout – Place at 1280.00 🛡️
💎 Target: 1560.00 – Vault unlock point! 💰
📵 DO NOT place SL or orders before breakout – patience is the thief’s edge. 🧘♂️
This isn’t gambling... this is precision trading. Breakout = green light 🚦
Get ready to raid the platinum vault!
#ThiefTrader #BreakoutStrategy #PlatinumHeist #XTIUSD #BullishSetup #SmartMoneyMoves

⤷ XPT/USD Metals Alert | Breakout Heist Mode Engaged ⤶🔐💎 XPT/USD “The Platinum Heist” — MA Breakout Bullish Robbery Plan! 💰🚀
💼 Asset: XPT/USD "The Platinum"
📊 Market Plan: BULLISH
🕵️♂️ Thief Entry: Breakout of MA 🔓 (Above 1350.00)
🛑 Stop Loss: Hidden Vault 🔐 (1300.00)
🎯 Target: Getaway Car 🚗💨 (1420.00)
🎯 Style: Layered entries using thief-style limit orders
🗣️ Platinum is not just metal — it’s MONEY waiting to be stolen!
We’re loading up our duffel bags 🎒 and stacking limit orders right behind the breakout door 🚪 at the 1350.00 MA line. Once that door bursts open — robbery in progress! 📈💥
💣 Plan Execution
Place buy-stop above the moving average, or stack limit buys on pullbacks near breakout candles. Timing is king 👑 — watch the 15m or 30m candles like a hawk 🦅. MA breakout = 🔑 Entry trigger.
🚨 Stop Loss Strategy
SL isn’t just a number — it’s your insurance against the market police 🚓. Our default vault is hidden below 1300.00, but adjust according to your order stack + risk level. This is a heist, not a charity.
🔓 Thief Target Locked
Getaway zone at 1420.00 🎯, but you’re free to vanish early with profits if the market gets hot 🔥 or volatile ⚡. Trailing SL recommended for slick exits 🎿💸.
🧠 Day & Swing Robbers Note
Whether you’re scalping a few bars or riding the swing wave — only trade in the LONG direction here. Don't get greedy, get clever 😼.
📢 News Alert & Risk Control
Don’t enter during news explosions 💣! Set alerts, use trailing SL, and don’t fall asleep on the job 😴.
🏴☠️ Boost the Gang
Tap that 💥Boost Button💥 and power up our global Thief Trader crew 💹🌍. Every click = another silent alarm disabled 😎. Share, Like, Follow — help us fund the next mission.
Stay Ready. Stay Robbing. See you at the next Heist. 🤑⏳
#ThiefTrader #PlatinumPlan #BreakoutBoys #XPTUSD #MetalMoneyMoves #LayeredEntry #HeistStyle
