DOT in accumulation zone!Hello followers and haters,
I figured out that almost everyone here hates longterm analysis so I will post another one.
We can see DOT once again in beautiful accumulation zone , zone where I personally started accumulating tokens in previous cycle and in this one as well.
We are looking to take some profits on the FIRST TP where we can expect anywhere from 1 00% to 200% depending on our average buy price.
Second TP will bring us anywhere from 300% to 350%.
If we however drop even lower (WHICH WOULD BE AMAZING) there is an ALL-IN zone where I will be looking to put more money on my buys.
My accumulation is buying some DOT every 2-3 days while we are in the zone.
I marked only 2 TP zones for and as we will move UP in the BULL RUN I will post updates on where my next TP zones are.
Hope this helps, play it smart and stay patience!
Polkadot

DOTUSDT 1,315% profits potential 5X leverage —LONG tradeIt only happens once or twice per year. This year it is likely we get two opportunities to go LONG starting from a major bottom. Only twice in the whole of 2026.
We will have only one opportunity to SHORT from a major high point. After this bullish wave is over, we will have a very strong correction.
Polkadot is trading at bottom prices, truly, the lowest in many years. This is always an opportunity. In this case, an extreme opportunity buy-zone. Notice that this is the second chance.
The first chance was late December 2025. The second, and last, chance comes later, January 2026. After this higher low, DOTUSDT is going green.
Notice the trading volume... Zero. No action because prices are just too low. The market is depressed, people are gone.
The market wants live, it wants action, it needs growth. What is the best way to attract capital into this market? Just let the money flow.
Pimp-pump up the market and watch how the sentiment changes in a flash. As Polkadot recovers and grows, we will experience a period of positive momentum, a much needed one.
This type of opportunity doesn't happen very often. Take action today.
Full trade-numbers below:
_____
LONG DOTUSDT
Leverage: 5X
Potential: 1315%
Allocation: 5%
Entry zone: $1.75 - $1.95
Targets:
1) $2.14
2) $2.42
3) $2.89
4) $3.65
5) $4.19
6) $4.88
7) $5.64
8) $6.87
Stop: Close weekly below $1.70
_____
Thank you for reading. Your continued support is highly appreciated.
Namaste.

1W Polkadot (DOT): Full updates & thoughts on the chain Technical situation (chart)
On the weekly, DOT is still struggling to show sustainable strength. Price continues to sit near the low end of the range around ~2.0, failing to make meaningful higher highs or clear range expansion. This looks like more consolidation and distribution pressure rather than a clean breakout, and recent candles confirm a bearish tone with lower peaks and no strong follow-through. Price action is choppy and defensive, reflecting weak conviction from buyers.
Regarding upgrades and fundamentals
Polkadot has a long roadmap of structural upgrades that are intended to boost the network’s utility and developer appeal. The ecosystem is transitioning to Polkadot 2.0 with features like Agile Coretime, Async Backing, and Elastic Scaling fully rolling out, which are designed to improve performance and flexibility for parachains. A hard cap on DOT supply and stepped-down issuance is also being introduced starting in 2026, reducing inflation over time. Smart contract support and increased Ethereum compatibility are targeted, potentially lowering friction for dApp developers and deployment.
CoinMarketCap
+1
Additionally, the Join-Accumulate Machine (JAM) architecture and new identity (“Individuality”) tooling are part of the broader 2026 roadmap, making Polkadot more scalable and feature-rich.
CoinMarketCap
There are also ecosystem developments like bridges (e.g., Hyperbridge enabling multi-chain connectivity) and improvements to developer tooling, which bolster long-term fundamentals.
Wikipedia
So what does that mean right now?
I looked at the chart through the lens of these upcoming upgrades to see whether news flow is already reflected in price. The short answer: not really — at least not yet. Despite strong on-chain activity and a clear roadmap, DOT price has been weak and range-bound. In fact, it’s down significantly over the past year even as the protocol continues to build out features.
Nasdaq
This divergence between fundamentals and price action is typical in environments where upgrades are slow to translate into actual adoption and utility — especially when broader market sentiment is range-bound or bearish for altcoins.
Overall take
From a technical perspective, DOT looks a bit bearish and indecisive right now, trapped at lows with no clear breakout structure. The long-term fundamental backdrop (protocol upgrades, supply cap, smart contract support) is constructive, but price isn’t yet reflecting that optimism. It’s a classic case of tech building ahead of price action, and until the market starts valuing those upgrades — likely via adoption, volume growth, or real activity metrics — the chart remains choppy and tilted bearish near current levels.
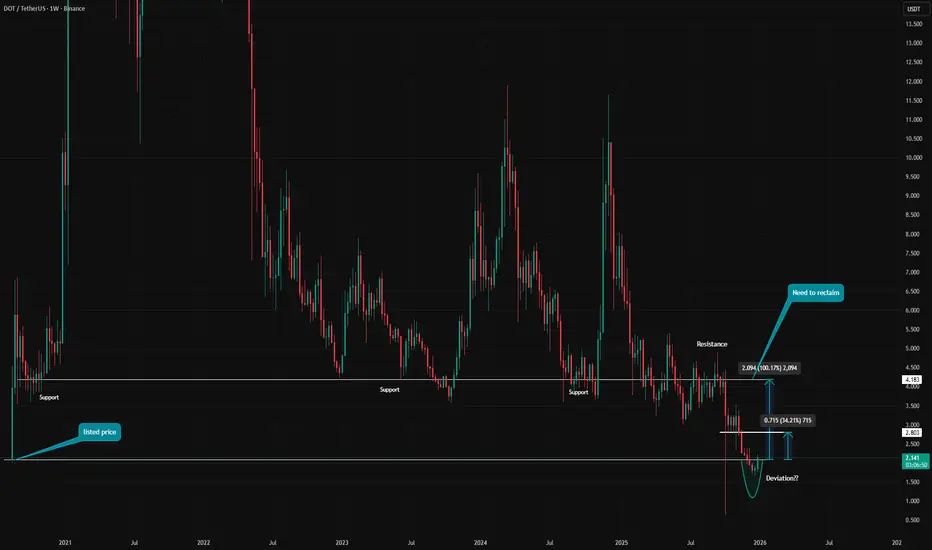
DOT / USDT – Weekly Structure Price is currently reacting around the listed price / origin level
This level has limited historical validation as support and should be treated as a reaction zone, not a confirmed long-term support.
Recent price action shows a strong move below this level followed by a reclaim, suggesting a possible deviation.
However, deviation alone does not confirm a structural shift.
From here, a short-term continuation toward local resistance is possible.
For any meaningful bullish continuation, price needs to reclaim and hold above that resistance.
As long as price remains below resistance, this move should be treated as a reactive bounce within a broader bearish structure, not a confirmed reversal.
This is a key decision area.
Let acceptance and structure confirm the next move.
Do you see this as a deviation reclaim, or just a temporary reaction?
MrC
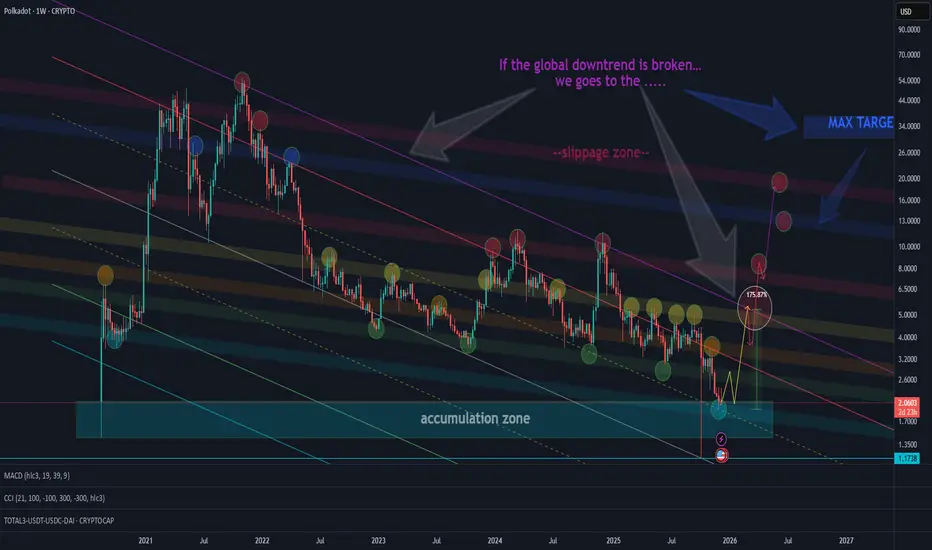
POLKADOT DOT DOTUSD 1W TFThe chart shows support and resistance levels as well as the targets up to the global descending channel.
If the global downtrend is broken - the maximum target is the blue zone.
The red zone represents a short-squeeze area originating from the blue zone — which may or may not occur and the squeeze could also happen earlier.
At the moment we are in the accumulation zone of the asset.
POLKADOT ($DOT) Polkadot (DOT) Weekly Chart (1W) Technical Analysis
Examining the Polkadot (DOT) weekly chart, we can see that the asset is at a highly critical and historic juncture. From the perspective of a technical analyst, let's detail this chart regarding market cycle, critical support/resistance levels, and trend structure.
1. General Market Structure and Cycle Analysis
The chart clearly illustrates a classic "Boom and Bust" cycle.
Full Cycle Reset: The price has returned to the exact starting point of the massive bull run that began in late 2020 (approximately $1.98). This means the price action of the last 5 years has been effectively erased, returning the market to "ground zero."
Trend Outlook: The main structure is currently dominated by a Bear Market. The major ascending trendline (dashed line) was broken in early 2022, and the price has remained suppressed below this trend ever since.
2. Critical Price Levels
The most significant technical zones on the chart are as follows:
🟢 Major Support: $1.98 - $2.00 Zone (The "Kiss of Life")
This region is the "Make or Break" level for DOT.
Historical Significance: This is where the historic rally of 2020 originated. Returning to this level suggests we may be at a point of total seller exhaustion (capitulation).
Technical Expectation: A strong reaction/bounce from this level is technically highly probable. However, weekly closes below this level would drag the price into "price discovery" to the downside (unknown territory).
🔴 Major Resistance: $10.67 (Red Line)
Marked as "$10" on the chart, this is the most critical resistance barrier.
Price attempted to breach this level in 2022, 2023, and 2024, but was rejected every single time (as indicated by the red down arrows).
It is technically impossible to speak of a new bull trend until this level is decisively reclaimed.
⚠️ Intermediate Resistance and Broken Trendline
Broken Ascending Trend: The dashed black line now acts as strong diagonal resistance. Every bullish attempt hits this line or horizontal resistance and retraces.
Intermediate Targets: In a potential reversal, the $4.50 - $5.00 band would likely act as the first intermediate resistance.
3. Technical Formation and Interpretation
Round Trip (Cycle Completion): The drop from $55 levels back to $2 indicates a massive cycle completion. Usually, the end of such large drops is followed by a prolonged "Horizontal Accumulation" phase.
Triple Top / Rejection: The multiple rejections at the $10 level (seen around 2024) prove there is a significant supply (seller) block in that region.
4. Investor Strategy and Scenarios
As a market analyst, two main scenarios can be constructed based on this chart:
Scenario A: "Bottom Fishing" (Bullish Reversal)
Thesis: Price is at historic support ($1.98). The Risk/Reward (R/R) ratio is at its most attractive point for buyers.
Strategy: Gradual accumulation can be attempted in the $1.98 - $2.10 range, with a stop-loss strictly placed below $1.80.
Target: The first reaction target is the $4-5 band. Long term, the +$10 limit could be tested again. And Maybe old ATH = 50$

POLKADOT – LONG SETUP - LOADING SHORT SQUEEZE POTENTIALTraders,
$Polkadot is close to forming a high probability long setup, but it is not confirmed yet.
Here is the compact breakdown.
WHY DOT IS SETTING UP
Since 08 November price has been grinding down
Spot CVD, Coin Margined CVD and Stablecoin Margined CVD all fell with price which confirms real sell pressure
On 21 November the lows were swept
Today price tapped 2.220, the pivot level, and reacted
But we are still trading below 2.250, which means the squeeze setup is not active yet
Why the sweep matters
On Bybit around 915k Coin Margined short contracts opened into the low.
Coin Margined shorts use DOT as collateral which means when DOT rises they take a double hit.
The short loses value and their collateral also loses value.
This makes them far easier to liquidate once price reverses.
But price must reclaim the key level to trigger this effect.
THE KEY LEVELS
2.220 = the pivot
This is where price reacted
This is the 1.113 extension of the 04 November to 08 November move
This marks the completion of the downside rotation
2.250 = the trigger
This is the level price must reclaim and trade above
Above 2.250 shorts begin to go underwater
Above 2.250 the squeeze becomes active
Until $Polkadot trades above 2.250 the setup remains unconfirmed.
GAMEPLAN
Wait for two 30 minute candle closes above 2.250
This confirms the reclaim and activates the long setup
Look for a retest of the 2.240 to 2.250 zone
If buyers defend that retest it is the clean entry
As long as DOT stays below 2.250 this is only a potential setup
Falling back under 2.200 weakens the idea and requires reassessment
TARGETS IF CONFIRMED
If $Polkadot reclaims 2.250 the upside targets are:
3.675
3.877
4.063
4.327
Each level is a point to reassess momentum and structure.
FINAL VIEW
DOT swept the lows and trapped a large block of Coin Margined shorts.
The pivot at 2.220 has been touched, but the real trigger is 2.250.
Only once price reclaims and trades above 2.250 does the squeeze structure become active.
Until then it remains a potential high probability setup that requires confirmation.
Until the candles speak again,
ThetaNomad
-----------
If this helped you read the flow, drop a like and a comment
None of this is financial advice

DOT forming dual flag structure with supportDOT has formed a bullish flag on the global chart, and a similar pattern has formed more locally.
DOT's attempt to consolidate above the MA50 and MA200 was unsuccessful, but given these patterns, we are more likely to see a retest of them in the near future
Currently, we are at support at $2.668
A reversal and a breakout of the MA50 and MA200 resistance levels are more likely to occur
A move below the purple area will indicate a continuation of the downward movement
More detailed analysis, additional charts, and key levels to watch are available on our site

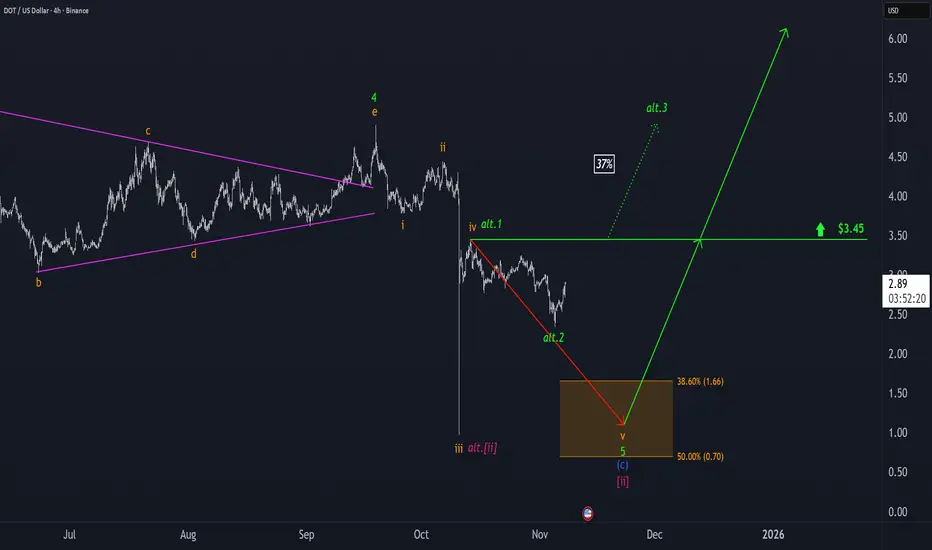
Polkadot: Ready to Bounce Straight Back Up?For now, we continue to expect that DOT will be sold off into our orange Target Zone between $1.66 and $0.70—which could offer attractive long entry opportunities – and complete magenta wave . However, we estimate there’s a 37% chance that the significant low is already in place and that the altcoin could break out directly above resistance at $3.45; in this scenario, our Target Zone would no longer be relevant.
DOT - Up or Down?Afternoon fellow traders,
So, will UP or DOWN be the destine for Polkadot?
I gotta say, whole lotta ppl shorting thinking BTC will close that gap at 111k bucks give or take, but if that were to happen, I think we could just touch the support trendline and break up, now problem is, even if it breaks upwards, it could just fake it and come back down aggressively.
Anyway, regardless of the end result, theres money to be made both ways! Take advantage!
Trade thirsty, my friends!

Polkadot: Short-Term Rally Before Potential Drop into Target ZonDOT is currently expected to move toward the high of wave iv in orange, according to our primary scenario. We continue to anticipate that this move will remain below the resistance level at $3.78. Afterward, we are primarily preparing for a wave v sell-off into the orange Target Zone ($1.66 – $0.70). In this range, we expect to see the low of wave in magenta, which should signal a potential long-term trend reversal to the upside. There is still a 30% probability that the correction low has already been completed as wave alt. in magenta. However, this alternative would only be definitively confirmed by a significant breakout above the $3.78 level.

DOTUSD Can this Channel save it from complete obsolescence?Polkadot (DOTUSD) has been trading within a Channel Down since the December 26 2022 Low and it only broke momentarily during last Friday's flash crash. Having recovered instantly above it and closing the 1W candle inside the pattern, it technically counts as a Lower Low.
The last two Lower Lows (both inside 2025), delivered rebound that hit tested the 1W MA50 (blue trend-line). As a result, the obvious technical Target on the medium-term is the 1W MA50 and our (a but more conservative) estimation is $4.600, which is right on the 0.382 Fibonacci Channel level. Of course that's assuming the market doesn't close any 1W candles below the Channel Down. The current price levels offer an excellent Risk/ Reward ratio on this.
If the 1W MA50 breaks, we can see an even more aggressive extension towards the top (Lower Highs trend-line) of the Channel Down. The best indicator for a Sell Signal in that scenario is the 1W RSI Resistance Zone. It has priced the last three major Highs since 2023. Naturally the 1W MA200 (orange trend-line) is the obvious long-term Resistance and potential Target in that scenario but can go even as high as 9.5000 if we repeat the previous +225.10% Bullish Leg.
-------------------------------------------------------------------------------
** Please LIKE 👍, FOLLOW ✅, SHARE 🙌 and COMMENT ✍ if you enjoy this idea! Also share your ideas and charts in the comments section below! This is best way to keep it relevant, support us, keep the content here free and allow the idea to reach as many people as possible. **
-------------------------------------------------------------------------------
💸💸💸💸💸💸
👇 👇 👇 👇 👇 👇

$DOT \ PolkadotCRYPTOCAP:DOT \ Polkadot 🔃
Polkadot has been accumulating for a long time in both USD and CRYPTOCAP:BTC pairs and is gathering strength above the demand zone.
With the RSI supporting this movement, DOT is preparing for a new upward phase. The sleeping giant, which has been quiet for a long time, seems to be waking up soon.

Can DOT/USDT Sustain Its Bullish Momentum This Week?🎯 DOT/USDT: The Kijun Breakout Heist 💎 | Swing/Day Trade Setup
📊 Market Overview: POLKADOT vs TETHER
The DOT/USDT pair is flashing some serious bullish signals, and this setup is looking too good to ignore! We've got a Kijun moving average breakout brewing alongside a CCI momentum oscillator golden cross — the kind of technical alignment that makes traders smile. 😏
🎯 The "Thief Strategy" Game Plan
Trading Style: Swing/Day Trade Hybrid
Bias: BULLISH 🚀
Confirmation: Kijun MA breakout + CCI golden cross momentum surge
💰 Entry Strategy: The Layered Limit Order Approach
Here's where it gets interesting. Instead of market buying like a rookie, we're using multiple limit orders (the "layering strategy") to scale into this position like professionals:
Suggested Entry Layers:
🎯 Layer 1: $4.150
🎯 Layer 2: $4.200
🎯 Layer 3: $4.250
You can add more layers based on your position size and risk appetite. The beauty of layering? You average into the move instead of gambling on one entry!
🛡️ Risk Management Zone
Stop Loss: $4.050 🚨
⚠️ IMPORTANT DISCLAIMER:
Dear Ladies & Gentlemen (Thief OG's) — this is MY stop loss level based on MY analysis. You are NOT obligated to use this level. Trading is YOUR responsibility, YOUR risk, YOUR reward. Set YOUR own stop loss based on YOUR risk tolerance. Manage your money, take your profits, and protect your capital at your own discretion.
🎯 Profit Target: Know When to Exit the Heist
Target Zone: $4.600 💰
This target aligns with:
Strong historical resistance
Overbought RSI/CCI conditions (potential trap zone)
Natural profit-taking area
🚨 Exit Strategy Reminder:
Dear Ladies & Gentlemen (Thief OG's) — this is MY target based on MY technical analysis. You are NOT required to follow this target. Take profits when YOU feel comfortable. Lock in gains, scale out, or let it ride — it's YOUR choice and YOUR capital. Make money, then take money at your own risk.
🔍 Key Technical Indicators Breakdown
✅ Kijun Moving Average: Bullish breakout confirmed
✅ CCI Momentum Oscillator: Golden cross formation (bullish momentum shift)
✅ Price Action: Higher lows forming, trend structure improving
✅ Volume Profile: Increasing buying pressure on breakout levels
💎 Related Pairs to Watch (Correlation Play)
Keep an eye on these correlated assets for confluence:
CRYPTOCAP:DOT Dominance — Overall Polkadot ecosystem strength
$KSM/USDT (Kusama) — Polkadot's canary network, often moves in tandem
$ATOM/USDT (Cosmos) — Similar interoperability narrative
$AVAX/USDT (Avalanche) — Competes in similar L1 smart contract space
$BTC/USDT — King Crypto correlation; DOT typically follows BTC trend direction
$ETH/USDT — Ethereum's strength often lifts altcoins including DOT
Why watch these? If CRYPTOCAP:DOT rallies while CRYPTOCAP:BTC and CRYPTOCAP:ETH consolidate, that's relative strength — a bullish divergence. If ASX:KSM pumps, CRYPTOCAP:DOT often follows. Smart traders watch the whole ecosystem, not just one chart! 👀
🧠 Final Thoughts: Trade Smart, Not Hard
This setup combines:
📈 Momentum confirmation (CCI golden cross)
📊 Trend confirmation (Kijun breakout)
💰 Smart entry execution (layered limits)
🛡️ Defined risk (clear stop loss)
🎯 Clear target (resistance + overbought zone)
The "Thief Strategy" isn't about greed — it's about stealing profits from the market with precision and discipline. Layer in, manage risk, and take profits when the market gives them to you. 💼
📌 Disclaimer
⚠️ This is the "Thief Style" trading strategy — for educational and entertainment purposes only. This analysis is NOT financial advice. Trading crypto carries substantial risk of loss. The "Thief" approach is a fun, stylish way to describe disciplined layered entries, but YOU are responsible for your own trading decisions, risk management, and capital. Trade what you can afford to lose. Do your own research (DYOR).
Not a registered financial advisor. Just a chart enthusiast sharing ideas. 🎨📊
✨ If you find value in my analysis, a 👍 and 🚀 boost is much appreciated — it helps me share more setups with the community!
#DOTUSDT #DOT #Polkadot #CryptoTrading #SwingTrading #DayTrading #TechnicalAnalysis #CCIOscillator #KijunBreakout #CryptoSignals #AltcoinSetup #LayeredEntry #RiskManagement #ThiefStrategy #BullishSetup #MomentumTrading

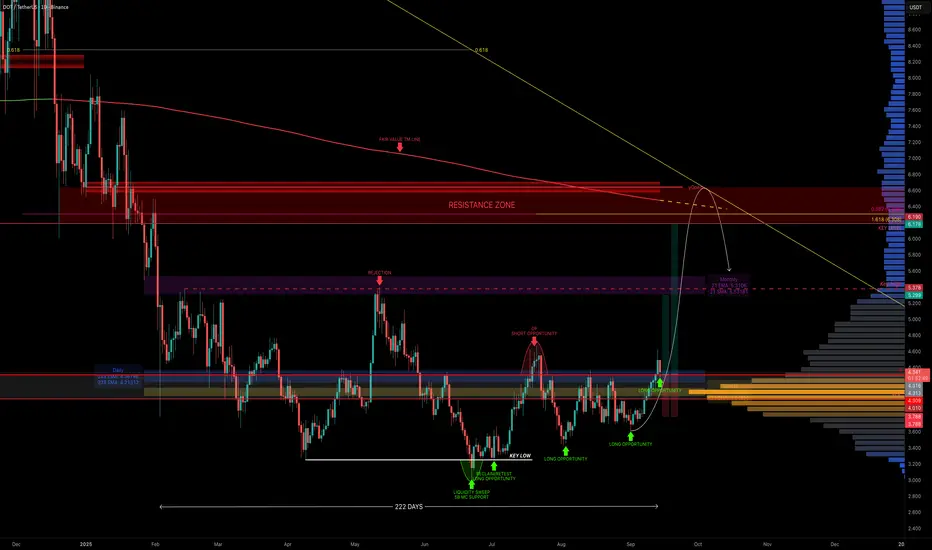
DOT — Key Levels Reclaimed, Breakout Ahead?DOT has been in sideways chop for 222 days, but things are finally getting interesting. Price is now sitting above the yearly level ($4.309), the daily 233 EMA/SMA, and the weekly 21 EMA/SMA. Even better, it reclaimed the POC of the entire 222-day range.
Why $4 Is So Important
Yearly level → $4.309
Daily 233 EMA → $4.37 / Daily 233 SMA → $4.21
Weekly 21 EMA → $4.15 / Weekly 21 SMA → $4.05
POC of 222-day range → $4
0.618 Fib retracement (current move) → $4
That’s a whole lot of support stacked at one zone.
Where It Gets Exciting (Targets)
First major target is the monthly 21 EMA/SMA ($5.3–$5.5), which also lines up with the range highs. That’s the first real test. The swing target zone sits around $6–$6.5, with multiple layers of confluence:
Key Level → ~$6
Fair Value Trend Model Line → ~$6.5
0.382 Fib retracement of the downtrend → ~$6.19
0.618 Fib speed fan → ~$6.2 (October projection)
1.618 trend-based Fib extension → $6.308
Market Cap Confluence: 10B market cap at $6.18
Yearly Open: $6.642 → the overall target and an additional layer of resistance
📌 This creates a solid resistance cluster between $6–$6.6, ideal for taking profits and potentially looking for shorts.
🟢 Long Trade Idea
Entry: Ladder longs from $4.36 down to $4
Stop: Below $4 (clear invalidation)
Take Profit: If $4 holds, DOT’s path is clear: first stop $5.3-$5.5, then $6.0–$6.6 as the macro target with the yearly open at $6.642 marking the final resistance.
Key Levels
Support → $4.36–$4
Resistance → $5.3–$5.5, then $6.2–$6.6 (10B market cap $6.18 + yearly open $6.642)
🔍 Indicators used
LuxAlgo — Liquidity Sentiment Profile (Auto-Anchored)
DriftLine — Pivot Open Zones → For identifying key yearly/monthly/weekly/daily opens that act as major S/R reference points
Multi Timeframe 8x MA Support Resistance Zones → to identify support and resistance zones such as the monthly 21 EMA/SMA.
Fair Value Trend Model → Calculates a regression-based fair value curve
➡️ Available for free. You can find it on my profile under “Scripts” and apply it directly to your charts for extra confluence when planning your trades.
_________________________________
💬 If you found this helpful, drop a like and comment!
POLKADOT TO $25Now that we know an altseason is on the way, I think this time Polkadot can break through the $10 resistance.
The next important and strong resistance is at $25, which is a resistance area and the 0.702 of the Fibonacci.

WHAT GOES UP, MUST COME DOWN – $DOT DUMP TIME?In my last analysis we nailed the move: CRYPTOCAP:DOT pumped to sweep the weak 14 Aug high exactly as projected. ✅ That mission is complete – now it’s time for the other side of the trade.
Analysis
14 Aug high swept → equilibrium reached.
Price in HTF Golden Pocket + strong Fib cluster.
Bearish harmonic + hidden bear div on CVD.
Orderflow: longs piling in, OI ↑ but price stuck → squeeze risk.
Likely SFP around $4.65 (take out Sept 13 high) → then dump.
First target: $3.75.
DOT USD at the bottomDOT is at the bottom where the Wyckoff Accumulation Pattern was formed and it is in the final stages and I expect to start rising from these levels. The first target will be the top of the pattern at a price of $10. Breaking the top will open the way to the distant targets. I note that a huge limit has been set by Polkadot DAO on the network, as the total supply of tokens that will be minted has been changed. A ceiling has been set for it at 2.1 billion DOTs , unlike what was previously there was no ceiling, as the number of tokens was be around 5billion DOT in the year 2050.
Long-term targets:
22$
36$
60$
90$
140$

DOT/USDT has not made a new all-time high in the current cycle.In my opinion, in this cycle, considering the end of the trend and the fact that it hasn’t formed a proper bottom, we are unlikely to see a new high. However, we could reach the 50% or 68% retracement levels of the previous decline and start the first impulsive wave. This movement is similar to what XRP experienced in the previous cycle.
Polkadot: Rally Gains MomentumPolkadot’s DOT token has posted impressive gains recently. We primarily attribute this rally to wave iii in orange, which appears poised to break decisively above the $4.68 resistance level. At the same time, we see a 30% chance that a new correction low could still develop within the green alternative Target Zone between $3.22 and $2.31.

DOT — September 01, 2025.CRYPTOCAP:DOT #Polkadot — September 01, 2025.
Good ol' Polkadot is trading sideways on the daily chart and has hit the Long Max Pain level. I think this is a solid spot entry point with a potential for a +15% move.
Entry price: $3.612 - $3.650
Take Profit: $4.160 (+15.18%)
➖➖➖
Short Max Pain = $4.160
Long Max Pain = $3.612

Polkadot Holds Key Support - Analysts See Toward $23 Long-TermThe price has reacted positively to a key weekly support zone, which has prevented further downside movement. As seen on the chart, the latest pivot low is higher than the previous pivot low, and the resistance that had created the lowest low was unsuccessfully broken once.
taken together, these signals suggest the beginning of a bullish trend that could provide solid returns for investors.
Price targets:
> $5.40
> $6-7
> $9
> $11
if the $10-11 resistance zone will get broken, the price has the potential to reach $23 an ultimately $49 -- although these two targets are currently considered long-term and less attainable in the near future.
This analysis reflects personal opinion and is not financial advise.

Polkadot Dot usdt daily analysis
Time frame hourly
Risk rewards ratio =1.75
Target = 4.33 $
I expected the price to drop to $3.67 and then rise.
Now, in the short term, I’m opening a position with low risk. If this position gets closed, we’ll have to see whether the price breaks the green trendline or continues fluctuating between these two lines.
