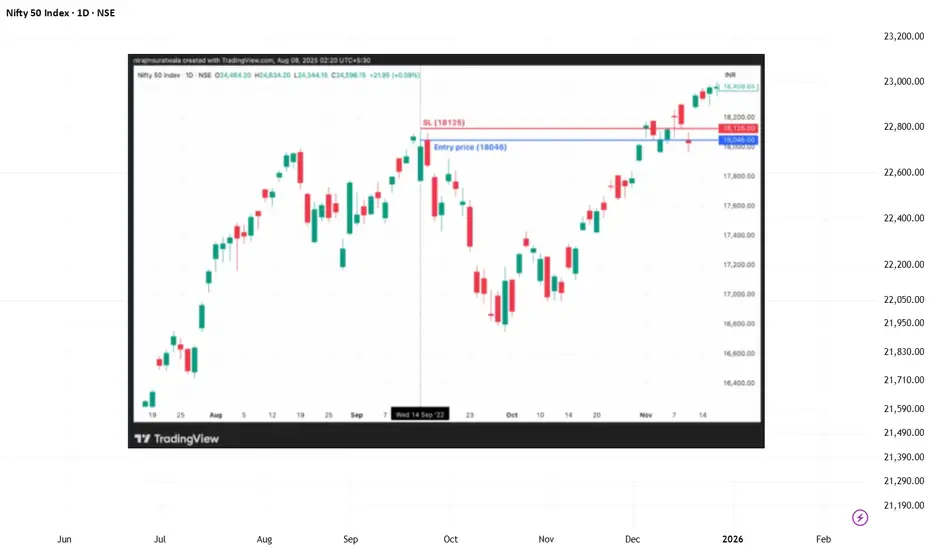
NIFTY 50 | Price–Time Exhaustion Zone Study (September 2022)This idea presents a historical market structure study based on WD Gann’s price–time principles, focusing on how downside pressure often pauses near exhaustion zones.
⚠️ This post is not a trading signal and is shared strictly for educational purposes.
📌 Context of the Study
By late September 2022, NIFTY was still under downside pressure.
However, price–time symmetry and vibration balance suggested that the decline was approaching a temporary pause zone, rather than an immediate trend reversal.
The key observations were:
Downside momentum was losing balance
A pause or consolidation phase was statistically more likely
Blind buying without confirmation carried higher risk
Sustainable moves require price confirmation after pressure release
📊 What the Chart Illustrates
A well-defined downside pressure zone
Price reaction near a time-aligned level
Market stabilization following pressure exhaustion
How markets often pause before clarity emerges, not at emotional extremes
🧠 Educational Takeaways
Markets respond to pressure zones created by price and time
Not every pause is a reversal — structure comes first
WD Gann analysis emphasizes patience and confirmation
Studying completed structures improves future decision-making
⚠️ Disclaimer
This analysis is shared for educational and research purposes only and does not constitute financial advice.
Positional

NIFTY 50 | Vibration-Based Reversal Zone Study (September 2022)This idea shares a historical market structure study based on WD Gann’s Law of Vibration, focusing on how specific price zones become sensitive when vibration balance shifts.
⚠️ This is not a trade recommendation or signal.
The post is shared strictly for educational purposes.
📌 Study Background
In mid-September 2022, NIFTY reached a price region where vibration alignment and structural symmetry became more relevant than short-term momentum.
Rather than reacting to price movement, this study observes:
Pre-defined vibration-sensitive zones
Market behavior near structural extremes
How reversals often occur when vibration conditions change
📊 What the Chart Demonstrates
A clearly defined resistance zone
A time-aligned price reaction
Expansion in volatility following vibration shift
How markets often move after internal balance changes, not news events
🧠 Educational Takeaways
Vibration governs when reversals become possible
Price reacts only after internal conditions shift
WD Gann analysis focuses on structure and balance
Studying completed cycles helps understand future behavior
⚠️ Disclaimer
This analysis is shared for educational and research purposes only and should not be considered financial advice.
NIFTY 50 | Natural Time Cycle Observation (Jan–Mar 2023) WD GannThis post presents a historical market study focusing on time-cycle behavior in NIFTY, using concepts derived from WD Gann’s Natural Time Cycle and Vibration framework.
⚠️ This is not a trading signal or forecast.
Shared strictly for educational and analytical purposes.
📌 Study Context
During mid-January 2023, NIFTY entered a period where time symmetry and vibration balance became more relevant than short-term price movement.
Instead of forecasting direction, this study focuses on:
Time windows
Structural reference levels
Volatility expansion zones
📊 What the Chart Illustrates
A clearly defined reference low
A broader time window extending into late March
How markets often resolve trends near time-cycle completion
Price reaction occurring after time alignment, not before
🧠 Key Educational Observations
Time plays a leading role; price responds later
Natural cycles often define when movement expands, not how
Gann analysis emphasizes market structure, not prediction
Studying completed cycles improves contextual market understanding
⚠️ Disclaimer
This content is for educational purposes only and does not constitute financial advice or a trading recommendation.

NIFTY 50 | Time & Price Interaction Study (26 Nov 2022)This idea presents a historical study of how time-based pressure zones can interact with important price levels, using concepts derived from WD Gann methodology.
⚠️ This is not a trading signal or forecast.
It is shared purely for educational and structural study purposes.
📌 Study Background
In late November 2022, NIFTY was trading near an important reference low formed around 26 November.
This study observes how markets often respond when time alignment and price structure intersect
.
📊 What the Chart Shows
A clearly defined reference price zone
Subsequent increase in volatility once price closed below that zone
Expansion in directional movement after time–price imbalance
How pressure zones often act as decision points, not guarantees
🧠 Key Learning Takeaways
Time-based levels often define risk zones, not direction
Price behavior changes when pressure builds near reference dates
WD Gann analysis focuses on structure and balance
Studying past cycles helps traders understand market behavior, not predict outcomes
⚠️ Disclaimer
This content is for educational and research purposes only.
It does not constitute financial advice or market recommendations.

Review and plan for 10th February 2026 Nifty future and banknifty future analysis and intraday plan.
Quarterly results-
This video is for information/education purpose only. you are 100% responsible for any actions you take by reading/viewing this post.
please consult your financial advisor before taking any action.
----Vinaykumar hiremath, CMT

NIFTY 50 | Time-Based Market Structure Study (Oct–Dec 2022)This idea shares a historical, educational study of how time-based market structure can be analyzed using principles derived from WD Gann methodology.
⚠️ This is not a forecast or trade call.
It is a post-event structural study for learning purposes only.
📌 Study Context
During October 2022, NIFTY was in a corrective phase with strong bearish sentiment.
Instead of focusing on momentum or news, this study highlights how time exhaustion and structural balance can be observed on the chart.
📊 What the Chart Demonstrates
A time zone where selling pressure began to lose effectiveness
Price behavior shifting from impulse decline to consolidation
How markets often pause or reverse when time symmetry completes
A subsequent time window where expansion stalled again
This study focuses on how time influences structure, not on predicting future market movement.
🧠 Key Learning Points
Markets often change behavior after time completion, not price extremes
Time-based analysis helps identify risk zones, not certainty
WD Gann methods emphasize structure and balance, not directional bias
Studying past cycles improves contextual understanding
⚠️ Disclaimer
This content is shared strictly for educational and research purposes.
It does not constitute investment advice, recommendations, or forecasts.

NIFTY 50 | Price–Time Square Structure Study (May 2023)This idea shares a historical chart study explaining how Price–Time Square alignment can be observed in NIFTY using classical WD Gann methodology.
⚠️ This is a chart study for educational purposes only, not a forecast or trading recommendation.
📌 Concept Overview
WD Gann’s Price–Time Square concept focuses on:
Balance between price movement and time progression
Structural symmetry rather than indicators
Understanding when markets remain within a valid structural window
During May 2023, NIFTY was in an ongoing trend phase where price acceptance within a defined structure could be observed.
📊 What This Chart Demonstrates
A key structural price zone derived from price–time alignment
The importance of closing-basis support validation
How price behaved inside the projected structure during the period
The chart is shared only to demonstrate how structure is studied, not to suggest future direction.
🧠 Learning Insights
Price–Time Square works on mathematical balance, not prediction
Time windows help define structural validity
Trend continuation often depends on support acceptance, not momentum
Historical chart studies improve contextual market reading
⚠️ Disclaimer
This idea is intended purely for education and research.
It does not constitute financial advice or market forecasting.
NIFTY 50 | Price–Time Support Reaction Study (June 2023)This idea presents a historical, educational chart study demonstrating how price–time structure can be analysed using classical WD Gann methodology.
⚠️ This is not a trade call, prediction, or investment advice.
📌 Market Background
In late June 2023, Nifty was trading near a previous structural price zone while broader sentiment remained cautious.
From a WD Gann perspective:
Markets respond to pre-defined structural price levels
Time plays a crucial role in validating support acceptance
Strong trends often originate from well-aligned price–time zones
📊 What the Chart Illustrates
The chart highlights:
A key reference support area derived from Gann structure
Price behaviour around this zone over multiple sessions
A subsequent price expansion phase after support validation
This study is shared to explain how structure is observed, not to suggest trades.
🧠 Educational Takeaways
WD Gann analysis focuses on structure first, direction later
Support is validated through time + price behavior, not emotion
Strong directional moves often begin from compressed structures
Studying historical reactions improves future risk awareness
This idea is meant purely for learning and methodological understanding.
⚠️ Disclaimer
This idea is posted for educational purposes only.
It does not constitute financial advice or future market recommendations.

NIFTY 50 | Price–Time Expansion Study (June 2023)This idea is a historical and educational analysis of how price–time structure can be studied using classical WD Gann principles.
⚠️ This is not a prediction, trade call, or investment advice.
📌 Market Context
During early June 2023, Nifty was consolidating after a prior advance while market participants were debating the possibility of a deeper correction.
From a WD Gann perspective:
Corrections are validated only after price completes its structural levels
Time symmetry plays a critical role in determining whether price pauses or expands
Markets often expand before correcting, not the other way around
📈 What the Chart Demonstrates
The chart highlights:
Key reference price zones derived from Gann structure
Areas where price acceptance vs rejection can be observed
A continued price expansion phase following structural confirmation
This study is shared to explain how price–time alignment can be analysed objectively, without relying on sentiment or news.
🧠 Key Learning Takeaways
WD Gann analysis focuses on structure before expectation
Time is used to validate price behavior, not force conclusions
Higher prices are often a result of unfinished price-time expansion
Studying completed moves helps improve future risk discipline
This post focuses on methodology and learning, not outcomes.
⚠️ Disclaimer
This idea is published strictly for educational purposes only.
It does not represent financial advice, future forecasts, or trading recommendations.

Nifty 50 | Long-Term Gann Percentage StructureThis idea shares a historical, educational study on how percentage expansion and time–price structure, as described in classical WD Gann methodology, appeared on the Nifty 50 index.
The purpose of this post is to study market structure, not to provide predictions or trading advice.
📌 Structural Background
In April 2023, Nifty formed a major swing low on the daily timeframe.
From a Gann perspective, long-term market movements often unfold through:
Mathematical percentage relationships
Major swing reference points
Time symmetry across trends
One commonly studied expansion in Gann work is the 32% proportional move from a major base.
📈 What the Chart Demonstrates
The chart highlights:
A clearly defined major low acting as a structural anchor
A percentage-based projection zone derived mathematically
Price movement unfolding gradually toward that zone over time
Respect for proportional expansion rather than random movement
This example shows how markets often react to mathematical proportions over longer horizons
.
🧠 Key Learning Points
This case study reinforces several timeless Gann concepts:
Large trends often respect fixed mathematical proportions
Important levels emerge from structure, not speculation
Time and patience play a critical role in trend development
Studying completed structures improves future market understanding
The focus is not accuracy, but process and discipline in analysis.
⚠ Disclaimer
This idea is shared strictly for educational and research purposes.
It does not constitute financial advice, recommendations, or live market calls.

Nifty 50 | Gann Time–Price Interaction June 2024 (Educational)This idea presents a historical, educational case study on how Gann Natural Time Cycles (NTC) and price levels interacted on Nifty 50 during early June 2024.
It is shared strictly for learning and structural understanding, not as trading advice or a forward-looking forecast.
📌 Market Context (Historical)
During the first week of June 2024, Nifty was approaching an important time window derived from classical WD Gann Natural Time Cycle calculations.
At the same time, a key horizontal price level was acting as a reference zone on the chart.
This created a time–price convergence, which is a core concept in Gann methodology.
📈 What the Chart Illustrates
From an observational perspective:
Price approached a clearly defined Gann reference level
The market showed increased activity near that zone
After interaction with the level, price expanded upward
This behavior highlights how time alignment can influence market reaction around important price areas
Rather than focusing on prediction, the chart demonstrates how markets often respond when both time and price align.
🧠 Educational Takeaways
This case study reinforces key Gann principles:
Time is as important as price
Levels act as decision zones, not guarantees
Confirmation comes from price behavior after interaction
Discipline means observing structure, not anticipating outcomes
Studying such examples helps traders develop process-based thinking instead of emotional decision-making.
⚠ Disclaimer
This idea is for educational purposes only.
It does not constitute financial advice, recommendations, or live trading calls.

Understanding Gann Pressure Dates & Solar Calculations Nifty 50 Time has always been a critical element in W.D. Gann’s work.
This idea is a historical and educational case study explaining how Gann Pressure Dates and Solar Calculations were observed on Nifty 50 during 2021–2022.
Rather than forecasting or predicting outcomes, the focus here is on how time-based levels are derived and interpreted.
🔭 Concept Explained (Educational)
One component of Gann’s time analysis is Solar Calculation, where astronomical degrees are converted into market time.
A commonly used conversion is:
365 days ÷ 360 degrees ≈ 1.014
This factor is applied to key angular values such as:
30°
45°
60°
90°
120°
When these time intervals are added to a major swing high or swing low, they often highlight dates where the market becomes time-sensitive.
📅 Nifty 50: 2021–22 Time Observation
In this historical example:
A significant swing high formed in October 2021
Solar time calculations highlighted multiple calendar dates
Several of these dates aligned with visible changes in market behaviour
These dates are often referred to as “Pressure Dates” — periods where volatility, trend change, or acceleration may occur.
🧠 How These Dates Are Interpreted
A simple observational framework used in Gann studies:
Allow the level candle to close
If the next session closes above the level candle’s high → strength may be present
If the next session closes below the level candle’s low → weakness may be present
If a date falls on a market holiday, the nearest trading session is observed instead
This approach encourages discipline and patience, rather than emotional reactions.
📌 Key Learning
This case study highlights:
The role of time symmetry in market structure
Why Gann emphasised time before price
How historical charts can be studied for repeatable behaviour
Why time cycles should always be combined with price structure
Disclaimer:
This content is shared strictly for educational and analytical purposes only.
It does not constitute trading advice or future market prediction.

Nifty 50 | Gann Law of Vibration – March–April 2023 (EducationalW.D. Gann emphasized that time governs market movement, often more decisively than price alone.
This idea presents an educational, historical case study explaining how Gann’s Law of Vibration was applied to Nifty 50 during March–April 2023.
🧭 Concept Overview
The Law of Vibration studies:
Time intervals
Market rhythm & repetition
Synchronisation between time and price
Natural cycles governing trend expansion and contraction
It does not guarantee outcomes, but helps identify periods of heightened market sensitivity.
📅 Historical Time-Window Observation
In mid-March 2023, a specific time window was analysed using vibration principles and calendar harmonics.
Key aspects studied:
Time symmetry from prior swing points
Cycle alignment after a corrective phase
Relationship between elapsed time and market structure
📊 Post-Event Market Behaviour
Following this observed time window:
Market momentum shifted noticeably
Price expansion followed after time completion
Directional follow-through aligned with time-cycle expectations
This reinforces a core Gann principle:
“Price follows time — when time is fulfilled, price responds.”
🧠 Educational Takeaway
This case study demonstrates:
How time-based analysis is conducted
Why time windows are observed, not predicted
How traders can prepare mentally instead of reacting emotionally
Why time must be combined with structure and price action
📌 Important Note
This idea is shared strictly for:
Educational study
Historical analysis
Understanding time-cycle behaviour
It does not include:
Trade recommendations
Future projections
Performance claims
Disclaimer:
This content is for educational and analytical purposes only.
It does not constitute financial advice or trading recommendations.

Natural Time Cycle (NTC) & Gann Pressure Dates – March 2024 Markets often react not only to price levels, but also to time-based cycles.
This idea presents an educational case study of how Natural Time Cycle (NTC) dates, also known as Gann Pressure Dates, aligned with market behavior during March 2024.
⏳ Understanding Natural Time Cycle Dates
Natural Time Cycles are time reference points derived from:
Calendar harmonics
Market rhythm & symmetry
Gann’s Law of Vibration
Time–price relationship principles
These dates are not directional signals.
They are used to observe periods when market sensitivity often increases.
📅 March 2024 – Time Cycle Observations
The following Natural Time Cycle dates were studied for March 2024:
6 & 8 March → Since 8 March was a non-trading day, the nearest active session was observed
20 March → Regular trading session
23 & 24 March → Weekend dates, with the prior trading session observed
These adjustments follow standard time-cycle alignment practices used in historical Gann studies.
📊 Market Behaviour (Post-Event Observation)
After these time references:
Market structure showed a clear change in momentum
Volatility expanded near the observed dates
A notable shift in trend behaviour occurred later in April, aligning with time-cycle symmetry
This highlights how time often acts as a trigger, while price confirms the structure.
🧠 Why This Matters
W.D. Gann emphasized that:
“Time is the most important factor in determining market movements.”
Natural Time Cycles help traders:
Prepare mentally for potential changes
Avoid emotional decision-making
Combine time with price & structure, instead of relying on price alone
📌 Educational Note
This study is shared strictly to explain:
How time cycles are observed
How non-trading dates are adjusted
How time and price interact in real markets
Disclaimer:
This content is for educational and analytical purposes only.
It does not constitute financial advice, trade recommendations, or future predictions.

DABUR INDIA | Gann Square of 9 – 45° Reaction | 28 Mar 2022This idea presents a historical intraday case study demonstrating the application of WD Gann’s Square of 9 (Normal Case) to observe structured price behavior.
On 28 March 2022, Dabur India Ltd began the session from a calculated 0° reference level and moved lower in a controlled manner before reacting from a key geometric zone.
📐 Gann Degree Levels
0° Level: ₹524.15
45° Level: ₹513
⏱️ Time–Price Observation
Price declined from the 0° level and reached the 45° level before 2:30 PM, satisfying the classical Gann “Normal Case” condition.
At the 45° zone:
Price showed stabilization
Downside momentum slowed
A clear upward reaction followed
Throughout the session, the day’s range remained contained within the 45° structure, confirming a balanced intraday movement without extension toward the 90° level.
🧠 Key Insight
This session illustrates how:
45° rotations often act as primary reaction zones
Time confirmation enhances level reliability
Gann’s geometric structure helps filter emotional decision-making
📌 Conclusion
The Gann Square of 9 offers a rule-based framework for understanding intraday market structure by aligning price movement with time symmetry, rather than relying on random indicators.
Disclaimer:
This idea is shared strictly for educational and analytical purposes only. It is not a trading recommendation or investment advice.

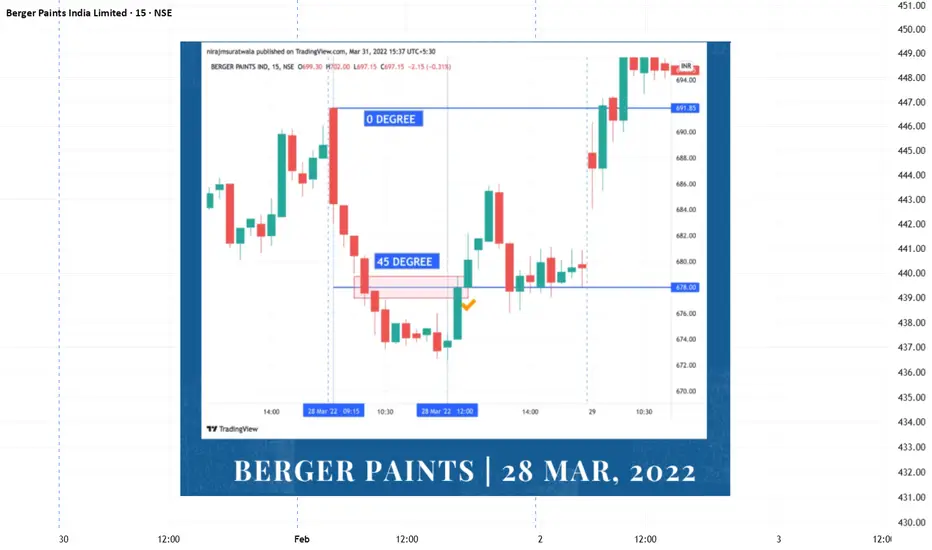
BERGER PAINTS | Gann Square of 9 – 45° Reaction | 28 Mar 2022This idea shares a historical intraday case study demonstrating how the Gann Square of 9 (Normal Case) can be used to observe price reactions at geometric levels.
On 28 March 2022, Berger Paints Ltd displayed a structured intraday decline followed by a precise reaction from a calculated Gann degree level.
📐 Gann Degree Reference
0° Level: ₹691.85
45° Level: ₹678
⏱️ Price & Time Behavior
After opening below the 0° reference, price moved lower and reached the 45° level before 2:30 PM.
At this 45° zone, the market showed a clear stabilization and reversal, respecting the classical Gann “Normal Case” time–price relationship.
For the remainder of the session:
Price remained contained within the 45° range
Intraday volatility stayed balanced
No extension toward the 90° level occurred
🧠 Key Observation
This session highlights how:
45° levels can act as primary reaction zones
Time validation increases the reliability of price levels
Range-bound days can still offer structured intraday behavior
📌 Conclusion
The Gann Square of 9 provides a disciplined framework to analyze intraday market structure, helping traders focus on measurable price–time relationships rather than subjective interpretation.
Disclaimer:
This idea is shared strictly for educational and analytical purposes only. It does not constitute investment or trading advice.
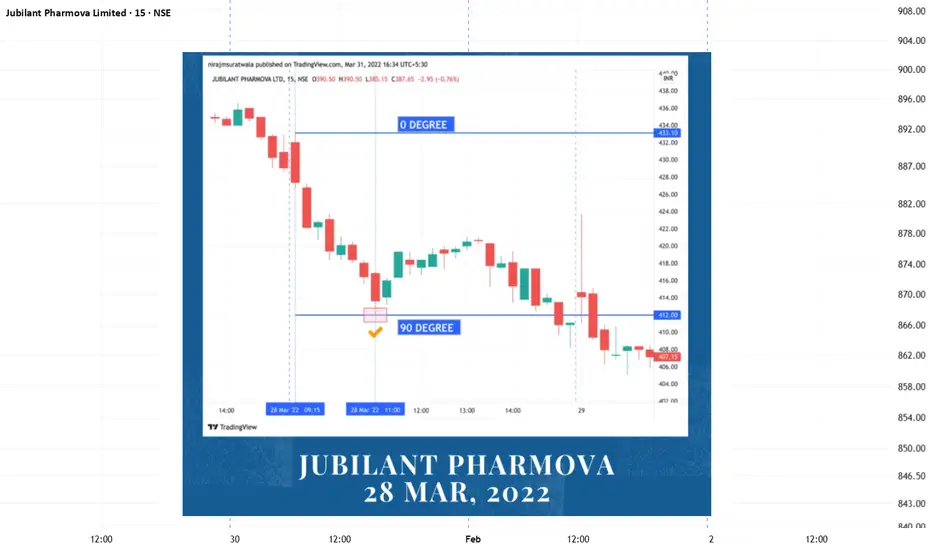
JUBILANT PHARMOVA | Gann Square of 9 – 90° Reaction | 28 Mar 202This post presents a historical intraday case study illustrating how the Gann Square of 9 (Normal Case) can be used to study price reactions through geometric levels.
On 28 March 2022, Jubilant Pharmova Ltd showed a structured intraday move where price respected predefined Gann degree levels derived from the Square of 9.
📐 Gann Degree Reference
0° Level: ₹433
45° Level: ₹423
90° Level: ₹412
⏱️ Price & Time Behavior
After the initial decline from the 0° reference, price continued lower and completed the 90° distance before 2:45 PM.
At the 90° level near ₹412, the market displayed a clear reaction, temporarily stabilizing and bouncing from this mathematically derived zone.
In classical Gann intraday studies:
45° and 90° levels act as balance points
Time plays a critical role in validating reactions
Moves often remain contained within calculated degree ranges
🧠 Key Observation
This session demonstrated how:
Price respects predefined geometric boundaries
Intraday volatility becomes structured when viewed through angles
Reactions occur due to price–time alignment, not randomness
📌 Conclusion
The Gann Square of 9 offers a rule-based framework to observe intraday market behavior with clarity and discipline, allowing traders to focus on reaction zones rather than prediction.
Disclaimer:
This idea is shared strictly for educational and analytical purposes only. It does not constitute investment or trading advice.
UNITED SPIRITS | Gann Square of 9 – 45° Reaction | 28 Mar 2022This is a historical intraday case study explaining how the Gann Square of 9 helps identify measured reaction zones using price geometry and time discipline.
On 28 March 2022, United Spirits Ltd (McDowell’s) opened with upward momentum. The intraday high near ₹891.80 was considered the 0° reference point as per the Gann Square of 9 method.
📐 Gann Degree Structure
0° (Reference Level): ₹891.80
45° (Normal Reaction Zone): ₹876
90° (Extended Move Zone): ₹861
⏱️ Price–Time Observation
Price moved lower from the 0° reference and completed the 45° distance well before 2:30 PM.
At this level, the market responded with a clear upward reaction, showing respect for the Gann geometric boundary.
According to classical Gann intraday studies:
45° levels act as equilibrium zones
Reactions at these levels often occur when price and time align harmonically
🧠 Key Learning
This case demonstrates that:
Market moves often remain contained within calculated degree ranges
Reversals emerge from mathematical structure, not randomness
Discipline comes from observing reaction, not prediction
📌 Conclusion
The Gann Square of 9 provides traders with a logical framework to analyze intraday price behavior, allowing structured decisions instead of emotional interpretation.
Disclaimer:
This idea is shared for educational and analytical purposes only. It does not constitute trading or investment advice.

M&M | Gann Square of 9 – 45° Support Reaction | 28 Mar 2022This idea presents a historical intraday case study demonstrating how the Gann Square of 9 helps identify measured reaction levels using price geometry.
On 28 March 2022, Mahindra & Mahindra Ltd showed a structured intraday move. The intraday high near ₹766.85 was treated as the 0° reference point as per the Gann Square of 9 methodology.
📐 Gann Degree Projections
0° (Base Reference): ₹766.85
45° (Normal Intraday Capacity): ₹753
90° (Extended Move Zone): ₹739
⏱️ Price–Time Behavior
Price declined steadily from the 0° level and completed the 45° distance (₹753) well within the trading session.
From this level, the stock reacted strongly upward, producing a clean intraday reversal.
As observed in classical Gann studies:
45° levels often act as dynamic support when achieved during normal intraday time
Such reactions frequently lead to directional continuation from equilibrium zones
🧠 Key Learning
This example highlights that:
Gann degree levels define logical price limits
Reversals occur at mathematically derived zones
Discipline comes from waiting for price + time alignment
📌 Conclusion
The Gann Square of 9 transforms market volatility into measurable structure.
Instead of prediction, it focuses on reaction and confirmation, helping traders stay objective and rule-based.
Disclaimer:
This idea is shared for educational and analytical purposes only. It is not a trading recommendation or investment advice.

POSITIONAL IDEA - BAJAJ CONSUMER CARE Bajaj Consumer Care , part of the Bajaj Group and a well-established player in the Indian personal care segment, is currently presenting a positional trade opportunity, supported by a strong technical setup and improving price structure.
Reasons are listed below :
The 300 zone has acted as a strong resistance and has been tested multiple times, increasing the probability of a decisive breakout
Potential breakout from a triple bottom formation
Possible breakout from a consolidation phase of more than five years
Trading above both 50-week and 200-week EMAs, indicating strength in the long-term trend
Price structure remains bullish with higher highs and higher lows
Rising volumes suggest increasing participation and accumulation
Targets - 324 // 390 // 510
Stoploss - weekly close below 230
DISCLAIMER -
Decisions to buy, sell, hold or trade in securities, commodities and other investments involve risk and are best made based on the advice of qualified financial professionals. Any trading in securities or other investments involves a risk of substantial losses. The practice of "Day Trading" involves particularly high risks and can cause you to lose substantial sums of money. Before undertaking any trading program, you should consult a qualified financial professional. Please consider carefully whether such trading is suitable for you in light of your financial condition and ability to bear financial risks. Under no circumstances shall we be liable for any loss or damage you or anyone else incurs as a result of any trading or investment activity that you or anyone else engages in based on any information or material you receive through TradingView or our services.
@visionary.growth.insights

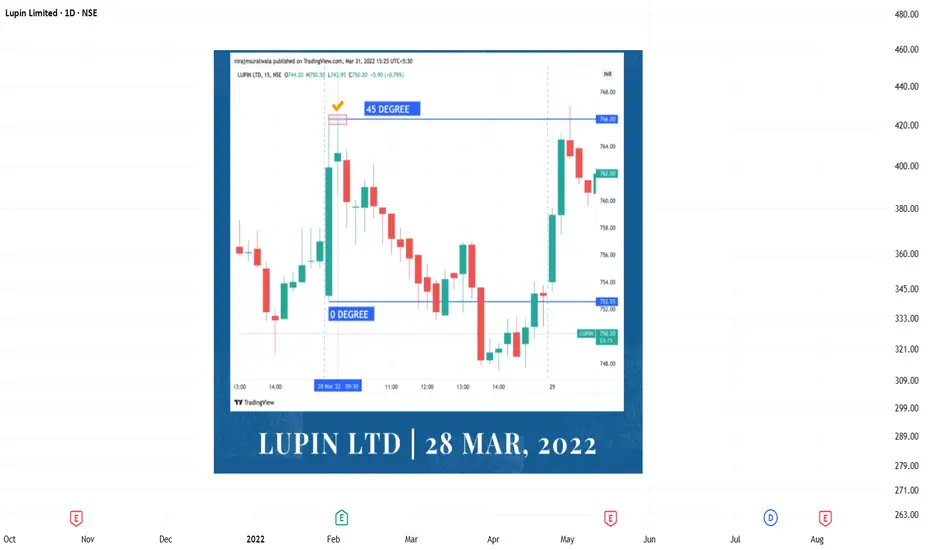
LUPIN | Gann Square of 9 – 45° Reaction Case Study | 28 Mar 2022This idea highlights a historical intraday example demonstrating how the Gann Square of 9 helps identify price exhaustion and reaction zones using geometric price levels.
On 28 March 2022, Lupin Ltd opened with a strong bullish tone. The initial intraday low near ₹752.55 was treated as the 0° reference point as per the Gann Square of 9 framework.
📐 Gann Degree Levels
0° (Base Level): ₹752.55
45° (Normal Intraday Capacity): ₹766
90° (Exceptional Move Zone): ₹780
⏱️ Price–Time Observation
During the session, price reached the 45° level (₹766) quickly and reacted precisely from that zone, followed by a clear downside movement.
As per classical Gann intraday observations:
45° reactions often act as temporary resistance when achieved early in the session
Such levels frequently produce measured pullbacks rather than continuation
🧠 Key Learning
This case study shows that:
Gann degree levels define logical intraday limits
Reactions occur at measured price points
Geometry brings structure to intraday volatility
📌 Conclusion
The Gann Square of 9 helps traders evaluate whether a move is normal or stretched. When price reacts from 45°, it signals temporary exhaustion, allowing traders to observe market behavior with clarity and discipline.
Disclaimer:
This chart is shared for educational and analytical purposes only. It is not a trading recommendation or investment advice.
WIPRO | Gann Square of 9 – 45° Support Case Study | 28 Mar 2022This idea presents a historical intraday example of how the Gann Square of 9 can be used to identify logical support levels based on price–degree relationships.
On 28 March 2022, WIPRO Ltd initiated a downward move after forming its 0° reference point near ₹609.
📐 Gann Degree Structure
0° level: 609
45° level: 597
Using the Square of 9 calculations, ₹597 emerged as the next geometric downside level.
⏱️ Price–Time Alignment (Gann Guideline)
According to classical Gann intraday observations:
Support reactions often appear when
45° is reached before 2:30 PM, or
90° is reached before 2:45 PM
In this session, price completed the 45° move within the valid time window, and a clear upward reaction followed from the ₹597 zone.
🧠 Key Learning
This case study demonstrates that:
Degree completion helps define objective support
Reversals occur from measured levels, not guesswork
Gann geometry converts price action into structured behavior
📌 Conclusion
The Gann Square of 9 offers a rule-based method to identify intraday support and resistance.
When price respects degree levels within time, reactions often become clearer and more reliable.
Disclaimer:
This chart is shared strictly for educational and analytical purposes only. It does not constitute trading or investment advice.

MGL | Gann Square of 9 – 90° Reversal Case Study | 28 Mar 2022This idea demonstrates a historical intraday example of how the Gann Square of 9 can be applied on TradingView to identify precise reversal zones using price–degree relationships.
On 28 March 2022, Mahanagar Gas Ltd (MGL) established its 0° reference point near the session high and then declined sharply.
📐 Gann Degree Structure
0° level: 766
45° level: 752
90° level: 739
Price moved decisively downward from the 0° base and completed the full 90° distance, where a strong price reaction and reversal was observed.
⏱️ Time–Price Validation (Gann Rule)
As per classical Gann intraday guidelines:
A reversal opportunity becomes valid when
45° is reached before 2:30 PM, or
90° is reached before 2:45 PM
In this session, MGL completed the 90° move within the valid time window, making the 739 zone a logical reaction area rather than a random support.
🧠 Key Learning
This case highlights how:
Degree completion confirms market readiness
Reversals emerge from mathematical structure, not indicators
Patience and rule-based execution remove emotional bias
📌 Conclusion
The Gann Square of 9 provides a structured framework for reading intraday price behavior. When price completes a degree move within time, reactions often emerge with high clarity.
Disclaimer:
This chart is shared strictly for educational and analytical purposes only. It is not a trade recommendation or investment advice.
