Cup & handle patternClear break out on charts, Its copybook pattern cup and handle pattern, Can go with a stop loss of 8% with a target of 20%+.
Auto theme doing good for the past few weeks, Happy trading.
Positional


CoforgeCoforge CMP 3908
Buy above 3930
Traget 4500/5000/6000+
Swing/Positional
Fundamentally strong company


PVRHi guys, this chart is for educational purpose only not for sale... plz do your own analysis too.. Thank Q

RVNL - POSITIONAL CALLThe stock has created strong support in the zone of 27.80 - 30.
Sustaining the same, it is most probably moving towards 42 to 52 levels in the coming months.
Type of Trade: Positional Long Call
Verdict
27.80 - 30 is a region of support.
Trades?
Buying on the dip, depending on how price action is.


Nifty FutureThis is the daily chart of Nifty Futures, and it is confusing. There are a lot of mixed signals. Let me explain:
1. The pattern looks like a breakout of the bullish ascending triangle
Bull - 1 | Bear - 0
2. Bearish divergence quite clear
Bull - 1 | Bear - 1
3. The trend is bullish (refer to the trendline)
Bull - 2 | Bear - 1
4. EMA is aligned properly (100 over 200)
Bull - 3 | Bear - 1
5. Gap between EMA and candles is uncomfortable
Bull - 3 | Bear - 2
6. RSI is quite close to the overbought zone and is resisting
Bull - 3 | Bear - 3
Ab kare toh kya kar?
Simple, wait for the right levels to go long. There is no point in trading right now. You shouldn't go against the trend which is bullish, but these are not the right or comfortable levels to buy.

SHREECEMHi guys, In this chart i Drew My Best Levels in SHREECEM for Long, Observed these Levels based on price action and Demand & Supply. Don't Take any trades based on this Post...because this chart is for educational purpose only not for Buy or Sell Recommendation.. Thank Q

Nifty futuresNifty Futures
Trend in the hourly chart is bullish so the strategy is 'buy on dips'.
We can buy at around 17500 to 17550 with SL of 17400 for targets of 17750+

POSITIONAL BREAKOUT IN #CUMMINSIND ... long tradeNSE:CUMMINSIND
>long positional trade.....
>making large rounding bottom pattern
>strict stoploss required
>plan your trade accordingly
>do your own analysis before investing
>education purpose only

I bought Castrol IndiaI bought Castrol India
Candles above 100 & 200 EMA
RSI bullish
Manual trend is bullish as well
SL 95
T1 115+ and T2 open
I think we may witness a strong up move in 3 to 6 months

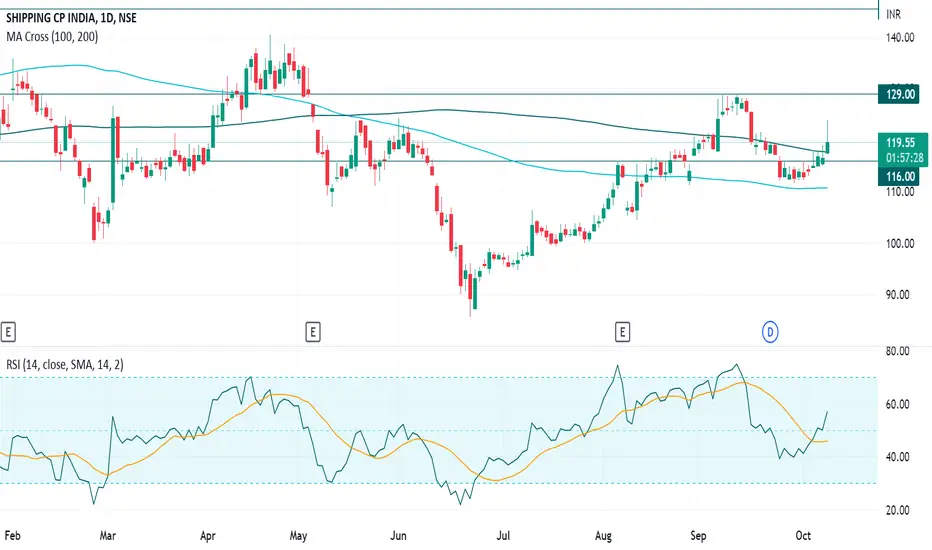
Shipping corporation of India or SCII bought SCI
Manual trend is bullish
Candle above 100 & 200 EMA
Bullish crossover in RSI
SL can be below 110
Targets above 145
Star CementI bought Star Cement
Manual trend is bullish
Bullish crossover between 100 and 200 EMA (not complete)
Bullish crossover in RSI
SL around 95
T1 115 / T2 open

IDBI BankI bought IDBI Bank
Candles comfortable above 100 and 200 EMA
Manual trend is bullish
RSI is above 50 with a bullish crossover
SL below 40
T1 50, T2 70

ManappuramI bought Manappuram
Manual trend is up
Candles are above 100 EMA
RSI is above 50
Sl below 85 with open targets

HeidelbergI bought Heidelberg
Candles crossing 200 EMA from below
RSI too has a weak but sure bullish reversal
Manual trend is up
SL below 180
Targets above 225

NIFTY is looking Bullish🤑 Nifty is likely to be Bullish till it's above 17245.
❓ Reason: Because of two consecutive candles closed above ATM Machine Target and not much far away.
🚧 Upside Hurdles: 17340, 17395, 17535.
🌈 Advice: 1.) Take reversal trade near these levels, or 2.) Wait for Breakout and Sustainability.
🟢 Positional Trend is Positive.
🟡 Long Term Trend is Neutral.
📢 Disclaimer: We are NISM Certified so we don't hold any position in Nifty Future or Options as per SEBI guidelines. Take trades as per your own technical analysis, we are just educating you. We are not using any type of indicators for finding out of levels.
🙏🏻 Come to Learn, Go to Earn🙏🏻
✅ We are NISM Certified. ✅
☔If you find us useful, Please help the helpless near you.☔
☺Happy to Help.☺
@OhoTrading

L&T FHI bought LTFH (L&T Fin Holding)
Candle above 200 EMA
Bullish crossover in RSI
Manual trend is up
SL 70
T1 90
T2 100
Positional trade

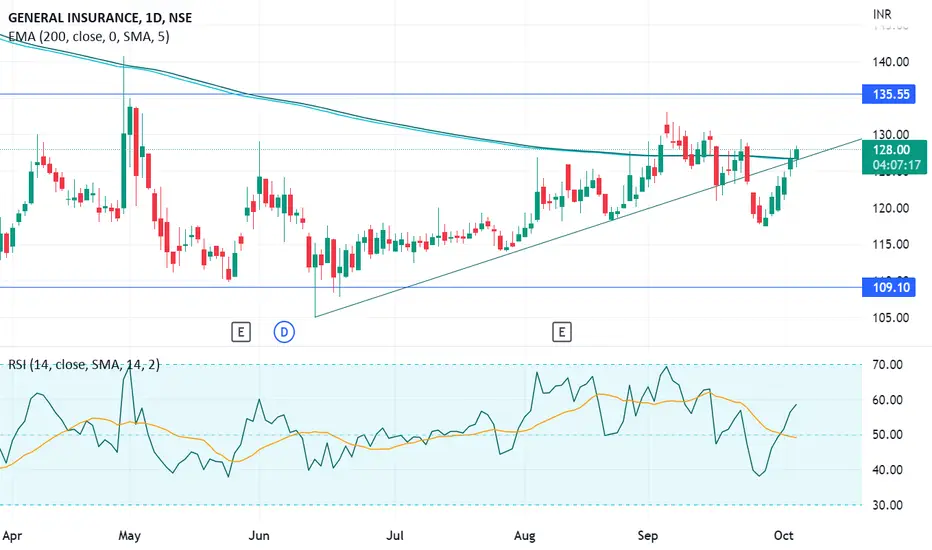
GICREI bought GICRE
Candle above 200 EMA
Manual trend is bullish
RSI has a bullish crossover.
SL 120
T1 135 / T2 170
Positional trade