TVSMOTORS Cup & Handle breakoutAuto sector is in bullish momentum considering the hype around electric vehicles and reducing steel prices.
TVSMOTOR is looking very bullish and looks like a good positional trade.
It is very close to its ATH of approx 814 and is currently on the verge of giving ATH weekly closing.
Positional

InfosysAfter giving a bit good correction, this stock may show a good move in short term, add it in your watchlist.

Anand Rathi Wealth Ltd Getting ready for a breakoutCurrently trading at 653.90
Prices consolidating above 600 levels since April 2022.
Sustaining 600 levels, it could move towards 700 to 800 levels in the coming months.

Wipro at weekly supportWipro at weekly support.
47% down from ATH.
Rsi oversold, followed by positive divergence.
Observe price action in this zone, ( 374- 408) - stock might bottom out here.


Sterling tools near its supply zoneStertools has been on a downtrend since 2018.
The stock has made a double bottom and currently at the neck line which is very strong supply zone of 250rs-260rs which coincides with 38.2% fib level.
If the stock manages to give a weekly closing above 250rs and sustains the same in the following week, we might see a big upmove in this stock.
Keep this stock in radar for a good positional trade since volumes have increased in previous few weeks

CHF/CAD FOR POSITION TRADINGHello traders. This is the CHF/CAD monthly chart. I just want to show you a potential opportunity in which long-term traders can, perhaps, establish long-term short positions. As you can see in the chart, the pair has been on an upward trend since 2007 and we can draw an upward trend line connecting exactly three touches. But the price has broken the trend line and the price is in a short-term downward trend. But be careful, we still don’t have a confirmed downward trend on the monthly chart. To confirm the downward trend on the monthly chart, we need to wait for the price to make a minimum of two lower highs and two lower lows. The first sign would be if the price breaks the most recent low of 1.2600. In that case, we would get the first lower low and more confidence regarding the bear’s long-term outlook. Of course, after that we have to wait for another lower high and lower low for confirmation and if we get this we can establish a short position. But keep in mind that this would be position trading, and in that case your stop loss would be far away, so this may not be appropriate for scalpers and day traders. Also, the realization of this scenario could take months, but it is worth monitoring. And one more thing, just because the trend line is broken doesn’t mean you should sell right now; if the higher low at 1.26 isn’t broken, we’re still in a long-term uptrend on this pair, but in a retracement mode (or sideways consolidation).
Trade safe,
Merjem

Swing & positional trading opportunities for next week (6th Jun)Here's my watchlist for The coming week. Some interesting Trading setups. Made with @AVENUESOFINVESTMENT . Which stocks are on your radar?

OFSS at multi timeframe supportThe stock is trading near-monthly and weekly price support i.e 2930-3020
Keep an eye on the price action near these levels for any bottom/reversal formation.
Bullish divergence near these levels can be seen on the daily chart.
Wait for more such positive confirmation in price action for initiating any positional trades in the stock with great RR.

SUNTECK IH&SSUNTECK making inverse head and shoulder on weekly chart. strong during nifty fall. increasing volume on uptrend. RS line taking retest. excellent RR.

Nifty Inverted triangle pattern (1 Day) Best buying Nifty will give best buying opportunity as chart shows....ready with capital to make profit ....
also like share and follow my profile for more accurate ideas.
thank you !

Investment or Swing Trade-HEGHEG is now looking attractive for Swing Trading of a bigger trend.
Buy HEG above 1109
Target -1200,1240, 1300,1400,(book half of your position and again accumulate in below level.
1580,1640,1800
SL below 1040

One Swing trading Equity Option -HEROMOTOCOHEROMOTOCO buy above 2437-2460
Target -2500, 2555. 2600, 2640, 2700
SL below 2280/ 2395 as per your risk
Better to create option strategy
Buy HERMOTOCO 2500 CALL along with Sell of 2600 CALL May Expiry
Max loss:-9000
Max. Profit:-19000

MCX LONG (Positional)Long - above 1400
If price came near 1400- 1410-1420 add quantities
Stoploss - 1350
Target - 1600 to 1640
Risk Reward - 1:3 to 1:4

HDFCLIFE - POSITIONAL CALLHDFC LIFE looks good, on all the timeframes.
We could see it closed well in the last week, forming a bull candle, that closed near its highs.
Now sustaining 560 levels, it could move towards 670 levels in the coming weeks.

Godrejcp at supportGodrej Consumer has been consolidating near support from the past few sessions.
Sustaining 750 levels, stock can move towards 900to 920 levels.

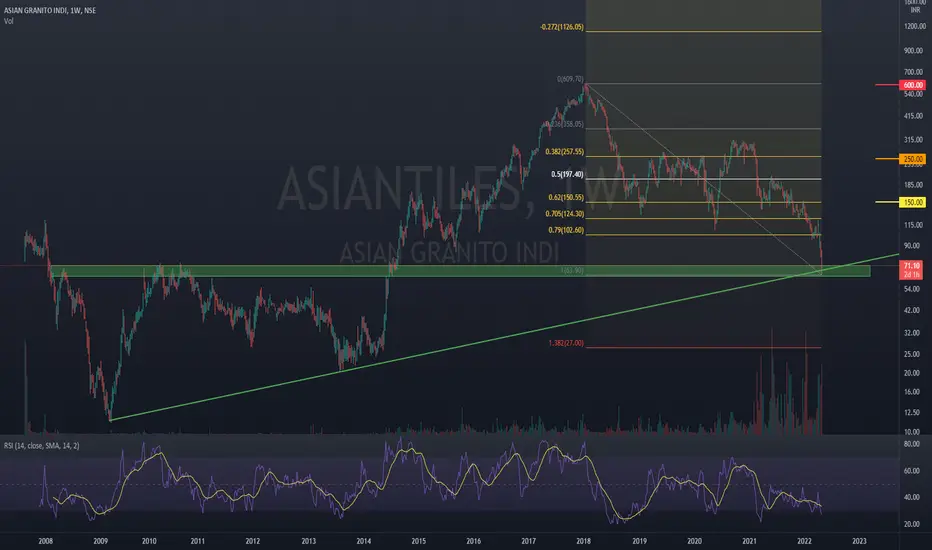
Asian Granito (A Potential Multibagger)Price bounced from long term support and also at key support level as confluence.
Turn around potential is visible fundamentally.
Accumulate at current levels for a multibagger return in long term.
Medium term swing target @ 150 (110% ROI)
Long term positional target @ 250 (255% ROI)
Long term positional target @ 600 (750% ROI) near its ATH.
Do your own research before investing in this company as promoter's holding is low.
Promoters have started increasing their holdings since DEC 2021 quarter.
Company is fund raising for various expansion plans.
I am bullish on this stock.
Peace!!
CROMPTON GREAVES - SHARK PATTERNThere is a Shark pattern formation on the weekly chart of Crompton Greaves.
The Stock has been holding the first Prz zone of the pattern for the past many weeks.
There are many ways Shark pattern can be traded, I am sharing the easiest method that I follow mostly
One can Enter a limit order to buy between the 88% and 113% retracement levels. (looks for positive price action for confirmation)
1st Prz : 370-383
2nd Prz : 330-332
Stop loss at the 127% extension of the XC leg.
SL below 310 levels
Type of trade : positional
Disclaimer : Trade at your own risk.

LT - SHARK PATTERNThere is a formation of the Shark pattern on the daily chart of the Larsen & turbo.
The first Potential Reversal Zone of the pattern is at 1625-1636.
The second PRZ stands at 1550-1560
Keep an eye on price action around these levels for catching a reversal or pullback trade.
Weekly support of the stock also coincides with this pattern, making it an important formation.

NFTUSDT Possible symmetrical triangleWhat we have here is a symmetrical triangle. we maybe super lucky and
have 2 long opportunities.
The first long would be when price drops to the lower trendline of the pattern.
long there if price makes it with minimum risk. ALWAYS USE STOP LOSS.
the second entry would be the breakout of the pattern. but we buy (BCR)
BREAKOUT,CLOSE,RE TEST. WE BUY THE RETEST OF THE BREAKOUT, in case its a fake out we take on minimum risk.
so there's the strategy. trade safe.

Apollo Hospital - Bullish - Short term Positional tradeDouble Top and Bullish Pennant Formation in Apollo Hospitals with higher mean volume at Pennant formation.
Safe Target to Rs 5060
Target as per Price action is 5091 (Fib retracement)

TWITTER - LongThe bullish impulse from May 2016 formed an Expanding Leading Diagonal for Twitter. According to Elliott Wave Theory, this pattern (occurs as Wave 1 or Wave A) usually dictates the direction of impulse - in this case, to the upside.
As long as we don't break below $13.70, all retracements are considered as Wave 2. Once Wave 2 completes, a more impulsive Wave 3 will ensue - it could already be in the works, considering we've bounced off significantly from the $30 range.
Twitter will probably see ~$140 in the coming years.

#INEOSSTYRO Very Good stock for long term. Fundamentals of stocks are good and the stock is near to give breakout soon.
ILong
