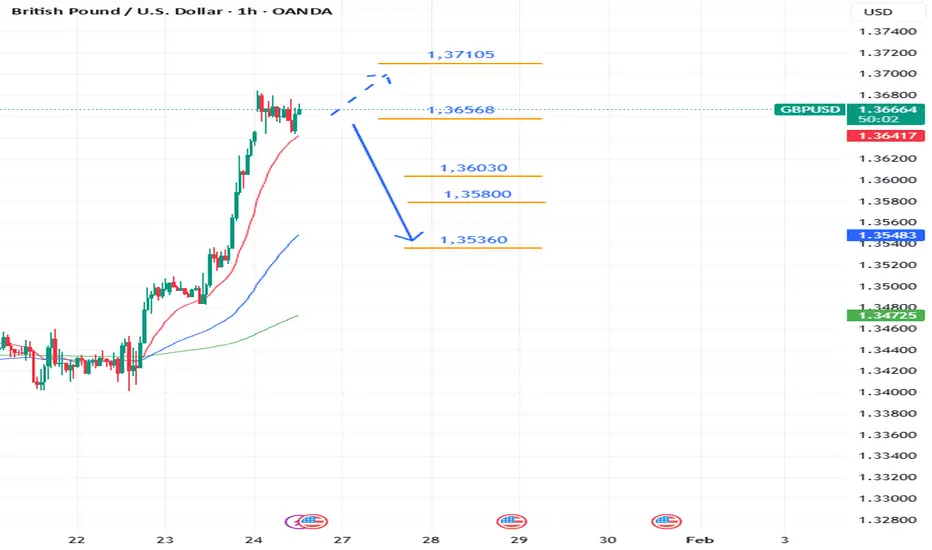
GBPUSD🔸The pound has bounced back from near the demand area last week, preventing us from entering a long trade
🔹The 4-hour chart trend is bearish and has recently hit the first supply area, giving us a sell entry opportunity
🔸As long as the 4-hour candlestick does not close above 1.35953, it is still possible to enter the trade in the red areas
🔹The first target is the blue area
Pound
Fundamental Market Analysis for September 04, 2025 GBPUSDOn Thursday, during the Asian trading session, the GBP/USD pair fell to around 1.3430. The pound sterling (GBP) is weakening against the US dollar (USD) amid concerns about the UK's financial situation.
UK Finance Minister Rachel Reeves said on Wednesday that she would present the annual budget on November 26, insisting that the economy is not “broken” and that she would control spending to help reduce inflation and borrowing costs. However, concerns about the UK's ability to control its finances are weighing on sentiment and dragging the pound down against the US dollar.
According to the US Bureau of Labor Statistics (BLS), the number of job openings on the last working day of July was 7.181 million. This figure followed 7.357 million (revised from 7.437 million) job openings recorded in June and was below the market consensus of 7.4 million.
The weakening of the UK labor market, announced on Wednesday, reinforced expectations that the Federal Reserve (Fed) will cut rates this month. This, in turn, could undermine the dollar and help limit losses for the major currency pair.
Trading recommendation: SELL 1.3400, SL 1.3450, TP 1.3300
Fundamental Market Analysis for September 01, 2025 GBPUSDThe Bank of England's (BoE) cautious rate cut last month marks a significant divergence from the growing consensus that the Federal Reserve (Fed) will cut borrowing costs at least twice before the end of this year. This, in turn, has been a key factor in the relative strength of the British pound (GBP) against the US dollar and confirms the short-term positive outlook for the GBP/USD pair.
However, the moderate rise in the US dollar (USD) could be an obstacle for the currency pair. Traders are also showing indecision and prefer to wait for important US macroeconomic data, which will be released at the beginning of the new week, to confirm the next stage of the directional movement. Therefore, it would be wise to wait for the continuation of purchases before making new bets on the rise of the GBP/USD pair and positioning for further strengthening.
Market participants are now awaiting the release of the final UK manufacturing PMI to gain some momentum amid low liquidity due to the US Labor Day holiday. Meanwhile, attention will remain focused on the closely watched US employment data to be released on Friday. The popular non-farm payrolls (NFP) report will play a key role in influencing the US dollar's price dynamics and the movement of the GBP/USD pair.
Trading recommendation: BUY 1.3555, SL 1.3485, TP 1.3665
GBPUSD🔸Last week, the pound price reacted to the specified demand range and a good profit was received if the trade was entered
🔹But the long-term trend is still down and the specified red ranges are suitable for entering a sell trade
🔸The 4-hour candle close above 1.35886 invalidates this analysis
🔹The 1.3330 range could be a good target for a sell trade
GBPUSD Technical Analysis & Trading Strategy Forecast# GBPUSD Technical Analysis & Trading Strategy Forecast - August 2025
Comprehensive Multi-Timeframe Analysis for Intraday and Swing Trading
Current Price: 1.35033 USD (as of August 30, 2025, 12:54 AM UTC+4)
24H Change: -0.08%
Market Sentiment: Bullish Bias with Cautious Optimism
---
Executive Summary
The GBPUSD pair is currently trading above the critical 1.3500 psychological level, showing resilience after the Bank of England's recent rate cut to 4% in August 2025. The GBP/USD pair gradually crawled back above the 1.3500 barrier on the renewed upside, indicating potential for continued upward momentum despite monetary policy headwinds.
Key Technical Levels:
Immediate Support: 1.3450 - 1.3485
Key Resistance: 1.3585 - 1.3620
Psychological Level: 1.3500 (currently above)
---
Market Context & Fundamental Backdrop
Recent Central Bank Actions
At its meeting ending on 6 August 2025, the MPC voted by a majority of 5–4 to reduce Bank Rate by 0.25 percentage points, to 4%. This dovish move has created mixed signals for GBP, with the median profile in the August MaPS implied a cumulative 50 basis point reduction in Bank Rate by the end of this year.
Interest Rate Differential Impact
UK Base Rate: 4.00% (recently cut from 4.25%)
Fed Funds Rate: 4.25-4.50% (unchanged)
Rate Differential: Narrowing in favor of USD
---
Multi-Methodology Technical Analysis
1. Candlestick Pattern Analysis
Current Formation: Doji reversal patterns observed on 4H timeframe
Pattern: Indecision candles near 1.3500 support
Implication: Potential for directional breakout
Confirmation Required: Volume increase on next significant move
2. Elliott Wave Theory Analysis
Wave Structure: Currently in Wave 4 corrective phase
Primary Trend: Bullish impulse from 1.2300 lows
Current Position: Corrective Wave 4 consolidation
Target Wave 5: Projected range 1.3650-1.3750
Invalidation Level: Break below 1.3380
3. Harmonic Pattern Recognition
Active Pattern: Bullish Gartley formation completing
D Point: Target zone 1.3480-1.3520
Fibonacci Levels: 0.786 retracement at 1.3485
Bullish Reversal Zone: 1.3450-1.3500
Target Extensions: 1.3585 (1.27), 1.3650 (1.618)
4. Wyckoff Market Cycle Analysis
Current Phase: Accumulation Phase C (Spring Test)
Background: Institutional accumulation near support
Volume Profile: Decreasing on declines, increasing on rallies
Smart Money: Likely accumulating between 1.3450-1.3520
Next Phase: Markup anticipated above 1.3585
5. W.D. Gann Analysis
Square of 9 Analysis:
Current Position: 1.35033 sits at 144° (important Gann angle)
Support Levels: 1.3472 (135°), 1.3434 (128°)
Resistance Levels: 1.3542 (152°), 1.3580 (160°)
Time Cycles: September 15-20 represents significant time window
Price Squaring: Next major target 1.3689 (169°)
Gann Angles from August Low:
- 1x1 Angle: 1.3520 (primary support)
- 2x1 Angle: 1.3485 (secondary support)
- 1x2 Angle: 1.3585 (resistance)
6. Ichimoku Kinko Hyo Analysis
Cloud Status: Price above Kumo on daily chart
Tenkan-Sen (9): 1.3515 (bullish above)
Kijun-Sen (26): 1.3498 (consolidating)
Senkou Span A: 1.3505 (cloud support)
Senkou Span B: 1.3480 (strong support)
Chikou Span: Above price action (bullish confirmation)
Signal: Bullish bias maintained while above cloud
---
Technical Indicators Analysis
Momentum Indicators
RSI (14-period):
- 4H: 52.3 (neutral, room to rise)
- Daily: 48.7 (approaching oversold relief)
- Weekly: 55.2 (bullish momentum intact)
MACD Analysis:
The Moving Average Convergence Divergence (MACD) for GBPUSD turned positive on August 27, 2025, suggesting renewed bullish momentum with the stock continued to rise in of 116 cases over the following month based on historical patterns.
Volatility & Price Action
Bollinger Bands (20, 2):
- Current Position: Middle band test (1.3515)
- Band Width: Contracting (low volatility environment)
- Squeeze Setup: Potential expansion coming
- Direction Bias: Bullish above middle band
VWAP Analysis:
- Daily VWAP: 1.3520 (key pivotal level)
- Weekly VWAP: 1.3485 (major support)
- Volume Profile: High volume node at 1.3500-1.3520
Moving Average Configuration
Short-term (Intraday):
- EMA 21: 1.3518 (immediate resistance)
- SMA 50: 1.3505 (support)
- WMA 13: 1.3525 (dynamic resistance)
Medium-term (Swing):
- EMA 50: 1.3490 (key support)
- SMA 100: 1.3465 (major support)
- EMA 200: 1.3420 (trend support)
---
Multi-Timeframe Trading Strategy
Intraday Trading Strategy (5M - 4H)
# Bullish Scenario (Primary - 65% Probability)
Entry Strategy:
Long Entry 1: 1.3485-1.3500 (Harmonic D-point)
Long Entry 2: 1.3520-1.3530 (breakout above VWAP)
Stop Loss: 1.3465 (below Wyckoff support)
Take Profit 1: 1.3585 (Gann resistance)
Take Profit 2: 1.3620 (Harmonic target)
Risk-Reward Ratio: 1:2.8 (Excellent)
Timeframe Specific Targets:
5M/15M: Quick scalps 1.3500 → 1.3530
30M/1H: Swing to 1.3585
4H: Extended move to 1.3620
# Bearish Scenario (Secondary - 35% Probability)
Entry Strategy:
Short Entry: 1.3465 break (Ichimoku cloud breach)
Stop Loss: 1.3510 (above VWAP)
Take Profit 1: 1.3420 (EMA 200)
Take Profit 2: 1.3380 (Elliott Wave invalidation)
Swing Trading Strategy (4H - Monthly)
# Primary Bullish Wave Count
Long-term Setup (1-3 weeks):
Entry Zone: 1.3480-1.3520 (current accumulation)
Stop Loss: 1.3420 (trend support)
Target 1: 1.3650 (Elliott Wave 5 minimum)
Target 2: 1.3750 (Wave 5 extension)
Target 3: 1.3850 (major resistance confluence)
Monthly Outlook:
- September: Consolidation 1.3450-1.3650
- October: Breakout attempt above 1.3650
- November: Potential test of 1.3750-1.3850
---
Risk Management & Trade Management
Position Sizing Guidelines
Intraday: Maximum 2% risk per trade
Swing: Maximum 3% risk per position
Portfolio Allocation: 5-8% maximum GBPUSD exposure
Dynamic Stop Loss Strategy
1. Initial Stop: Below key support levels
2. Breakeven: Move to entry after 50% target hit
3. Trailing Stop: Use ATR(14) x 2 for swing trades
4. Time Stop: Exit if no progress within 48 hours (intraday)
Bull Trap / Bear Trap Analysis
Potential Bull Trap Warning:
- Watch for fake breakout above 1.3585 with weak volume
- Confirmation needed: Volume > 20-day average
- Invalidation: Immediate reversal below 1.3550
Bear Trap Opportunity:
- Break below 1.3480 with quick recovery above 1.3500
- Entry on reclaim of 1.3500 with strong volume
- Target: 1.3585-1.3620
---
Weekly Trading Calendar & Key Events
Upcoming Market Movers (September 2-6, 2025)
High Impact Events:
Tuesday: UK PMI Final, GDP Monthly
Wednesday: US ADP Employment
Thursday: BoE Officials Speeches
Friday: US Non-Farm Payrolls
Trading Approach:
- Reduce position size 2 hours before high-impact news
- Consider flat positions during NFP release
- Re-enter on confirmed direction post-news
---
Alternative Scenarios & Contingency Plans
Scenario 1: Dovish BoE Surprise (20% Probability)
Trigger: Additional rate cut signals
Expected Move: 1.3500 → 1.3350
Strategy: Short on break of 1.3465, target 1.3380-1.3350
Scenario 2: USD Weakness Theme (25% Probability)
Trigger: Fed dovish pivot or data weakness
Expected Move: 1.3500 → 1.3750
Strategy: Aggressive long on any dip to 1.3480
Scenario 3: Risk-Off Environment (15% Probability)
Trigger: Geopolitical tensions or market crash
Expected Move: Sharp decline to 1.3200-1.3300
Strategy: Full hedging, await oversold bounce
---
Technical Rating Summary
Overall Rating: BULLISH BIAS
1-Week Outlook: BUY (Confirmed by MACD turn positive)
1-Month Outlook: BUY (Elliott Wave structure intact)
Confidence Level: 7/10
Key Catalysts for Bullish Breakout:
1. Sustained break above 1.3585 with volume
2. US economic data disappointment
3. Risk-on sentiment return
4. Technical pattern completion
Bearish Invalidation Levels:
Short-term: 1.3465
Medium-term: 1.3420
Long-term: 1.3380
---
Conclusion & Trading Recommendations
The GBPUSD pair presents a compelling bullish setup despite recent BoE dovishness. Our technical rating for GBPUSD stock is buy today with multiple technical methodologies aligning for potential upside. The convergence of Harmonic patterns, Elliott Wave projections, and Gann analysis suggests a high-probability move toward 1.3585-1.3650 over the coming weeks.
Priority Actions:
1. Immediate: Monitor for entry opportunities in 1.3485-1.3520 zone
2. Short-term: Prepare for breakout above 1.3585
3. Medium-term: Position for Elliott Wave 5 completion at 1.3650-1.3750
Risk Disclaimer: This analysis is for educational purposes only. Past performance does not guarantee future results. Always implement proper risk management and consider your risk tolerance before trading.
FTSE 100 UK100 Technical Analysis: Weekly Forecast# FTSE 100 UK100 Technical Analysis: Advanced Multi-Timeframe Trading Strategy & Weekly Forecast
Current Price: 9,191.30 (As of August 30, 2025, 11:54 AM UTC+4)
Asset Class: UK100 / FTSE 100 Index
Analysis Date: August 30, 2025
---
Executive Summary
The FTSE 100 Index (UK100) continues to demonstrate resilient performance, trading at 9,191.30 points with solid fundamental support from recent Bank of England policy accommodation. Recent market data shows the GB100 reached 9,199 points on August 29, 2025, maintaining a monthly gain of 0.68% and an impressive 9.82% year-over-year advance. Our comprehensive technical analysis reveals the index is positioned for potential continuation toward the 9,525.47 analytical target by year-end 2025, supported by dovish monetary policy and improving technical confluence across multiple timeframes.
---
Multi-Timeframe Technical Analysis
Elliott Wave Analysis
The FTSE 100 exhibits a complex corrective structure within a larger degree impulse sequence:
Primary Count: Completing Wave 5 of (3) within an extended bull market cycle
Alternative Count: ABC corrective completion transitioning to new impulse
Immediate Target: 9,300-9,400 (Wave 5 extension)
Extended Target: 9,525-9,600 (Major wave completion zone)
Invalidation Level: Break below 8,950 (Wave 4 low)
Long-term Projection: 10,200-10,500 potential by mid-2026
Wyckoff Market Structure Analysis
Current price action demonstrates characteristics of a Wyckoff Re-accumulation Phase:
Phase: Late Stage Re-accumulation with signs of Markup beginning
Volume Analysis: Institutional absorption evident on declines below 9,100
Price Action: Narrowing consolidation ranges with higher low formation
Composite Operator Activity: Smart money accumulation at support levels
Market Structure: Building energy for next major upward movement
W.D. Gann Comprehensive Analysis
Square of 9 Analysis:
- Current price 9,191.30 positioned near significant Gann resistance level
- Next major Gann square: 9,409 (180-degree rotation from recent low)
- Time and price convergence: September 15-22, 2025 (Autumn Equinox influence)
- Critical Gann levels: 9,216, 9,409, 9,604 (geometric progressions)
Angle Theory Application:
- 1x1 Rising Angle Support: 9,050-9,100 (primary trend support)
- 2x1 Accelerated Angle: 9,300-9,400 (next resistance cluster)
- 1x2 Support Angle: 8,850-8,950 (major correction boundary)
- 1x4 Long-term Support: 8,500-8,600 (secular bull market support)
Time Cycle Analysis:
- 84-day cycle completion anticipated: Mid-September 2025
- Seasonal Gann Pattern: September-October historically bullish for UK markets
- Major time window: October 8-18, 2025 (next significant turning point)
- Annual cycle: Year-end strength typically supports FTSE performance
Price Forecasting & Time Harmonics:
- Immediate resistance: 9,240-9,280
- Primary target: 9,350-9,400
- Extended projection: 9,525-9,600
- Time harmony suggests acceleration after September 18, 2025
---
Japanese Candlestick & Harmonic Pattern Analysis
Recent Candlestick Formations (Daily Chart)
Bullish Engulfing: August 26-27 showing strong buying pressure
Piercing Pattern: August 28-29 confirming support at 9,150 level
Long Lower Shadows: Multiple occurrences indicating accumulation
Volume Validation: Increasing volume on up days, declining on down days
Harmonic Pattern Recognition
Bullish Gartley Completion: 9,050-9,150 zone (recent successful test)
ABCD Pattern Active: Targeting 9,375-9,425 completion zone
Potential Butterfly Formation: Monitoring for completion at 9,500-9,600
Fibonacci Confluence: 1.618 extension projects to 9,387 from August low
Advanced Harmonic Analysis
Three Drives Pattern: Currently developing third drive toward 9,400+
Cypher Pattern Potential: Reversal consideration at 9,550-9,650
Deep Crab Formation: Long-term pattern suggesting 9,800+ targets
AB=CD Equality: Multiple time and price relationships converging
---
Ichimoku Kinko Hyo Analysis
Current Cloud Structure (Daily Chart)
Price Position: Above Kumo cloud indicating bullish trend continuation
Tenkan-sen (9-period): 9,167 (short-term dynamic support)
Kijun-sen (26-period): 9,124 (medium-term trend baseline)
Senkou Span A: 9,146 (leading span A - immediate support)
Senkou Span B: 9,087 (leading span B - key cloud support)
Chikou Span: Positioned above historical price action (bullish confirmation)
Future Kumo Analysis (26 periods ahead):
- Ascending cloud formation supporting continued bullish bias
- Future support zone: 9,200-9,300 (forward-looking cloud support)
- Kumo thickness increasing, suggesting strengthening trend
Ichimoku Trading Signals
TK Cross: Tenkan above Kijun (active bullish signal)
Price vs Cloud: Sustained positioning above cloud
Chikou Span Clear: No interference with historical price levels
Cloud Breakout: Recent bullish breakthrough confirmed
---
Technical Indicators Comprehensive Analysis
RSI (Relative Strength Index) Multi-Timeframe
Daily RSI: 62.4 (healthy bullish momentum, room for expansion)
Weekly RSI: 58.7 (positive trend with upside potential)
4H RSI: 65.8 (approaching but not yet overbought)
RSI Divergence Analysis: No bearish divergence detected, momentum intact
Bollinger Bands Analysis
Current Position: Price approaching upper band (9,220 level)
Band Width: Contracting after recent expansion (consolidation phase)
%B Indicator: 0.72 (strong positioning without extreme reading)
Squeeze Indicator: Preparing for next volatility expansion
VWAP Analysis (Volume Weighted Average Price)
Daily VWAP: 9,154 (key dynamic support level)
Weekly VWAP: 9,089 (intermediate support zone)
Monthly VWAP: 9,067 (major trend support)
Volume Profile: Significant acceptance above 9,100 level
Moving Average Structure Analysis
10 EMA: 9,158 (immediate dynamic support)
20 EMA: 9,136 (short-term trend support)
50 SMA: 9,087 (intermediate trend support)
100 SMA: 9,023 (key trend support)
200 SMA: 8,934 (major secular support)
Moving Average Alignment:
- Perfect bullish alignment across all timeframes
- Golden Cross pattern firmly established (50/200 SMA)
- Price trading above all major moving averages
---
Support & Resistance Analysis
Primary Resistance Levels
1. R1: 9,240-9,280 (immediate Gann resistance cluster)
2. R2: 9,350-9,400 (2x1 Gann angle and harmonic completion)
3. R3: 9,525-9,600 (Major Elliott Wave target and analytical forecast)
4. R4: 9,750-9,800 (Long-term harmonic projection)
5. R5: 10,000-10,200 (Psychological and secular targets)
Primary Support Levels
1. S1: 9,124 (Kijun-sen and recent swing support)
2. S2: 9,050-9,100 (1x1 Gann angle and harmonic support)
3. S3: 8,950-9,000 (Elliott Wave invalidation boundary)
4. S4: 8,850-8,900 (1x2 Gann angle and 100 SMA confluence)
5. S5: 8,750-8,800 (Major correction target zone)
Volume-Based Price Levels
High Volume Node: 9,050-9,150 (institutional accumulation zone)
Low Volume Gap: 9,200-9,300 (potential rapid movement area)
Volume Resistance: 9,400+ (historical distribution levels)
POC (Point of Control): 9,125 (maximum volume acceptance)
---
Multi-Timeframe Trading Strategy Framework
Scalping Strategy (5M & 15M Charts)
5-Minute Timeframe Methodology:
Entry Criteria: Pullbacks to 20 EMA with RSI <30 oversold
Profit Targets: 25-40 points per scalping trade
Stop Loss Parameters: 15-20 points maximum risk exposure
Volume Confirmation: Above-average volume required on breakouts
Optimal Time Windows: 8:00-10:00 AM and 2:00-4:00 PM GMT
15-Minute Scalping Framework:
Range Identification: Current consolidation 9,150-9,220
Breakout Methodology: Volume spike confirmation above 9,220
Mean Reversion: Fade extreme moves beyond 2 standard deviations
Risk Management: Maximum 3 positions simultaneously, 1:1.5 minimum R:R
Intraday Trading Strategies (30M, 1H, 4H)
30-Minute Chart Approach:
Trend Following: Long positions above EMA confluence (9,140)
Pattern Recognition: Flag and pennant completions near resistance
Target Methodology: Initial 9,280, extended 9,350-9,400
Risk Parameters: 50-70 point stops, 2:1 reward-to-risk minimum
1-Hour Chart Strategy:
Momentum Confirmation: MACD histogram expansion on bullish crossovers
Support Trading: Long entries from 9,100-9,150 support zone
Breakout Management: Monitor 9,240 level for continuation signals
Session Focus: London session volatility (8:00 AM - 4:30 PM GMT)
4-Hour Swing Framework:
Cloud Strategy: Long positions on successful Ichimoku cloud bounces
Elliott Wave Guidance: Ride Wave 5 extensions toward major targets
Fibonacci Utilization: 38.2% and 61.8% retracements for optimal entries
Position Duration: 2-7 days typical holding period for swing trades
Swing Trading Strategy (Daily, Weekly, Monthly)
Daily Chart Methodology:
Breakout Strategy: Long on sustained breaks above 9,240 with volume
Accumulation Zones: Build positions on tests of 9,050-9,150
Target Sequence: 9,350 → 9,525 → 9,750 progressive profit-taking
Position Management: Scale entries across multiple time frame confirmations
Weekly Chart Perspective:
Primary Trend: Strongly bullish above 8,950 weekly support
Swing Objectives: 9,525-9,600 zone for major profit realization
Risk Assessment: Weekly closes below 8,850 signal trend reversal
Monthly Chart Analysis:
Secular Trend: Multi-year bull market structure intact
Long-term Targets: 10,500-11,000 by 2026-2027 projections
Major Support: 8,200-8,500 (unlikely to test in current cycle)
---
Daily Trading Plan: September 2-6, 2025
Monday, September 2, 2025
Market Status: Full UK trading session
Technical Setup:
Resistance Levels: 9,240, 9,280, 9,320
Support Levels: 9,150, 9,100, 9,050
Expected Range: 9,120-9,260
Trading Strategy:
Morning Session (8:00-12:00 GMT): Monitor for overnight gap analysis
Afternoon Session (12:00-16:30 GMT): Focus on US market correlation
Primary Setup: Long 9,140-9,170 targeting 9,240-9,280
Alternative Setup: Fade any move above 9,280 without volume confirmation
Risk Considerations:
- Bank of England policy speculation impact
- End-of-month institutional flows
- Brexit-related news sensitivity
Tuesday, September 3, 2025
Market Outlook: Post-Labor Day momentum with full global participation
Key Events & Strategy:
UK Economic Data: Manufacturing PMI and construction data releases
Technical Focus: 9,240 breakout attempt with volume validation
Entry Strategy: Long 9,180-9,220 on consolidation completion
Target Areas: 9,300-9,350 on successful breakout scenarios
Risk Management:
- Reduced position sizes due to data event risk
- Monitor GBP/USD correlation for confirmation signals
- Prepare for potential volatility around PMI releases
Wednesday, September 4, 2025
Market Outlook: Mid-week consolidation with building momentum
Strategic Framework:
Technical Pattern: Monitor for bull flag or pennant completion
Volume Analysis: Require institutional participation for sustained moves
Support Testing: Strength of 9,150-9,180 zone crucial for continuation
Momentum Signals: MACD and RSI alignment for directional bias
Trading Approach:
Range Strategy: Buy support, sell resistance until breakout
Breakout Preparation: Position for 9,240+ level clearance
Risk Assessment: Political developments and central bank communications
Thursday, September 5, 2025
Market Outlook: Pre-weekly close positioning dynamics
Key Considerations:
Technical Levels: 9,300-9,350 resistance cluster testing
Institutional Activity: Pension fund rebalancing flows
Pattern Development: Harmonic pattern completion monitoring
Global Correlation: Monitor S&P 500 and DAX for confirmation
Execution Strategy:
Momentum Continuation: Above 9,280 favors 9,400 target
Profit-Taking Zones: Scale out at 9,320, 9,380, 9,425
Risk Management: Tighten stops as resistance approaches
Friday, September 6, 2025
Market Outlook: Weekly close significance and weekend positioning
Final Session Strategy:
Weekly Close Target: Above 9,200 maintains bullish structure
Profit Preservation: Secure gains from successful breakout trades
Gap Risk Management: Prepare for weekend news flow impact
Position Review: Maintain swing positions with appropriate stops
Critical Levels:
Weekly Bullish: Close above 9,220
Weekly Neutral: 9,150-9,220 range
Weekly Bearish: Close below 9,150
---
Macroeconomic & Policy Analysis
Bank of England Policy Impact
The Bank of England's recent monetary policy decisions significantly influence FTSE 100 performance. The Committee voted to reduce Bank Rate to 4% in August 2025, representing continued accommodation that supports equity valuations and corporate profitability across the index.
Interest Rate Environment
The next Bank Rate decision is due on September 18, 2025, with economists and markets expecting at least one more rate cut in 2025. This dovish policy trajectory provides fundamental support for equity market performance.
Economic Growth Outlook
The UK economic environment presents improving conditions with downside domestic and geopolitical risks around economic activity remaining, although trade policy uncertainty has diminished somewhat. This stabilization supports continued FTSE 100 outperformance.
Inflation Dynamics
The Bank of England predicted that inflation would follow a bumpy path and expects it to rise to around 4% in September, but this increase should be only temporary, and inflation should fall back to 2%.
Key Risk Factors
1. Monetary Policy Uncertainty: Timing and magnitude of future rate cuts
2. Global Trade Relations: Post-Brexit trade relationship developments
3. Currency Impact: GBP strength/weakness affecting multinational earnings
4. Energy Sector Exposure: Oil price volatility impacting major components
5. Political Stability: Government policy consistency and business confidence
---
Sector Analysis & FTSE 100 Component Review
Sector Performance Dynamics
Financial Services: Benefiting from interest rate normalization process
Energy Sector: Oil majors providing dividend yield attraction
Consumer Goods: Defensive characteristics supporting index stability
Technology: Limited exposure compared to global peers, potential upside
Healthcare: Pharmaceutical giants providing stability and growth
Dividend Yield Analysis
The FTSE 100's attractive dividend yield continues to support international investor interest, with share buybacks remaining a significant component of shareholder returns supported by robust cash generation of these companies.
Valuation Assessment
There's little doubt that the UK's blue-chip index is undervalued compared with overseas peers, providing fundamental support for continued outperformance and multiple expansion potential.
---
Multi-Asset Correlation Analysis
Currency Relationships
GBP/USD Impact: Inverse correlation with multinational earnings (0.65 negative)
EUR/GBP Influence: European trade relationship effects (0.45 positive)
USD Strength: Dollar appreciation pressures on international revenues
Global Index Correlations
S&P 500 Relationship: Moderate positive correlation (0.58)
DAX Connection: Strong European correlation (0.74)
Nikkei Influence: Asian market sentiment transmission (0.42)
Commodity Exposure
Oil Price Sensitivity: Energy sector weighting creates positive correlation
Gold Relationship: Limited direct exposure, inverse correlation during risk-off
Base Metals: Industrial exposure through mining components
---
Risk Management Comprehensive Framework
Position Sizing Methodology
Scalping Operations: 0.5-1% account risk per individual trade
Intraday Positions: 1-2% maximum account risk exposure
Swing Positions: 2-3% account risk per established position
Maximum Portfolio Exposure: 7% total UK100-related risk allocation
Stop-Loss Implementation
Scalping Stops: 15-25 points maximum loss per trade
Intraday Stops: 50-75 points based on volatility conditions
Swing Trading Stops: Below key support levels (9,050 for current longs)
Technical Invalidation: Elliott Wave and pattern breakdown levels
Profit-Taking Strategy
Scaling Method: Take 30% at first target, 40% at second target, hold 30%
Trailing Stops: Implement after achieving 2:1 favorable risk-reward
Time-Based Exits: Close before major BoE announcements and data releases
Pattern-Based Exits: Honor harmonic and Elliott Wave completion zones
Risk Monitoring Systems
Daily Risk Assessment: Maximum drawdown tolerance 3%
Weekly Risk Review: Position correlation and concentration analysis
Monthly Performance Evaluation: Strategy effectiveness and adjustment needs
Stress Testing: Scenario analysis for major market disruptions
---
Weekly Outlook Probability Matrix
Bullish Scenario (Probability: 70%)
Primary Catalysts:
- Bank of England maintains accommodative policy stance
- UK economic data shows continued stability/improvement
- Technical breakout above 9,240 with volume confirmation
- Global risk-on sentiment supporting equity markets
Price Objectives:
- Initial Target: 9,300-9,350
- Extended Target: 9,400-9,525
- Optimistic Scenario: 9,600+
Supporting Factors:
- Dividend yield attraction for international investors
- Undervaluation relative to global peers
- Technical momentum building across timeframes
Neutral/Consolidation Scenario (Probability: 20%)
Characteristics:
- Range-bound trading between 9,100-9,280
- Mixed economic signals and policy uncertainty
- Technical indecision at key resistance levels
- Reduced trading volumes and institutional activity
Trading Parameters:
- Upper Range: 9,250-9,280
- Lower Range: 9,100-9,150
- Strategy Focus: Range trading and volatility contraction plays
Bearish Scenario (Probability: 10%)
Risk Catalysts:
- Unexpected hawkish shift from Bank of England
- Significant deterioration in UK economic indicators
- Major geopolitical shock or financial system stress
- Technical breakdown below critical support at 9,050
Downside Objectives:
- Initial Target: 8,950-9,000
- Extended Target: 8,800-8,850
- Stress Scenario: 8,600-8,750
---
Advanced Trading Techniques & Market Microstructure
Order Flow Analysis
Institutional Activity: Large block trades above 9,150 indicate accumulation
Retail Sentiment: Contrarian indicator showing excessive bearishness
Options Market: Put/call ratio neutral, no extreme positioning detected
ETF Flows: Consistent inflows into UK equity ETFs supporting demand
High-Frequency Trading Considerations
Algorithmic Support: 9,150-9,180 zone shows HFT buying interest
Liquidity Zones: Deep liquidity above 9,200 and below 9,100
Speed of Execution: Critical during London market open and close
Spread Dynamics: Tightening spreads indicating improving liquidity
Options Market Intelligence
Gamma Exposure: Positive gamma above 9,180, negative below 9,100
Key Strike Concentrations: 9,200 calls and 9,100 puts high open interest
Implied Volatility: Currently underpriced relative to realized volatility
Options Skew: Slight put premium indicating modest hedging activity
---
Seasonal & Cyclical Analysis
Historical Seasonal Patterns
September Performance: Historically mixed, average +0.8% monthly return
Q4 Seasonality: Strong fourth quarter performance, average +4.2%
Year-End Effects: Portfolio rebalancing typically supports FTSE 100
Dividend Calendar: Major distributions in Q1 and Q3 affecting flows
Economic Cycle Positioning
Current Phase: Late cycle expansion with monetary accommodation
Sector Rotation: Value sectors outperforming growth in current environment
Interest Rate Cycle: Declining rate environment supporting equity multiples
Credit Cycle: Stable credit conditions supporting corporate expansion
---
Technology & Innovation Impact
Fintech Integration
Digital Banking: Major FTSE components adapting to digital transformation
Payment Systems: Evolution affecting traditional banking models
Regulatory Technology: Compliance costs and operational efficiency factors
Cryptocurrency Influence: Limited direct exposure, regulatory developments
ESG Considerations
Environmental Standards: Increasing focus on sustainability metrics
Social Governance: Stakeholder capitalism trends affecting valuations
Regulatory Compliance: ESG reporting requirements and investment flows
Transition Risks: Energy transition affecting traditional sector weights
---
Conclusion & Strategic Outlook
The FTSE 100 Index (UK100) presents a compelling technical and fundamental investment case with multiple confluences supporting continued upside momentum toward the analytical forecast target of £9,525.47 by the end of 2025. The combination of accommodative Bank of England policy, attractive dividend yields, and constructive technical patterns creates a favorable risk-reward environment.
Critical Success Factors:
1. Monetary Policy Support: Continued BoE accommodation through 2025
2. Technical Breakout Confirmation: Sustained move above 9,240 with volume
3. Economic Stability: UK data showing resilience and gradual improvement
4. Global Risk Environment: Maintained risk-on sentiment supporting equities
Key Monitoring Priorities:
1. September 18 BoE Decision: Next policy rate announcement impact
2. Technical Level Behavior: Price action at 9,240-9,280 resistance cluster
3. Volume Patterns: Institutional participation in breakout attempts
4. Global Correlation Changes: Relationship dynamics with major indices
Strategic Recommendation:
Maintain constructive bias with tactical flexibility, emphasizing disciplined risk management while positioning for probable continuation of the multi-year bull market in UK equities. The September 15-22 Gann time window represents a critical juncture for intermediate-term directional confirmation.
The confluence of technical, fundamental, and policy factors suggests high probability for achieving the 9,400-9,525 target zone within the forecast timeframe, while downside risk appears well-contained above the 9,050 support complex.
---
*This comprehensive analysis is provided for educational and informational purposes only. It does not constitute investment advice, and readers should conduct their own research and consult with qualified financial professionals before making investment decisions. Always implement appropriate risk management strategies and position sizing methodologies.*
---
For individuals seeking to enhance their trading abilities based on the analyses provided, I recommend exploring the mentoring program offered by Shunya Trade. (Website: shunya dot trade)
I would appreciate your feedback on this analysis, as it will serve as a valuable resource for future endeavors.
Sincerely,
Shunya.Trade
Website: shunya dot trade
Disclaimer: This post is intended solely for educational purposes and does not constitute investment advice, financial advice, or trading recommendations. The views expressed herein are derived from technical analysis and are shared for informational purposes only. The stock market inherently carries risks, including the potential for capital loss. Therefore, readers are strongly advised to exercise prudent judgment before making any investment decisions. We assume no liability for any actions taken based on this content. For personalized guidance, it is recommended to consult a certified financial advisor.
GBPUSD Bearish Setup – Rejection at Key Resistance (6H Chart)🧨 OANDA:GBPUSD Bearish Setup – Rejection at Key Resistance (6H Chart)
GBPUSD is showing signs of exhaustion near the 1.36000 resistance zone. A lower high and bearish engulfing candle suggest sellers are stepping in.
🔹 Trade Setup:
Sell Entry: 1.35050
Stop Loss: 1.36000
Take Profit 1: 1.34000
Take Profit 2: 1.33100
Take Profit 3: 1.31500
Risk-reward is favorable, especially if price breaks below 1.33500 with momentum. Watch for confirmation on lower timeframes.
📌 Scaling out at TP1/TP2 is advised. Invalidate the setup if price closes above 1.36000 with strength.
#GBPUSD #ForexTrading #PriceAction #FXSetup #BearishReversal #TradingView #TechnicalAnalysis #SwingTrade #6HChart #ForexStrategy
Psychology Always Matters:
EURGBPHello Traders! 👋
What are your thoughts on EURGBP?
The EUR/GBP pair has broken both its support zone and the ascending trendline.
After a pullback toward the broken zone, price is likely to extend its decline toward the next key downside targets.
Bias: Bearish as long as price remains below the broken support/trendline.
Don’t forget to like and share your thoughts in the comments! ❤️
GBP/USD Buys from 1.35000 back up to 1.36000This week’s focus is on the continuation of the bullish trend, with the main opportunity being a retracement back down into the recent demand zone left behind. From there, I’ll be looking for signs of a Wyckoff distribution to confirm an entry.
If price decides to push higher without retracing, I’ll instead look for a Wyckoff accumulation to form near the 5H supply zone that I’ve marked above current price.
Confluences for GU Buys:
- Recent break of structure to the upside confirms bullish intent.
- DXY has been bearish, supporting a bullish GU outlook.
- A retracement would allow price to re-distribute near the 5H demand zone.
- Clear liquidity above that still needs to be taken.
P.S. If price breaks structure to the downside, it could form a new supply zone — giving earlier sell opportunities. But if nothing confirms, then staying patient and waiting on our hands is also a valid option.
GBPAUDHello Traders! 👋
What are your thoughts on GBPAUD?
The GBP/AUD pair has reached a significant resistance zone.
We anticipate some consolidation or choppy movement in this area, followed by a potential bearish reversal toward lower support levels.
As long as price remains below the resistance, the bias remains bearish.
Don’t forget to like and share your thoughts in the comments! ❤️
Fundamental Market Analysis for August 14, 2025 GBPUSDEvent to pay attention to today:
15:30 EET. USD - Unemployment Claims
Signs of cooling in the US labor market have pushed futures to expect a series of rate cuts before the end of the year. This, in turn, could lead to a decline in the dollar against the pound sterling. Federal fund futures traders now estimate the probability of a 25 basis point (bp) cut at the September meeting at nearly 94%, compared to 85% before the inflation data was released.
Investors are preparing for the release of the US Producer Price Index (PPI) report on Thursday. The overall PPI is expected to show a 2.5% year-on-year increase in July, while the core PPI is expected to show a 2.9% year-on-year increase for the same period.
Data from the Office for National Statistics (ONS) released on Tuesday showed that the UK unemployment rate remained unchanged at 4.7% for the three months to June, in line with estimates. This is the highest rate since July 2021. Meanwhile, average earnings excluding bonuses remained at 5.0% for the three months to June.
Traders will be watching the UK's second-quarter GDP report closely, as it may provide some clues about the direction of interest rates in the country.
Trading recommendation: BUY 1.3610, SL 1.3570, TP 1.3670
Fundamental Market Analysis for August 11, 2025 GBPUSDThe Bank of England (BoE) cut its key interest rate by 25 basis points (bps) last week, as expected, bringing the base rate down to 4%, its lowest level since 2023. However, the narrow 5-4 vote indicated greater resistance to rate cuts than expected by the markets, prompting traders to reduce their bets on aggressive easing by the BoE.
In addition, traders are also factoring in the likelihood that the US central bank will cut interest rates at least twice before the end of this year.
Meanwhile, expectations for a dovish Fed policy were confirmed by comments from Fed Governor Michelle Bowman on Saturday, who said that three interest rate cuts would likely be appropriate this year. Bowman added that the clear weakening of the labor market outweighs the risks of future inflation. This, in turn, should limit the decline of the GBP/USD pair.
The latest US consumer inflation data will be released on Tuesday, while preliminary UK second-quarter GDP data and the US producer price index (PPI) will be released on Thursday. These important data points should provide significant momentum to spot prices and help determine the next phase of the directional movement.
Trading recommendation: BUY 1.3490, SL 1.3410, TP 1.3570
GBPUSD DOWNSIDE UPDATE The dollar index (DXY00) on Tuesday rose by +0.22% and posted a 5-week high. The dollar has carryover support from Monday following the EU-US trade deal that is seen as favoring the US. Also, expectations for the Fed to keep interest rates unchanged at the end of Wednesday's 2-day FOMC meeting are supportive of the dollar. The dollar extended its gains after the US Jun advance goods trade deficit unexpectedly shrank, a supportive factor for Q2 GDP, and after July consumer confidence rose more than expected.
EUR/GBP: Bullish Stance Above 0.8640This signal outlines a tactical long entry on EUR/GBP, positioning for a bullish resolution from today's major fundamental events.
📰 Fundamental Thesis
This position is taken ahead of the two primary market movers: the ECB rate decision and the UK PMI data. The core thesis is that the ECB policy statement will be the dominant catalyst, providing strength to EUR that will outweigh the impact of the UK data release.
📊 Technical Thesis
The trade is defined by a sound technical structure. The stop loss is anchored beneath the critical support zone at 0.8640. The profit target is set to challenge the resistance area just above 0.8722. This setup offers a favorable and clearly defined risk-to-reward profile.
🧠 Risk Management
Execution is timed before extreme event-driven volatility. Adherence to the stop loss is critical to manage the inherent risk of this pre-news strategy.
Trade Parameters
⬆️ Direction: Long (Buy)
➡️ Entry: 0.86690
⛔️ Stop Loss: 0.86344
🎯 Target: 0.87382
✅ Risk/Reward: 1:2
GBPUSDHello Traders! 👋
What are your thoughts on GBPUSD?
GBP/USD has broken support zone and its ascending trendline, indicating a shift in momentum.
The pair is currently in a pullback phase, retesting the broken support zone, which now acts as resistance.
Once the pullback is complete, we expect further downside toward the next identified support level.
As long as the price remains below the broken zone, the bearish outlook remains valid, and rallies may offer sell opportunities.
Don’t forget to like and share your thoughts in the comments! ❤️
Pound Pressured by Firm Dollar and UK Data ReviewThe British pound held near $1.339 on Friday, its lowest level in eight weeks, as the U.S. dollar strengthened. The dollar reached a three-week high after President Trump confirmed he would not remove Fed Chair Jerome Powell, despite continued criticism of the Fed’s careful stance on rate cuts. In the UK, markets are closely reviewing recent employment and inflation data. While the labor market shows signs of weakness, updated tax records suggest the slowdown may not be as severe as previously thought.
Resistance is at 1.3535, while support holds at 1.3380.
GBP/JPY H1 | Bullish uptrend to extend higher?GBP/JPY is falling towards a pullback support and could potentially bounce off this level to climb higher.
Buy entry is at 199.42 which is a pullback support.
Stop loss is at 199.08 which is a level that lies underneath a swing-low support and the 23.6% Fibonacci retracement.
Take profit is at 199.79 which is a swing-high resistance.
High Risk Investment Warning
Trading Forex/CFDs on margin carries a high level of risk and may not be suitable for all investors. Leverage can work against you.
Stratos Markets Limited (tradu.com ):
CFDs are complex instruments and come with a high risk of losing money rapidly due to leverage. 66% of retail investor accounts lose money when trading CFDs with this provider. You should consider whether you understand how CFDs work and whether you can afford to take the high risk of losing your money.
Stratos Europe Ltd (tradu.com ):
CFDs are complex instruments and come with a high risk of losing money rapidly due to leverage. 66% of retail investor accounts lose money when trading CFDs with this provider. You should consider whether you understand how CFDs work and whether you can afford to take the high risk of losing your money.
Stratos Global LLC (tradu.com ):
Losses can exceed deposits.
Please be advised that the information presented on TradingView is provided to Tradu (‘Company’, ‘we’) by a third-party provider (‘TFA Global Pte Ltd’). Please be reminded that you are solely responsible for the trading decisions on your account. There is a very high degree of risk involved in trading. Any information and/or content is intended entirely for research, educational and informational purposes only and does not constitute investment or consultation advice or investment strategy. The information is not tailored to the investment needs of any specific person and therefore does not involve a consideration of any of the investment objectives, financial situation or needs of any viewer that may receive it. Kindly also note that past performance is not a reliable indicator of future results. Actual results may differ materially from those anticipated in forward-looking or past performance statements. We assume no liability as to the accuracy or completeness of any of the information and/or content provided herein and the Company cannot be held responsible for any omission, mistake nor for any loss or damage including without limitation to any loss of profit which may arise from reliance on any information supplied by TFA Global Pte Ltd.
The speaker(s) is neither an employee, agent nor representative of Tradu and is therefore acting independently. The opinions given are their own, constitute general market commentary, and do not constitute the opinion or advice of Tradu or any form of personal or investment advice. Tradu neither endorses nor guarantees offerings of third-party speakers, nor is Tradu responsible for the content, veracity or opinions of third-party speakers, presenters or participants.
LONG ON GBP/USDGU is currently in its pullback phase of its uptrend.
We have a nice sell side Liquidity sweep being completed at this moment.
Price should now tap into previous demand that broke a high to repeat history and rise again.
Very Nice Setup over 300 pips on the table to the previous high/supply zone.