POWER GRID: STRONG FUNDAMENTALSSl - 211
Start accumulating at lower levels because the day it will give rally, catching it will be next to impossible.
After 238 a big breakout is pending .
Start buying by maintaining a perfect SL.
Post your queries in Comment section or DM me.
Power

Why The Rich Get Richer. It Is Your CHOICE
What is the difference between the rich vs poor mindset? How do the successful differ from the rest of us?
So many people do not obtain financial freedom because they do not have one thing: the right mindset. Everything starts with how you think about money, wealth, and success. It is not a matter of luck, birth, or connections.
The biggest differences between rich and poor people can be traced back to mindset, outlook, and behavior. The rich and the poor don’t only differ in how much they have in their pocket, but also in how they think. Rich people have a way of thinking that is different from poor and middle-class people.
They think differently about money, wealth, themselves, other people, and life . By doing so, you will have some alternative beliefs in your mind from which to choose. In this way, you can catch yourself thinking as poor people do and quickly switch over to how rich people think.
A positive attitude, focusing on doing the right thing overlooking good, becoming a continual learner and careful risk management are all differences between the rich and poor. This reduces their odds of becoming poor after disaster strikes, and it helps them achieve their financial goals over the long-term.
A rich mindset will tell you to be self-sufficient & build multiple streams of income . It will tell you to build a team of smarter people than you to leverage the efforts of talented people. The mindset of the rich is the most decisive reason why “the rich keep getting richer, while the poor get poorer.” Bill Gates has been quoted as saying, “If we weren't still hiring great people and pushing ahead at full speed, it would be easy to fall behind and become some mediocre company.”
So, which mindset do you have?
❗️Please, support this idea with like and comment!
Thank will help a lot!
Also, subscribe to my social networks,
the link is below!❗️

Summer pool play LESLGo long LESL. Play on pools and increased home-ownership/pool installations over the pandemic. The upward channel has remained intact despite the market-wide correction. Could be a good trade for the summer and possibly beyond depending on how the company performs and the quality of the earnings/growth reported since it did just recently start trading publicly.
The current chlorine shortage and pent-up demand for more pools will give Leslie's pricing power. It is also under-owned based on RSI with MACD looking ready to bottom-out and head up for a bullish MACD cross.

MASS ADOPTION BEATING SELLING POWERS - FUTURES - BTC - DAILYWe have observed possible very strong selling powers trying to influence the prince in the bearish direction.
The red arrows are showing when strong selling power have possibly failed.
Green arrows are showing some strong buying responses. Other bullish responses exists but are continuous drawing the hypothesis of small investors entering the market at those very high prices.
The power of believe in cryptocurrencies and their future utility in the society brings more and more people in.
The blue trending line is probably showing the trend of BTC. Dollar cost averaging is likely to be a good strategy to accumulate and benefit the most of it. More and more companies are studying the possibility of adding BTC Bitcoin to their balancesheet.

REEF recovering power after Sam Trabucco's FUD attack.As you can see, REEF defeated the Sam Trabucco's FUD attack.
This is not the first time that REEF got fud-attacked, and always the crypto defeats these criminal people.
Why they attack REEF? Because they feel envy and fear by the great potential this project has, and the very good person and CEO that Denko is.
Now, you can see why is too important keep calm and NEVER sell when a FUD attack comes to your crypto.
This is a very great experience for all.
Don't worry, REEF will go to the moon.
If you are out of REEF, buy it right now and add to your portfolio; this is one of the most important and powerfull crypto projects right now.
RLong

RLong

0.055 level broken! GOOD NEWS!REEF has broken the hard 0.055 level with more than $2 M on Binance order book.
This stablished a new very high power for REEF!
Next power target: 0.056600
RLong

USDCAD: into Bullish week ?When it comes to inflation, everyone is watching. On 17 March, Inflation rates in Canada will be released; meanwhile bulls are trying to lift back this one that is sitting inside a support zone meaning that we will be looking for buy opportunities. If the price will retest one more time the upper trendline, a buy can be executed. Also RSI is breaking 30% level, adding more confirmation on this one.
Wait and Trade Safe

TORRENT POWER is too far from its POCThe stock seems to be having jitters of being too pricey. There has been formation of inside bar on daily and the stock is too far from moving averages thus a resistance on 20 EMA and thus a fall downward to the red line being 200 EMA would be easily achievable in coming time within 2 weeks.

Congratulations for all, you're the best!Like I've said some days ago, we are launching to the moon and beyond.
You're great, congratulations to all holders, you're the most beautiful and rude people.
Now, we have a mission.
All in this universe is energy; we are going to the moon, but we need attract more positiveness and good vibes too, that's the key to reach the triumph faster.
So, the following thing that ALL we do, is a vision board with our REEF charts.
Create charts with anything indicating the price will explode to Jupiter.
Talk to all your trading friends about REEF too, and share information on social media. This is a very recently project, so, people needs to know it; this will bring a faster growth.
All days give thanks to the universe and the nature for the great person you are, and feel your upcoming triumphs always, like if you have them in your hands, because yes, you already have them.
If your friend asks "What Is Reef (REEF)?" just say:
Reef is a DeFi platform built on Polkadot that aims to deliver cross-chain trading. A yield engine and a smart liquidity aggregator are among the project’s offerings.
Work began on the project in the second half of 2020. Those behind Reef argue that the process of trading, lending and staking crypto is currently fragmented — creating “a painful experience for all of its participants.”
Reef aggregates liquidity and provides automation. It also aims to address the drawbacks associated with existing trading platforms. While centralized exchanges are prone to security breaches, decentralized rivals can lack liquidity and are often difficult to use.
Who Are the Founders of Reef?
Reef was founded by Denko Mancheski. His motivation was to remove technical barriers to entry for retail investors who want to get involved with DeFi — and offer a straightforward decision-making process that takes a user’s appetite for risk into account.
Mancheski wanted to help crypto newcomers overcome the complexities associated with using order books, and enable them to learn how different protocols work with ease.
Born in Macedonia, Mancheski said that his passion for fintech led to him being introduced to blockchain technology. He has described forming a competent team as the biggest challenge associated with bringing Reef to life.
When asked about the personal attributes that will help him become a successful entrepreneur, he added: “I have a very addictive personality — I just can’t stop doing something until I get to the imaginary goal that I set for myself.”
Mancheski previously worked as a chief technology officer for Adel , a global crypto community that serves as a “technology incubator for blockchain innovation.” He was also appointed as CTO for Viewly, a social video platform without advertisements.
What Makes Reef Unique?
Reef is geared towards newcomers, as well as current DeFi users who find it difficult to keep up with the best investment strategies. The company also wants to tackle the high gas fees that are seen on the Ethereum blockchain, which some claim renders DeFi protocols “unusable.”
When it comes to Reef’s unique attributes, one is linked to how any DeFi protocol can integrate into its operating system. Users can enter and exit into their chosen positions in a single click — and removes some of the hassle associated with managing liquidity pool tokens.
Because of how it has been built on Polkadot, Reef is able to support DeFi protocols on Avalanche, Moonbeam and Plasma, as well as on Ethereum and the Binance Smart Chain. As a result, Reef users have access to a broader number of platforms without requiring multiple accounts and a myriad of usernames and passwords that can be difficult to keep track of.
So, dear friend, think positive, you're a succesful person, money comes easily and fastly to you.
RLong

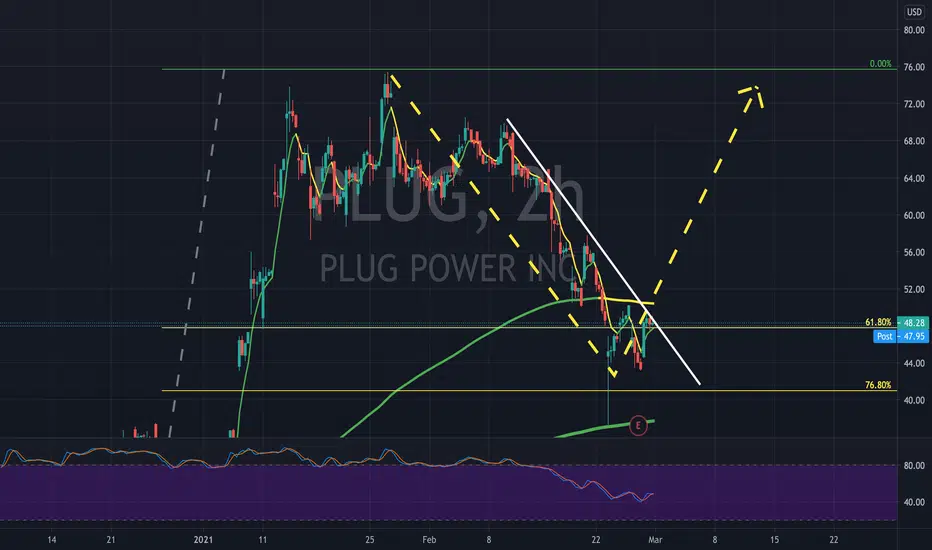
Plug Power - PLUG - Potential 50% gain?Plug Power - PLUG - Potential 50% gain if support holds and trend line broken? Is it time for a rise in price?
Bitcoin regression to hit $1-5 million within 12 years Was Jack Dorsey correct in predicting "bitcoin would likely become the single global currency within 10 years, “but it could go faster.” back in 2018?
Trolololo's famous 2014 regression predicted a price of $100,000 for bitcoin by July 2021 after correctly predicting a price in excess of $10,000 in 2017. The $100k target remains to be achieved, but seems likely based on current trends and momentum.
Bitcoin logarithmic power law predicts a Bitcoin price by 2032 of at least $1 million and as high as $7 million by 2032, which would put bitcoin in a similar ballpark in terms of total market as of Gold.
Based on "final" destinations and measuring the power law channel based on previous tops, a high of between $95k-150k is possible to estimate for the current halving cycle, assuming the cycle high is complete before the end of 2021, with a cycle low excpected between $20k and $50k before 2024.

$NEE safe long, slow and steady renewable utility NEE
Next Era
Recently did a split, so cheaper to get in. 4% yield, great mix of growth and dividend, and is a utility so even if we double dip into recession utilities should stay strong in the years to come.
First target @86

Here will be the price.Be patient, REEF accumulation is being completed.
Today RVN is on $0,26 with a supply of 8,1 Billions.
REEF has ONLY 3,02 Billions of supply.
Will reach $0,5 in a short time, and it is one of the coins that left without been exploded.
RLong

Power Ledger (POWR) Will Go Higher... Are You Sure?Power Ledger (POWRBTC) is giving out a strong bullish signal today.
We have really high volume as prices challenge/break above EMA50 (0.00000362), bold mangeta line.
Moving above this resistance level, can send prices straight up (green arrow).
What is it going to be?
Will Power Ledger move back lower or will it continue up?
The chart is saying UP!
I feel the same, what's your take?
Leave a comment below.
Thanks a lot for your support.
Namaste.
PLong

BHEL- Could be a good snack to your portfolioCrazy volumes after a decade or so. Inverse Head & Shoulder break out and long term trendline breakout.
Something fat for your wallet is cooking here.

powr has got several awesome bullish awesome news ,, !! to 550 power has got several awesome bullish awesome news ,, !! expecting to 537 ----> 550 sats ,,, easy (i do insiste that it's about a long term trade 1 to 2 months ^_^ for 70% easy peazy cheesy profits !! i it breaks the 361 sats heavy resistant and it will hopfully ^_^ !
Happy trading to every one ^_^ !!
PLong

litecoin long
The weekly chart shows the strong rise of this currency
IT IS JUST FORECAST
Be profitable


Tata Power - December target Rs. 80++Here is a snapshot of what Tata Power is doing in December 2020.
My target for this is Rs. 80++ (hopefully before Nifty correction starts)

FLUX Power Holdings Y/Y Q1 Revenue Increased By 135%Flux Power Holdings, Inc. engages in the design, development, and sale of rechargeable lithium-ion energy storage systems for industrial applications.
Q1’21 revenue grew 135% to $4.5M compared to Q1’20 revenue of $1.9M
The MARKET CAP is 123.907M.
If you are interested to test some amazing BUY and SELL INDICATORS, which give the signal at the beginning of the candle, not at the end of it, just leave me a message.


Ooops! Drat! GAMR whips NASDAQ!While many were obsessed with Bitcoin and Gold, they missed GAMR! This was certainly a smoother ride to the top, if you caught it in time.
Okayyyyy.. I missed it too! LOL.
Anyways, I'm sharing. We need more people sharing stuff like this when they spot it early on.
Now may not be a good time to go long on GAMR.
Disclaimers : This is not advice or encouragement to trade securities. No predictions and no guarantees supplied or implied. Heavy losses can be expected. Any previous advantageous performance shown in other scenarios, is not indicative of future performance. If you make decisions based on opinion expressed here or on my profile and you lose your money, kindly sue yourself.
