CADJPY: Bearish Forecast & Outlook
The price of CADJPY will most likely collapse soon enough, due to the supply beginning to exceed demand which we can see by looking at the chart of the pair.
Disclosure: I am part of Trade Nation's Influencer program and receive a monthly fee for using their TradingView charts in my analysis.
❤️ Please, support our work with like & comment! ❤️
Prediction

EURGBP: Short Trade with Entry/SL/TP
EURGBP
- Classic bearish formation
- Our team expects pullback
SUGGESTED TRADE:
Swing Trade
Short EURGBP
Entry - 0.8649
Sl - 0.8755
Tp - 0.8738
Our Risk - 1%
Start protection of your profits from lower levels
Disclosure: I am part of Trade Nation's Influencer program and receive a monthly fee for using their TradingView charts in my analysis.
❤️ Please, support our work with like & comment! ❤️

EURUSD: Expecting Bullish Movement! Here is Why:
The recent price action on the EURUSD pair was keeping me on the fence, however, my bias is slowly but surely changing into the bullish one and I think we will see the price go up.
Disclosure: I am part of Trade Nation's Influencer program and receive a monthly fee for using their TradingView charts in my analysis.
❤️ Please, support our work with like & comment! ❤️

GBPCAD: Long Signal with Entry/SL/TP
GBPCAD
- Classic bullish pattern
- Our team expects retracement
SUGGESTED TRADE:
Swing Trade
Buy GBPCAD
Entry - 1.8620
Stop - 1.8602
Take - 1.8662
Our Risk - 1%
Start protection of your profits from lower levels
Disclosure: I am part of Trade Nation's Influencer program and receive a monthly fee for using their TradingView charts in my analysis.
❤️ Please, support our work with like & comment! ❤️

Gold Record Highs Under the Lens of ATAI VPA & VPRCGold Analysis Report
In recent days, as gold has reached new historical highs, two analytical tools have been used to assess the market conditions:
- ATAI Volume analysis with price action V 1.03
- ATAI Volume Pressure Analyzer (VPA)
It is important to emphasize that the gold market is heavily influenced by global economic and political events, and precise volume data is not publicly available. The only volume data considered here comes from OANDA. For this evaluation, a 70-day period has been chosen to study the broader behavioral and volume pattern of gold over the past two months.
Bull Trap Risk Detection (ATAI Volume analysis with price action V 1.03)
In this indicator, Bull Trap detection is based on the interaction of price behavior and order-flow volume. The logic is as follows:
1. Bull Sweep (False Breakout with Long Wick)
- If price exceeds the recent high (`high_level`) but closes back below it, and the upper wick of the candle makes up a sufficiently large fraction of the total range, then a Bull Sweep is detected.
- Formula:
upper_wick_ratio = (high - max(open, close)) / (high - low)
Condition: upper_wick_ratio >= trap_wick_threshold (e.g., 0.6)
2. Bull Break
- If the close is above the breakout level without a long wick, it is treated as a Bull Break.
3. Mismatch Condition
- If the candle is bullish (close > open) but delta ≤ 0 or seller ratio > 50%, then there is a mismatch between price action and order flow.
- Formula (simplified):
mismatchBull = (close > open) and (delta <= 0 or seller_ratio > 0.5)
4. Dominance Inversion
- If buyer volume ranks highest in the lookback window, but cumulative seller volume is greater than buyer volume while the candle is bullish, a dominance inversion occurs.
- Condition:
domInvBull = (rank_buy == 1) and (sum_sell > sum_buy) and (close > open)
5. Low Volume Breakout
- If a bullish breakout occurs with total volume less than the average total volume, then the breakout is flagged as low-volume.
- Condition:
lowVolBull = isBullBreak and (TF_tot < avg_tot)
The module assigns scores to these conditions:
- Sweep: +2
- Break: +1
- Mismatch: +2
- Dominance Inversion: +2
- Low-volume Break: +1
If total score ≥ trap_score_risk (default = 3), then a Bull Trap Risk is flagged. If, within `trap_confirm_bars`, price reverses and closes back below the breakout level, then Bull Trap Risk Confirmed is displayed.
Complementary View (ATAI Volume Pressure Analyzer – VPA)
The VPA indicator, with its left (C→B) and right (B→A) wings and offset capability, allows a parallel evaluation of flow balance. In the current gold chart, the right wing (B→A) reflects weakness on the buyers' side, reinforcing the Bull Trap risk detected by the previous indicator. This alignment strengthens the probability of a bearish scenario.
However, the extent of any downward path will depend on the pivotal price levels where the largest buy and sell volumes were registered over the past 70 days. These are represented by points B1 and S1, clustered around the 3409 USD level.
Notes
- On lower timeframes, accuracy in buy/sell volume calculation depends on the data window. Here, a 1-minute timeframe was selected, which provides ~74 days of buy/sell flow data.
- Gold remains highly sensitive to political and economic news globally.
- This analysis is based solely on mathematical calculations and volume/behavioral pattern recognition. It must not be interpreted as investment advice of any kind.

AUDJPY: Weak Market & Bearish Continuation
The recent price action on the AUDJPY pair was keeping me on the fence, however, my bias is slowly but surely changing into the bearish one and I think we will see the price go down.
Disclosure: I am part of Trade Nation's Influencer program and receive a monthly fee for using their TradingView charts in my analysis.
❤️ Please, support our work with like & comment! ❤️

USDCHF: Bearish Continuation & Short Signal
USDCHF
- Classic bearish pattern
- Our team expects retracement
SUGGESTED TRADE:
Swing Trade
Sell USDCHF
Entry - 0.7954
Stop - 0.7962
Take - 0.7937
Our Risk - 1%
Start protection of your profits from lower levels
Disclosure: I am part of Trade Nation's Influencer program and receive a monthly fee for using their TradingView charts in my analysis.
❤️ Please, support our work with like & comment! ❤️

EURCHF: Bullish Forecast & Outlook
The price of EURCHF will most likely increase soon enough, due to the demand beginning to exceed supply which we can see by looking at the chart of the pair.
Disclosure: I am part of Trade Nation's Influencer program and receive a monthly fee for using their TradingView charts in my analysis.
❤️ Please, support our work with like & comment! ❤️

GOLD: Bullish Continuation & Long Signal
GOLD
- Classic bullish setup
- Our team expects bullish continuation
SUGGESTED TRADE:
Swing Trade
Long GOLD
Entry Point - 3756.7
Stop Loss - 3751.5
Take Profit - 3768.4
Our Risk - 1%
Start protection of your profits from lower levels
Disclosure: I am part of Trade Nation's Influencer program and receive a monthly fee for using their TradingView charts in my analysis.
❤️ Please, support our work with like & comment! ❤️

EURUSD: Expecting Bearish Continuation! Here is Why:
It is essential that we apply multitimeframe technical analysis and there is no better example of why that is the case than the current EURUSD chart which, if analyzed properly, clearly points in the downward direction.
Disclosure: I am part of Trade Nation's Influencer program and receive a monthly fee for using their TradingView charts in my analysis.
❤️ Please, support our work with like & comment! ❤️

AUDNZD: Short Trading Opportunity
AUDNZD
- Classic bearish formation
- Our team expects pullback
SUGGESTED TRADE:
Swing Trade
Short AUDNZD
Entry - 1.1266
Sl - 1.1272
Tp - 1.1255
Our Risk - 1%
Start protection of your profits from lower levels
Disclosure: I am part of Trade Nation's Influencer program and receive a monthly fee for using their TradingView charts in my analysis.
❤️ Please, support our work with like & comment! ❤️

EURCAD: Swing Trading & Technical Analysis
The analysis of the EURCAD chart clearly shows us that the pair is finally about to tank due to the rising pressure from the sellers.
Disclosure: I am part of Trade Nation's Influencer program and receive a monthly fee for using their TradingView charts in my analysis.
❤️ Please, support our work with like & comment! ❤️

NZDUSD: Long Trading Opportunity
NZDUSD
- Classic bullish pattern
- Our team expects retracement
SUGGESTED TRADE:
Swing Trade
Buy NZDUSD
Entry - 0.5858
Stop - 0.5854
Take - 0.5864
Our Risk - 1%
Start protection of your profits from lower levels
Disclosure: I am part of Trade Nation's Influencer program and receive a monthly fee for using their TradingView charts in my analysis.
❤️ Please, support our work with like & comment! ❤️

USDCAD: Will Start Falling! Here is Why:
Looking at the chart of USDCAD right now we are seeing some interesting price action on the lower timeframes. Thus a local move down seems to be quite likely.
Disclosure: I am part of Trade Nation's Influencer program and receive a monthly fee for using their TradingView charts in my analysis.
❤️ Please, support our work with like & comment! ❤️

AUDJPY: Long Trade Explained
AUDJPY
- Classic bullish formation
- Our team expects pullback
SUGGESTED TRADE:
Swing Trade
Long AUDJPY
Entry - 97.434
Sl - 97.350
Tp - 97.587
Our Risk - 1%
Start protection of your profits from lower levels
Disclosure: I am part of Trade Nation's Influencer program and receive a monthly fee for using their TradingView charts in my analysis.
❤️ Please, support our work with like & comment! ❤️

GOLD: Short Trade Explained
GOLD
- Classic bearish pattern
- Our team expects retracement
SUGGESTED TRADE:
Swing Trade
Sell GOLD
Entry - 3726.8
Stop - 3739.3
Take - 3703.3
Our Risk - 1%
Start protection of your profits from lower levels
Disclosure: I am part of Trade Nation's Influencer program and receive a monthly fee for using their TradingView charts in my analysis.
❤️ Please, support our work with like & comment! ❤️

EURUSD: Bullish Continuation is Highly Probable! Here is Why:
The analysis of the EURUSD chart clearly shows us that the pair is finally about to go up due to the rising pressure from the buyers.
❤️ Please, support our work with like & comment! ❤️

SPY: Bearish Continuation & Short Trade
SPY
- Classic bearish setup
- Our team expects bearish continuation
SUGGESTED TRADE:
Swing Trade
Short SPY
Entry Point - 663.63
Stop Loss - 664.95
Take Profit - 661.51
Our Risk - 1%
Start protection of your profits from lower levels
Disclosure: I am part of Trade Nation's Influencer program and receive a monthly fee for using their TradingView charts in my analysis.
❤️ Please, support our work with like & comment! ❤️

USOIL: Market of Buyers
Looking at the chart of USOIL right now we are seeing some interesting price action on the lower timeframes. Thus a local move up seems to be quite likely.
Disclosure: I am part of Trade Nation's Influencer program and receive a monthly fee for using their TradingView charts in my analysis.
❤️ Please, support our work with like & comment! ❤️

BTCUSD: Long Trade with Entry/SL/TP
BTCUSD
- Classic bullish formation
- Our team expects growth
SUGGESTED TRADE:
Swing Trade
Buy BTCUSD
Entry Level - 11515
Sl - 11471
Tp - 11610
Our Risk - 1%
Start protection of your profits from lower levels
Disclosure: I am part of Trade Nation's Influencer program and receive a monthly fee for using their TradingView charts in my analysis.
❤️ Please, support our work with like & comment! ❤️

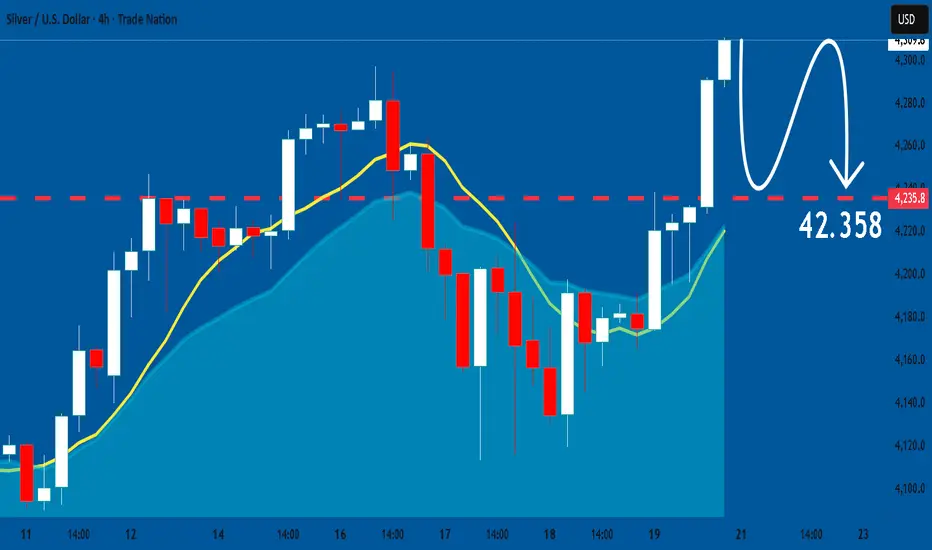
SILVER: Market Sentiment & Price Action
Remember that we can not, and should not impose our will on the market but rather listen to its whims and make profit by following it. And thus shall be done today on the SILVER pair which is likely to be pushed down by the bears so we will sell!
Disclosure: I am part of Trade Nation's Influencer program and receive a monthly fee for using their TradingView charts in my analysis.
❤️ Please, support our work with like & comment! ❤️
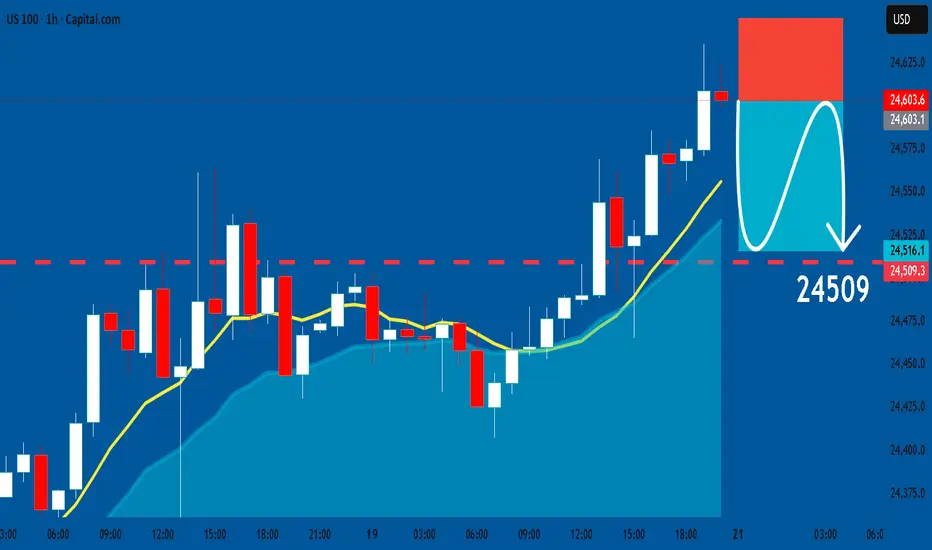
US100: Short Signal with Entry/SL/TP
US100
- Classic bearish formation
- Our team expects fall
SUGGESTED TRADE:
Swing Trade
Sell US100
Entry Level - 24603
Sl - 24651
Tp - 24509
Our Risk - 1%
Start protection of your profits from lower levels
Disclosure: I am part of Trade Nation's Influencer program and receive a monthly fee for using their TradingView charts in my analysis.
❤️ Please, support our work with like & comment! ❤️
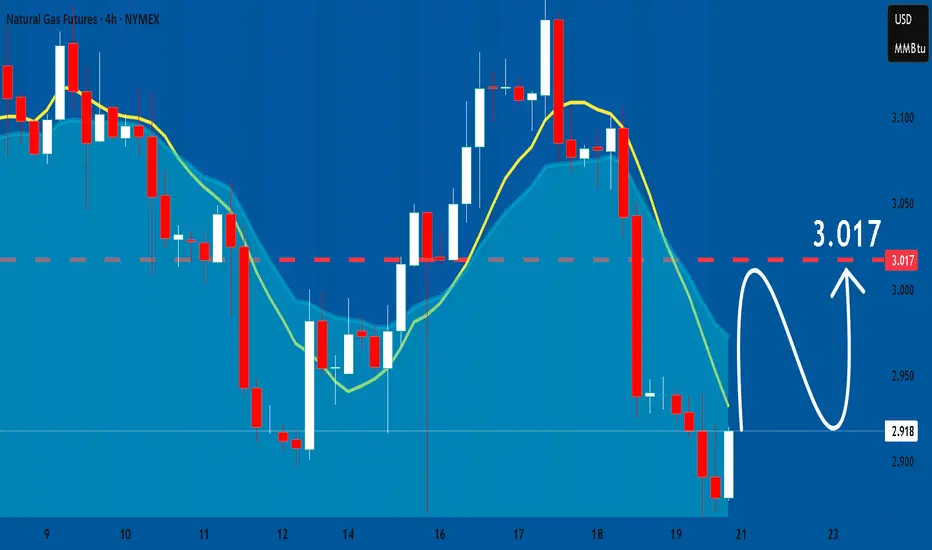
NATGAS: Growth & Bullish Forecast
Balance of buyers and sellers on the NATGAS pair, that is best felt when all the timeframes are analyzed properly is shifting in favor of the buyers, therefore is it only natural that we go long on the pair.
Disclosure: I am part of Trade Nation's Influencer program and receive a monthly fee for using their TradingView charts in my analysis.
❤️ Please, support our work with like & comment! ❤️